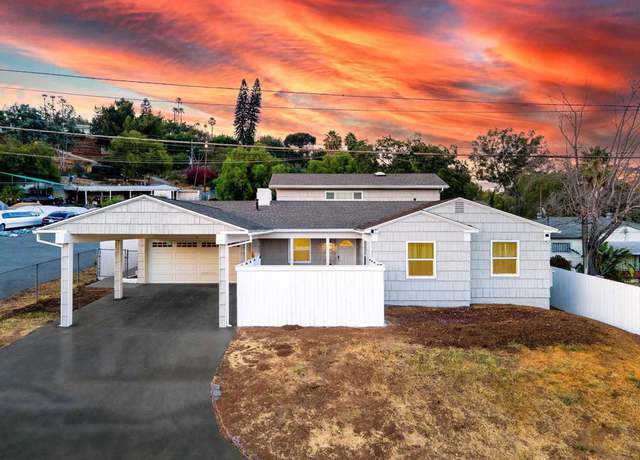
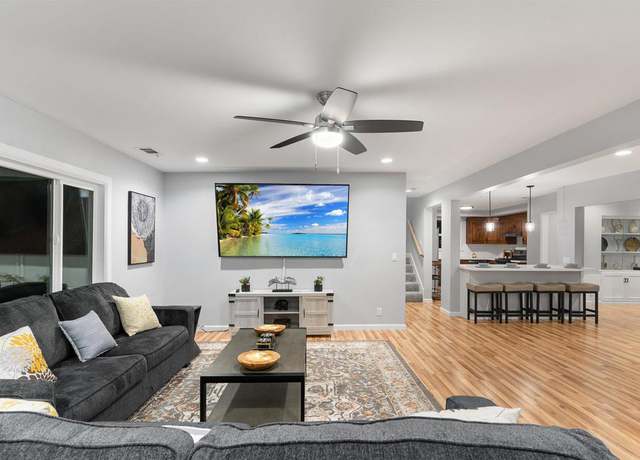
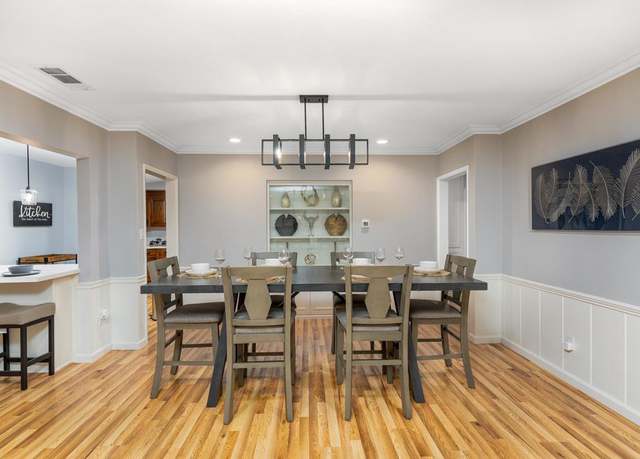
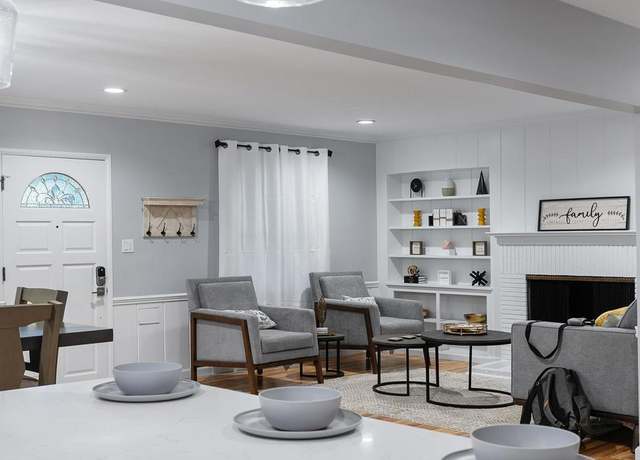
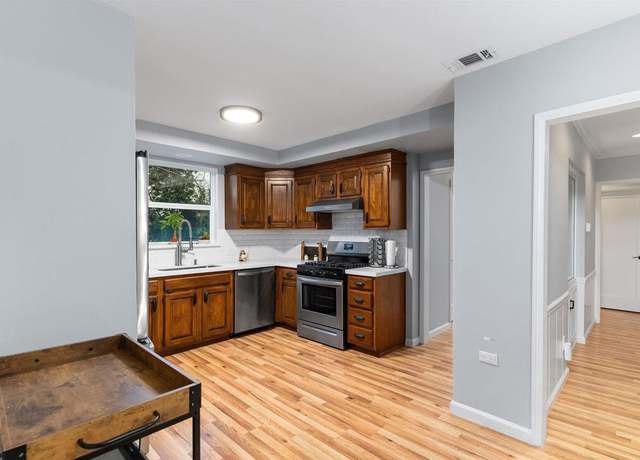
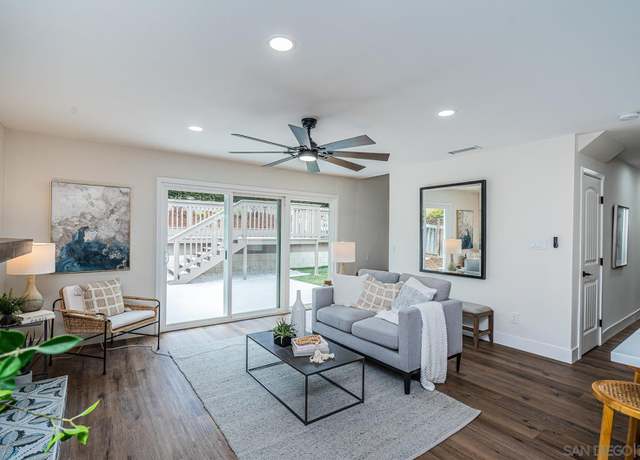
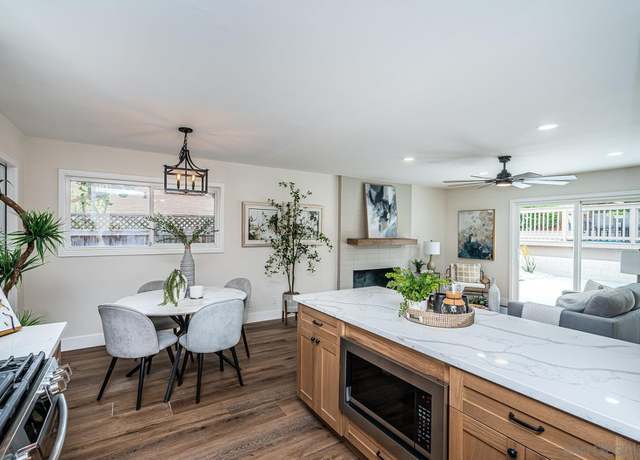
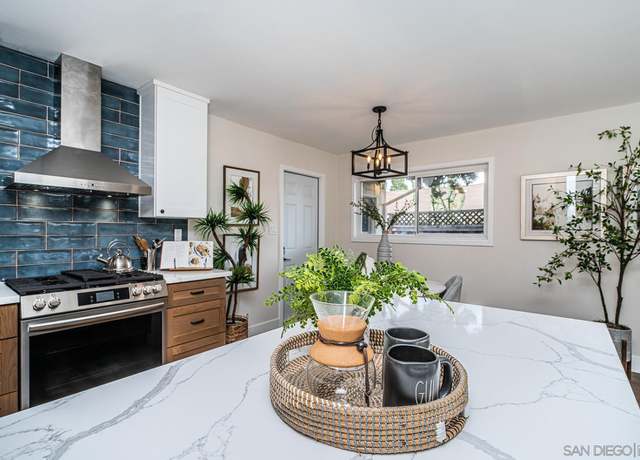
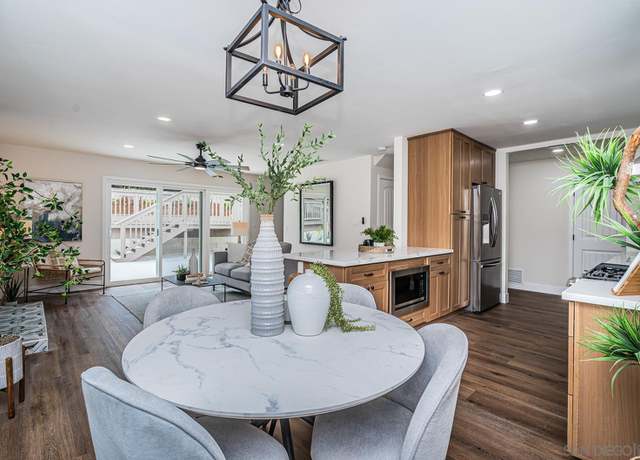
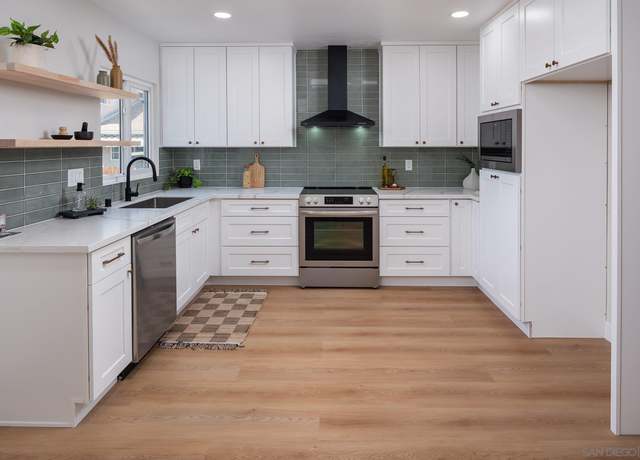
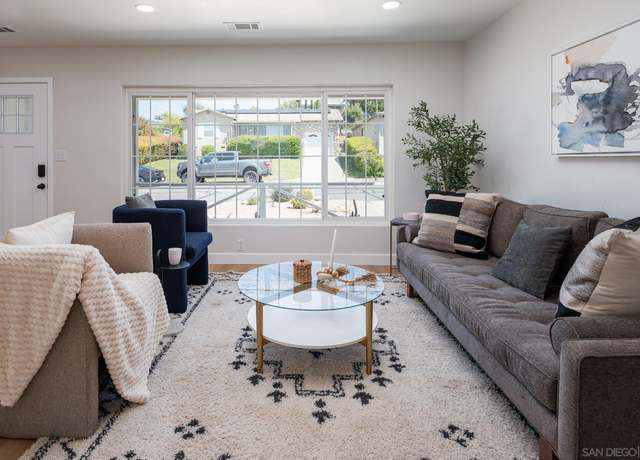
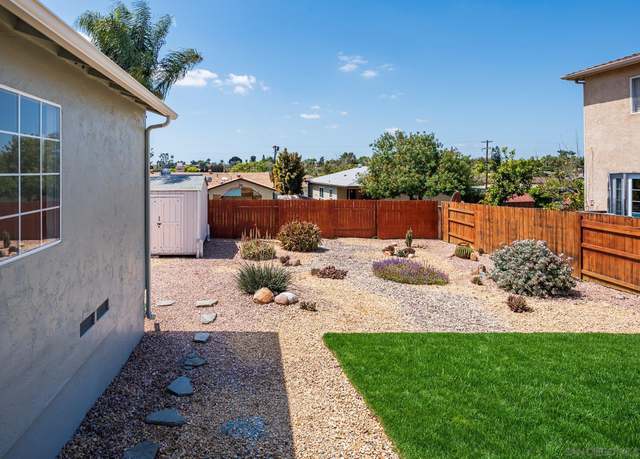
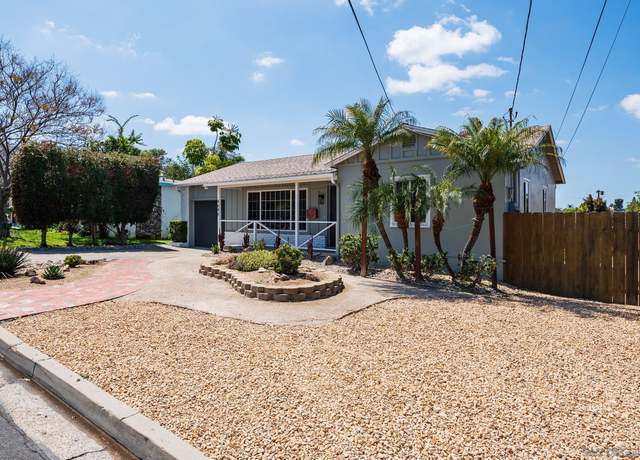
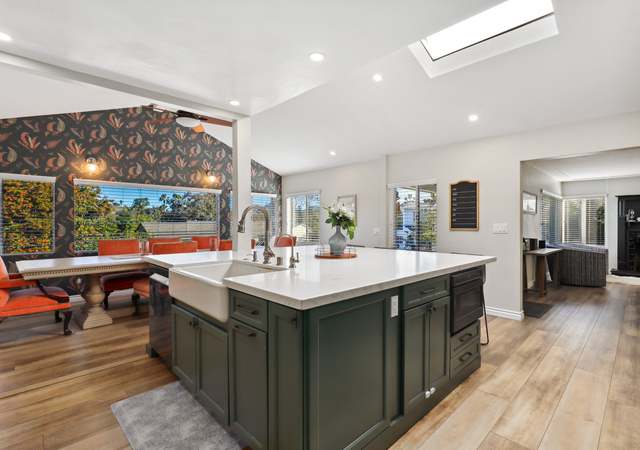
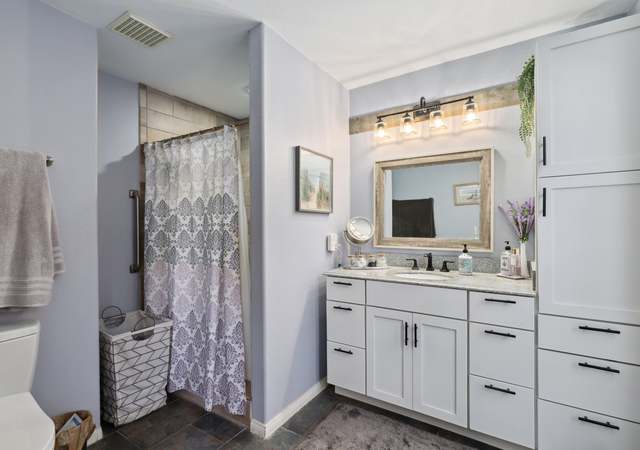
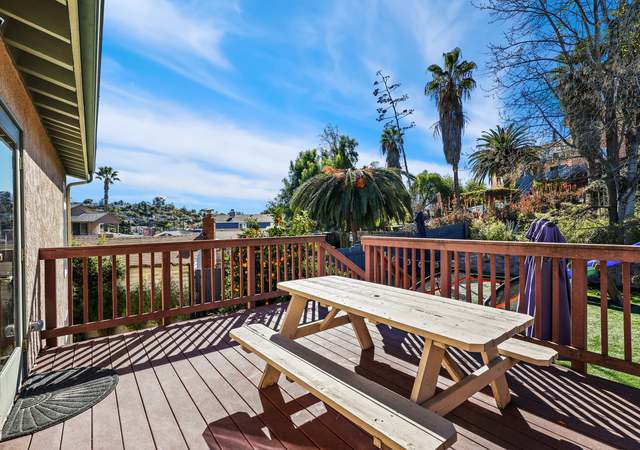
Welcome to this turn key 3 bed 1.5 bath in quiet cul-de-sac just minutes from Mount Helix Park & La Mesa Village! White exterior paint with black trim. Mid-century modern garage door featuring horizontal windows. Interior skylights. Open kitchen, living room, and dining room with French doors to back patio. Total kitchen renovation with new custom oak cabinets with gold hardware. Quartz countertops with gold leaf details. Subway tile backsplash with gold grout. All new stainless steel appliances. Office nook facing out front. New luxury white oak vinyl plank flooring throughout. All new windows and doors. New electrical system and solar. Envision tiered landscape block wall for privat
Welcome home to this lovely townhome with a view, close to La Mesa Village. It features an updated kitchen with quartz counters, vaulted ceilings, in-unit laundry, new carpet, storage, a spacious balcony, and a rear patio area! This pet-friendly gated community with a pool and lush trees is located within walking distance to shopping, coffee houses, brewery, and dining. BUYERS TO VERIFY AND APPROVE ALL MLS DATA, REPORTS, RECORDS, HOA DOCUMENTS, AND ALL INFORMATION PERTAINING TO THE PROPERTY PRIOR TO CLOSING OF ESCROW.
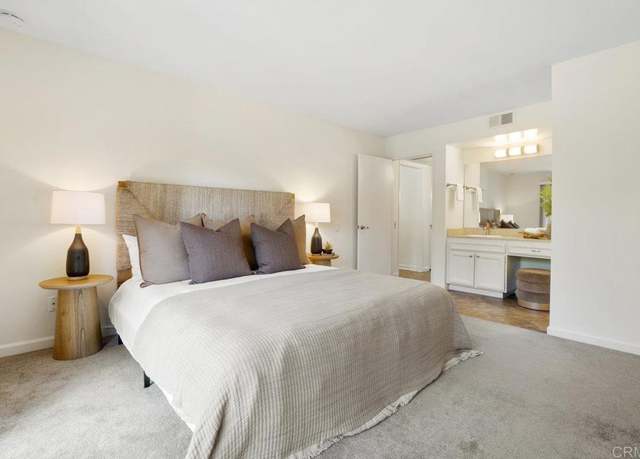
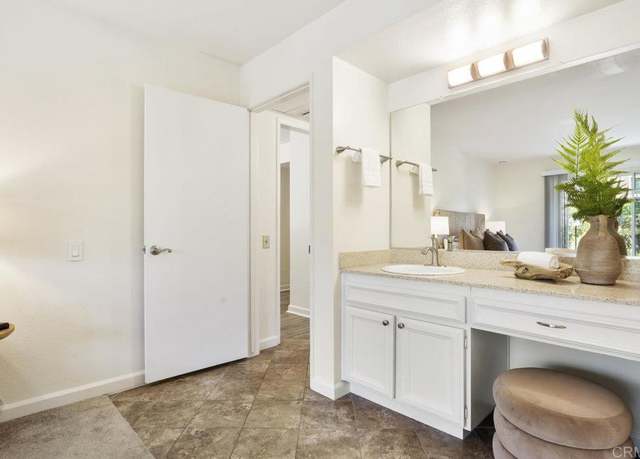
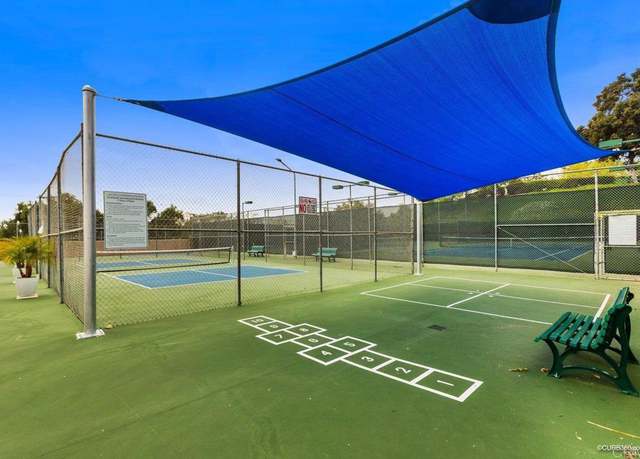
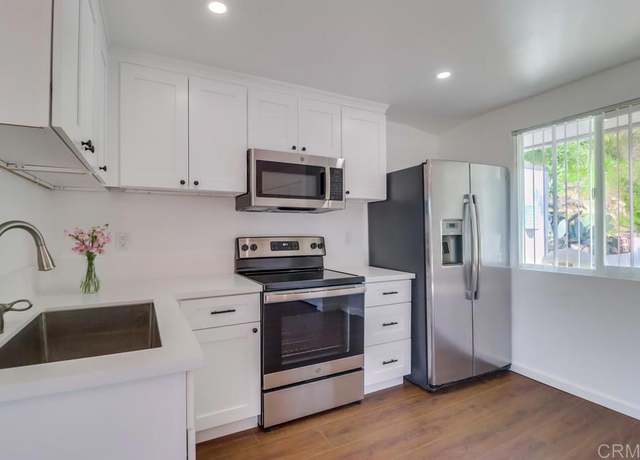
Welcome to Lake Park resort style complex which offers 5 pools, 4 spas, garden ponds with fountains, water features, recreation room with full kitchen, exercise rooms with showers & saunas, tennis courts with lights, pickle ball court, car wash bay at no addition fee to use. All of this is within walking distance from your unit. Private ground floor, end unit, 2bedrooms, 2 baths with fireplace, newer AC/heat pump & newer electrical box. Recently installed new stove/oven and vinyl plank flooring. Recently painted interior. Walk in closet in master bedroom. Single level inside unit with a few steps to front door. Sliding glass doors open up to patio by the pond. Relax listening to
Don't miss this incredible opportunity to own your very own enchanting retreat in The Foothills of Mount Helix!! The fully remodeled private detached ADU adds an extra layer of uniqueness to the property. Having a separate space like that can offer flexibility for guests, extended family, or even as potential rental income opportunity. The warm welcome as you enter the gate sets the tone for a cozy and inviting atmosphere. Enjoy a wonderful pool courtyard that's perfect for entertaining or simply enjoying quiet moments. Having both indoor and outdoor spaces for gathering with loved ones adds so much versatility. Fully owned solar is just one of the many benefits of this amazing property! Ha
VIEWS!! Panoramic Views of Lake Murray, Mountains and Mission Trails Park. This unit is newly remodeled and rarely available. The floor plan is perfect with a Bed and Bath on either side of the living room. Enjoy Lake views from Living room, bedrooms and deck. Primary bedroom has a walk-in closet. If you are looking for a beautiful interior with new cabinets, new quartz counters, new flooring, and fixtures come see this home. This is the total package with location, condition, price and VALUE!! Resort style community features 5 pools, 4 spas, gym, sauna, billiard table, ping pong table, club house with full kitchen, tennis court. pickle ball court and community laundry. There are beautiful
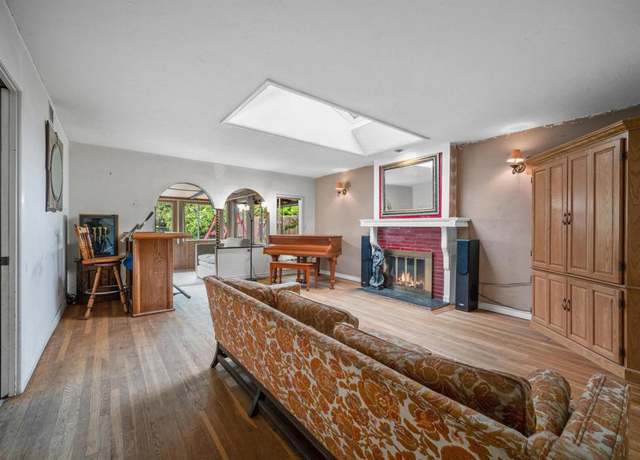
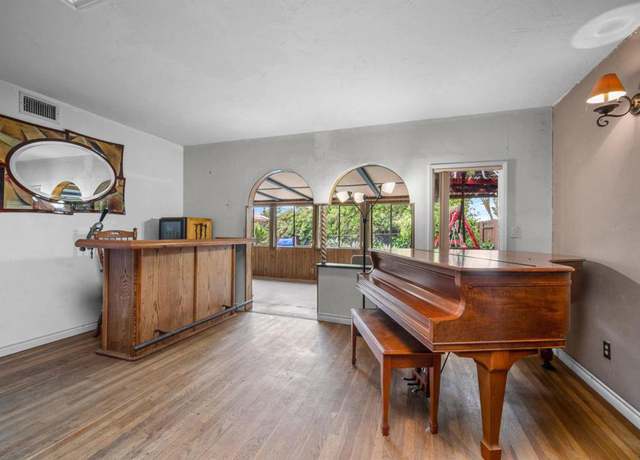
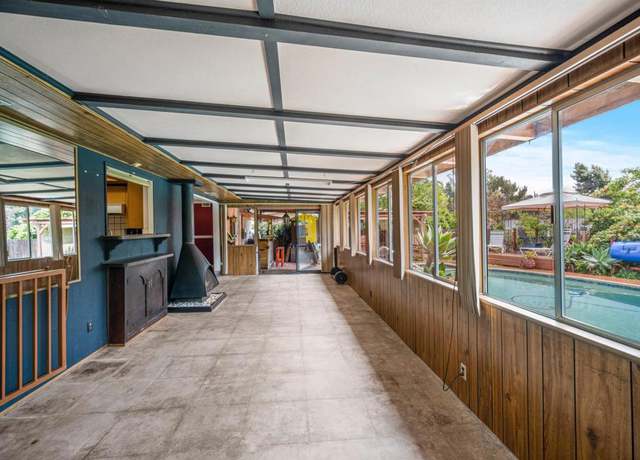
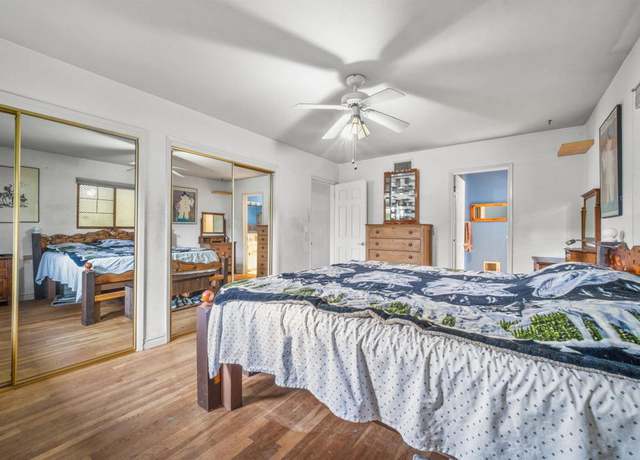
Looking like it was plucked from the Santa Barbara Coastline & gently placed on the bluffs of La Mesa Village, this exquisite, 1940s vintage home has all the features one seeks in Spanish Colonials: striking white stucco walls, red tile roof, gorgeous landscaping, private courtyard with sunken spa, red brick patios & meandering paths. Add fabulous La Mesa Village location, 2 master suites, workshop, crafts room, oversized deck, sweeping panoramic views of mountains, hills & eve lights & it's a WOW House!
Solid renovated Fletcher Hills multi-family ready home. The main home is a 3 bed 2 bath configuration with an open layout and an awesome primary suite. Refinished wood floors and modern updates, this trendy space is move-in ready! Downstairs is a secondary living space with a flex space that would be great for a gym, man cave, library, wine cellar, whiskey room, you name it! Through a transitional threshold there is an additional 2 bed 1 bath with separate kitchen and living space with exterior separate access if needed. The potential for this home is endless. With a circular drive, and plenty of parking, this awesome opportunity to own a great piece of real estate will
Radiating French Country charm, this single level home at Eastridge Foothills sits on beautiful greenbelt & is less than 1 mile from the shops & restaurants of Historic La Mesa Village. Expansive, covered back deck is perfect spot to enjoy sunsets & entertaining on large or intimate scale. Home underwent recent, major remodel with new 30-year roof, PAID solar, dual pane Milgard windows, new doors & flooring + sunshine-loving kitchen with new quartz countertops & cabinets. Lath & plaster, stone fireplace.
Encircled by lush vegetation, this single-story, Eastridge Foothills home is less than 1 mile from the shops & restaurants of Historic La Mesa Village & near award-winning schools & beautiful parks. High-end upgrades include 200 Amp electrical panel, new PAID solar (9.6 kW system) & 50-year roof, Milgard double pane windows & sliders, dimmable recessed lighting, high-efficiency HVAC, bamboo floors & insulated garage door. Lovely landscaping, patios & citrus trees. Not incl in sf is 377 sf bonus/playroom! Additional features include two fireplaces (kitchen & living room), 2 orange trees, 1 lemon tree, 1 avocado tree, 1 mandarin tree, 1 Jacarand
Welcome to this charming residence located in the heart of La Mesa. This lovely home features 4 bedrooms, 2 bathrooms and a great open floor plan with detached garage and a generous 8,500 Sq Ft LOT. Hot Tub in the yard to enjoy with friends and family! The spacious living room is perfect for entertaining guests or relaxing with family, while the stylish kitchen offers shaker style cabinets, quartz countertops, and stainless steel appliances. Adjacent to the kitchen is the dining area, perfect for enjoying meals with loved ones. Step outside to discover your own private oasis. The front and backyard is beautifully landscaped and offers a covered patio and Jacuzzi, providing ample space for
The home is freshly painted inside, new carpet is installed, and it's ready to go! The private back yard has an inviting patio deck, is fully fenced, and shaded by magnificent shade trees. The square footage reflects a family room addition with a wood burning fireplace to the original home. Solar is owned, and transfers. A full size two-car garage offers room for workbench or extra storage. You will love the location convenient to shopping and easy access to I-8.
Welcome to your dream home, your final destination for luxury and modern living. This fully remodeled gem boasts 4 bedrooms and 2 bathrooms, offering ample space for you and your loved ones to thrive. With over 2300 sqft of living area, every corner of this home is designed with your comfort in mind. Situated on a sprawling 3/4 of an acre, this property is not only a homeowner's paradise but also an investor's dream. The vast land offers the potential to build more homes, providing an excellent opportunity for cash flow and expansion. Step inside and be greeted by a tastefully designed interior that seamlessly blends contemporary aesthetics with timeless elegance. The open floor plan create
This one story home has plenty of room to grow. Spacious home on an extra large lot. Current home is set back from the street behind a well-tended garden. 17,000 sq foot lot offers development potential. Zoned R-2. Two bedrooms and one newly remodeled bathroom. Extra large family room with fireplace. Open beam ceilings throughout. Mini-split A/Cs in living room, dining area, and family room. New electric induction oven. Indoor/ outdoor workshop can be converted back into a third bedroom. Fully-fenced backyard. Check with the city of La Mesa about potential to add a second detached home, or apartments. Zoning may allow up to five units (buyers to verify).
Beautifully UPDATED 5-bedroom entertainer's dream home in Lake Murray! The spacious 2-story home features a large living room with stunning fireplace, dining room, and is adorned with new laminate and plush carpet throughout. The kitchen shines with 2-tone contemporary cabinets, designer quartz counters and new state of the art stainless steel appliance package. Upstairs features a large family room and the primary retreat. Attached to a huge primary suite, the primary bath is spa-like complete with a soaking tub, oversized shower and custom double vanity. Adjacent to the primary bed is luxuriously large walk-in closet that can be 5th bedroom/nursery/office. One of the large downstairs bedr
Tremendous location for this centrally located spacious 2 bedroom 2 full bath condo. LVP (luxury vinyl plank) flooring throughout keeps unit meticulous and and easy to clean. Resembles east/west duel master suites with a spacious floor plan in between. Open kitchen and dining is perfect for entertaining. View off living room deck overlooks park/barbeque area and swimming pool. Complex is dog friendly with park setting and 2 designated dog areas. unit is move in ready and available without delay. Tremendous location for this centrally located spacious 2 bedroom 2 full bath condo. LVP (luxury vinyl plank) flooring throughout keeps unit meticulous and and easy to clean. Resembles east/west due
Very well maintained top floor unit with no neighbors on top in the Mesa Greens complex in the Rolando neighborhood. This 1 bedroom / 1 bath corner unit features a private front patio/sitting area. Renovations done since the last sale include new cabinets in the kitchen w/ granite counter tops, tiles in the kitchen, vinyl in the living room and bedroom, double panel windows. Open lay-out, bright and bedroom is spacious. One parking space. Low HOA fee. This centrally located complex is right across Joan Kroc Center with plenty of activities for all ages. Also, close to SDSU, YMCA & short drive to downtown.
Welcome to your new home at 6113 Nancy Drive in La Mesa! This meticulously renovated property features a multitude of upgrades, ensuring modern comfort and style. Step inside to discover fresh new paint and plush carpeting throughout, creating a welcoming atmosphere. The roof and sewer line have been recently replaced, offering peace of mind for years to come. The kitchen has been completely remodeled, featuring sleek laminate flooring and modern appliances. Stay cool and comfortable year-round with the addition of a split air system. Both bathrooms have been updated with contemporary finishes, adding a touch of luxury to your daily routine. No detail has been overlooked, with updates to th
Welcome to this captivating home nestled in the highly sought-after Serramar Community of La Mesa. 3845 Sacramento Dr presents an unparalleled opportunity for modern living. This Serramar Plan 6 property is one of a kind offering the primary suite on the main entry level. A haven of style and comfort, boasting an open floor plan and a contemporary aesthetic throughout. With spacious living areas, luxurious bedrooms and bathrooms, oversized loft, laundry room, bonus room/office, and a serene outdoor space offering a private pool and spa, and a bonus side yard. Every corner of this residence exudes sophistication and charm. Solar. Tesla Charger. Whole House Alkalinity System. Plantation Shutt
Wedgewood Homes has done it again- this time in La Mesa! This charming home offers an terrific layout, thoughtfully designed for modern living. As you step inside, you're greeted by an open floor plan that effortlessly combines comfort and functionality. The highlight of this home is undoubtedly the spacious primary suite, situated on one side for ultimate privacy and tranquility. On the opposite side, you'll find the secondary bedrooms, providing ample space for family members or guests. Prepare to be impressed by the recent updates, including a brand-new kitchen and bathrooms adorned with designer finishes. The addition of new vinyl plank flooring throughout enhances both aesthetics and d
Welcome home to this beautiful 5 Bed, 3 bath, single family home, located 2.2 miles from the La Mesa village and just a stone’s throw away from Lake Murray, Lake Murray is a popular site for hikers, bicyclists, runners, kayakers and fishers. 6179 Baltimore Dr boasts 5 generous size bedrooms and a large den/playroom or office, with an abundance of natural light flooding in from the west facing oversized windows, the seamlessly flowing floor plan offers 1 bedroom and 1 full guest bathroom on the ground floor, making this the perfect home for any family or friends coming to stay. This 2101 sqft home has a living room, dining room kitchen, family room and laundry room on the first floor,
GREAT STARTER HOME! New Roof. Central AC and Heating. Hardwood flooring. Close to a Elementary, Middle and High School. This home is within minutes from SDSU. This home is a corner lot with the potential of an ADU.
Unique, Beach Cottage Style, Entertainers Home, with Pool, in the heart of La Mesa. Walking distance to La Mesa Village, churches, schools, shopping, dog park, & so much more! Home has not been on the market in 23+ years! Roomy wood front porch area off kitchen with medicine ball lighting and thriving garden boxes. Large, refreshing, private, in-ground pool and fire ring area surrounded by mature blooming landscaping in bi-level backyard. Quaint and cozy floorplan with one bedroom and family room area upstairs. .. .. fireplace in living room, kitchen with upgraded counters, luxury vinyl plank flooring, and two person eat in kitchen nook. Don't miss out on this La Mesa Dream Home!
A gem in the hills! This single-story home exudes old Hollywood charm, showcasing stunning views and refreshing breezes. Upon entering you'll be greeted by a captivating stone wall/fireplace and panoramic hills through the living room's picture window. Embrace California living with a seamless indoor/outdoor flow from the kitchen and dining area onto the oversized covered patio and sparkling salt water pool. The primary retreat offers a cozy fireplaces, French doors leading to pool and a spa-like bathroom for the ultimate retreat. Spend evenings entertaining and eating Al fresco with the backdrop of spectacular mountain views. Step down the stone stairs to the lower citrus grove, perfect fo
Great family home in a well desired neighborhood of La Mesa. Home is ready for you to make it your own just in time to enjoy the summer in the pool and watch the view from your backyard while creating family memories. Hardwood floors throughout the house, natural light from the living room skylight. First time on the market in 20 years.
Completely renovated tri-level home with attached ADU located near Cowles Mountain. Upgrades feature waterproof laminate throughout, updated kitchen and bathrooms, newer windows, new interior and exterior paint, tankless water heater, etc. This is one of the larger homes in the area. Within walking distance to Cowles Mountain for daily hiking and outdoor acivities at Mission Trails Regional Park, fishing at Lake Murray and nearby golfing. Close to schools, shopping, freeways and other transportation. BTVABCOE
Welcome to your beautiful new Mid-Century oasis in the heart of San Diego! Meticulously redesigned home on large lot complete with pool, jacuzzi, abundant parking and tiered backyard perfect for families, entertaining and privacy. Well appointed bathrooms, kitchen and flooring create a welcoming atmosphere of classic California living, including a permitted new primary bedroom adding 300sf as well as a dining room that leads out to a beautiful pool/patio area for indoor/outdoor living. A large driveway and 3 car garage, including a gym area is ensconced by towering landscaping providing privacy and noise abatement from Avocado Blvd as well as providing plenty of parking. Updates include sma
Location, Location, Location! Beautiful Fully Renovated House located in the area that you've been looking for, only blocks away from Downtown La Mesa and one block away from the great Collier Park. Very quick and easy access to freeways: 8, 94 and 125. Discover the charm of the thoughtfully designed spaces of this 4 bedroom and 4 full bathroom modern single story Home, with a Beautiful New Kitchen (New everything: New appliances, new cabinets and new Quartz countertop). Also 4 New bathrooms, New flooring, Fixtures, Tankless Water Heater and 3 brand new ductless HVAC. A very convenient and spacious laundry room. Enjoy the natural light flooding from large windows. The comfort of each bedroo
HOT LOCATION! Situated in excellent Fletcher Hills neighborhood on quiet street with beautiful views! This home is IDEAL for multi family living. Large spacious open floor plan, beautiful rock fireplace in Family room upstairs and fireplace downstairs as well! All bedrooms are spacious. There is a large covered porch off kitchen often used as "California outdoor living space" taking advantage of beautiful views and sunsets! Downstairs has entirely it's own living space, bedroom, family room and fireplace as well as a lot more additional square footage ideal to convert to more living space to accommodate separate living for multi-family or rental situation. The backyard is spaciou
LOCATION, LOCATION, LOCATION. .. .This lovely condo is walking distant to the charming Iconic village of downtown La Mesa. You can walk to the Village and find restaurants, banking, Clothing stores and numerous other shops. This END UNIT has been fully upgraded, All new flooring throughout, new kitchen cabinets, countertops, all new LG appliances. Bath also total upgraded, shower enclosure, shower doors, cabinets, countertops, flooring. Living room has a huge window with tons of natural light and a view. Bedroom all new flooring with a sliding door to the deck outside. The community boasts a Grand Foyer, a Library/Sitting room, shaded Patio area, Elevator, , Rooftop deck for relaxing or en
Located in a quiet area of the park. Top, end unit, view over community pools, newly innovated kitchen counter tops, LVP flooring, brand new bathroom, with fireplace, large walk in closets in both Bedrooms. Complex is loaded with amenities including 5 pools, spas, saunas, tennis courts, basketball courts, community room, billiards, 2 gyms, pet friendly (on approval), large ponds. Next to Lake Murray Recreational Park. Shopping nearby, Freeway & trolley close! FHA and VA APPROVED!
Listed at $750,000-$790,000 is this 3 bed, 2 1/2 bath home in Strawberry Hills! The master bedroom is oversized with an en suite bath. Prior owners removed the wall between bedrooms 2 and 3 making for a large second master, workout room, office or it can be converted back to two separate bedrooms. The home features gorgeous Brazilian Cherry Wood flooring upstairs and tile/carpet downstairs. Crown molding, recessed LED lighting, plantation shutters and wood blinds throughout. At the top of the stairs, there’s a nook great for reading time and a cup of coffee! And you’ll love the natural light from the four skylights and the dramatic vaulted ceilings in the living room. Serve dinn
NEW HOME CONSTRUCTION – Homesite #3 - Plan 1755 (1755 sq. ft. ) • Brand New 4 bedrooms with 3.5 bathrooms Townhome condo in up-and-coming Lemon Grove! • Close to freeways and shopping in La Mesa and Spring Valley! • 15 minutes or less to Downtown. • Fully Customizable. • Included Solar. • Low HOA. • No Mello Roos. • Downstairs bedroom with full bath • Walkout deck • Spacious kitchen • Dual-sink vanity at primary bath • White thermofoil cabinets • WaterSense® labeled home • Low-E windows • ENERGY STAR certified home • Delivery within 30 days!
Beautifully appointed 4-bedroom, 3.5-bathroom townhome, built in 2023! This home boasts a spacious and inviting floor plan with abundant natural light streaming through dual pane windows. The kitchen features stylish designer cabinetry with soft close drawers, complemented by granite countertops. Enjoy the elegance of ceramic and wood tile flooring, enhanced by recessed lighting throughout. An attached 2-car garage with epoxy flooring and Owned Solar ensure both comfort and sustainability. Desirable amenities include a downstairs bedroom with a full bath, perfect for guests or multi-generational living. Step out onto the private covered deck to unwind, or entertain in the generous living an
Welcome to your dream home where Rancho San Diego meets sunny La Mesa, CA! This beautiful two-story house has been lovingly updated to give you the best of modern living. Step inside and admire the chic new tile floors that welcome you into a spacious and bright main area. The heart of this home is its stunning kitchen, now boasting stainless steele appliances and gorgeous countertops, perfect for cooking up meals and making memories with friends and family. But that’s not all! Head out back to discover a cozy backyard, complete with a jacuzzi and waterfall feature. It’s the ultimate spot to relax or throw gatherings with friends and family. And don’t forget to notice the
Your private paradise awaits in a quiet cul-de-sac! Walk to downtown La Mesa which offers fantastic shopping, restaurants parks and night life. This home also features a great bonus room next to the garage which can be used for an additional bedroom, classroom or play room. Enjoy fantastic views from your spacious back yard with lush mature landscaping and a wonderful separate structure perfect for an office, she shed, craft room, or workshop. Easy access to the 125 and 94 freeways.
This little duplex is nestled not far from the center of La Mesa's culture, shopping, food, and schools. Enjoy the weather and lifestyle of San Diego combined with the small town feel of La Mesa just outside the hustle bustle of the city. This cozy home has a lot of charm from the detail in the windows to the fresh, crisp white and grey color scheme. Central location is walking distance to local eateries ! Easy freeway access close to Military Bases, Restaurants, Public Transportation, Schools, and More.
Newly upgraded second floor, spacious 2Bedroom 2 Full Bathroom Condo in the Heart of La Mesa. New waterproof flooring. New kitchen cabinets and granite countertop. New remodeled bathrooms, fresh paint. Close to shopping, restaurants and freeways. Complex has onsite laundry facilities and pool, across the street from top-rated Helix High School. Community Washer & dryer with option to install washer & dryer inside the home with HOA approval. Tenant occupied. Great for investment or first-time buyer.
Newly-built attached ADU offering opportunities for producing income or additional space for multi-generational living situations, this versatile home is located in a tranquil La Mesa neighborhood. An owned solar system keeps energy costs low. The seller has lovingly added 300-400k in improvements inside out, top to bottom of this gorgeous property. Enter to gaze upon a spacious living room surrounded by windows that bathe the space in natural light and warmed by a stunning fireplace. The kitchen has been reimagined with a gourmet island, Viking stove, gorgeous painted cabinetry, recessed lighting, spacious pantry with barn door entry and so many windows inviting the outdoors into your indo
This area's enrollment policy is not based solely on geography. Please check the school district website for more information.
Elementary schools
Middle schools
High schools
GreatSchools Summary Rating
8/10
La Mesa Arts Academy
Public, 4-8
8/10
Benchley/weinberger Elementary School
Public, K-5
7/10
Murray Manor Elementary School
Public, K-6
6/10
Lemon Avenue Elementary School
Public, K-6
6/10
Maryland Avenue Elementary School
Public, K-6
Only showing 5 of
13 elementary schools.
School data is provided by GreatSchools, a nonprofit organization. Redfin recommends buyers and renters use GreatSchools information and ratings as a first step, and conduct their own investigation to determine their desired schools or school districts, including by contacting and visiting the schools themselves.Redfin does not endorse or guarantee this information. School service boundaries are intended to be used as a reference only; they may change and are not guaranteed to be accurate. To verify school enrollment eligibility, contact the school district directly.
Homes for sale in La Mesa have a median listing price of $849K. Some of these homes are Hot Homes, meaning they're likely to sell quickly.
What are some of the most popular neighborhoods in La Mesa?
Popular neighborhoods include Mid-City, San Carlos, Lake Murray, College East, Fletcher Hills, Mount Helix, College Area, Grossmont, Eastern San Diego, and Rolando.
La Mesa, California offers a variety of transportation options, including a well-structured public transportation system. The city is served by the Metropolitan Transit System (MTS), providing residents with bus and trolley services. For those who prefer to drive, traffic levels can be high during peak hours, especially on the nearby Interstate 8 and State Route 94. These highways and freeways provide convenient access to the broader San Diego area, making La Mesa a great location for car commuters. Learn more on our La Mesa city guide.
What types of properties are available in La Mesa?
La Mesa, California offers a range of single-family home options, including ranch-style homes, contemporary homes, and modern homes with various architectural styles, all built between the 1950s and present day. These homes typically feature two to five bedrooms, providing ample space for residents. To explore different property types for sale in La Mesa, California, use the 'Home type' filter located above the active listings. Customize your search by selecting options like single-family homes, condos, townhomes, and more.
What is life like in La Mesa?
La Mesa, California offers a pleasant living experience with its beautiful natural surroundings. The landscape is characterized by picturesque hills and scenic vistas. The weather in La Mesa is typically mild and enjoyable, with warm summers and mild winters. The city provides various job opportunities across different industries, ensuring diverse employment options. Residents can engage in a wide range of activities, including exploring local parks, participating in recreational sports, and enjoying the vibrant arts and cultural scene.
What are the schools and amenities like in La Mesa?
La Mesa, California offers an array of public amenities to its residents. The city boasts a variety of restaurants, catering to every palate, from casual eateries to fine dining establishments. Numerous parks provide ample space for relaxation, recreation, and outdoor enjoyment. For your daily needs, there are several grocery stores conveniently located throughout the city. Additionally, La Mesa offers a range of other amenities including libraries, fitness centers, and shopping centers, all contributing to a comfortable and convenient lifestyle.
In the past month, 37 homes have been sold in La Mesa. In addition to houses in La Mesa, there were also 22 condos, 10 townhouses, and 4 multi-family units for sale in La Mesa last month. La Mesa is a moderately walkable city in San Diego County with a Walk Score of 60. La Mesa is home to approximately 56,778 people and 25,243 jobs. Find your dream home in La Mesa using the tools above. Use filters to narrow your search by price, square feet, beds, and baths to find homes that fit your criteria. Our top-rated real estate agents in La Mesa are local experts and are ready to answer your questions about properties, neighborhoods, schools, and the newest listings for sale in La Mesa. Our La Mesa real estate stats and trends will give you more information about home buying and selling trends in La Mesa. If you're looking to sell your home in the La Mesa area, our listing agents can help you get the best price. Redfin is redefining real estate and the home buying process in La Mesa with industry-leading technology, full-service agents, and lower fees that provide a better value for Redfin buyers and sellers.


 REDFIN IS COMMITTED TO AND ABIDES BY THE FAIR HOUSING ACT AND EQUAL OPPORTUNITY ACT. READ REDFIN'S FAIR HOUSING POLICY AND THE NEW YORK STATE FAIR HOUSING NOTICE.
 United States
 Canada