Welcome to your charming oasis! This delightful 4-bedroom home welcomes you with its distinctive arched front entry door, setting the stage for the character and warmth that awaits within. Step inside to discover a sunroom or office on the main level, providing a versatile space that can easily adapt to your lifestyle needs. The spacious dining room beckons for gatherings and special occasions, offering the perfect backdrop for memorable meals shared with loved ones. Prepare to be enchanted by the cozy kitchen, adorned with warm wood cabinetry, a gas stove, and a walkout to a bi-level deck, where outdoor entertaining becomes a breeze. A full bath on the main level adds convenience and funct
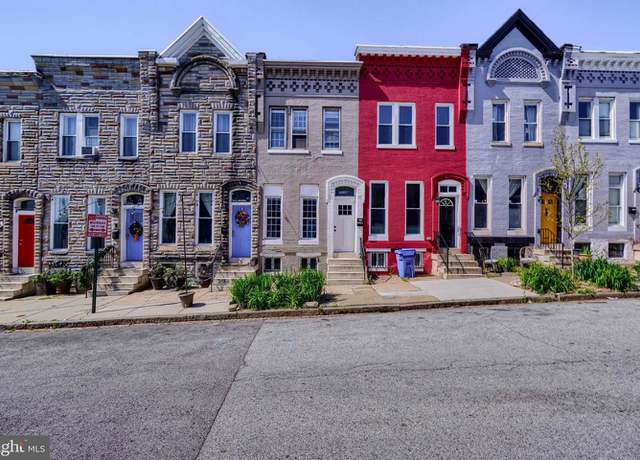
Coming soon! Welcome to 1134 Myrtle Ave, a charming 3-bedroom, 2-full bathroom home nestled in the heart of Baltimore. This tastefully appointed residence offers both comfort and convenience in equal measure. Don't miss your chance to make this wonderful property your own. Schedule a showing today and experience the beauty and comfort of 1134 Myrtle Ave for yourself!
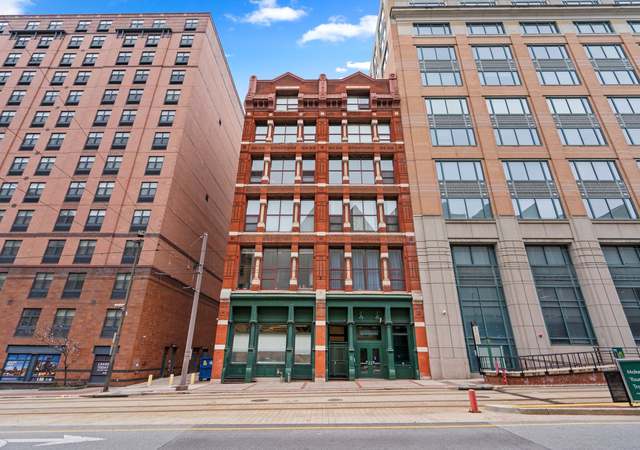
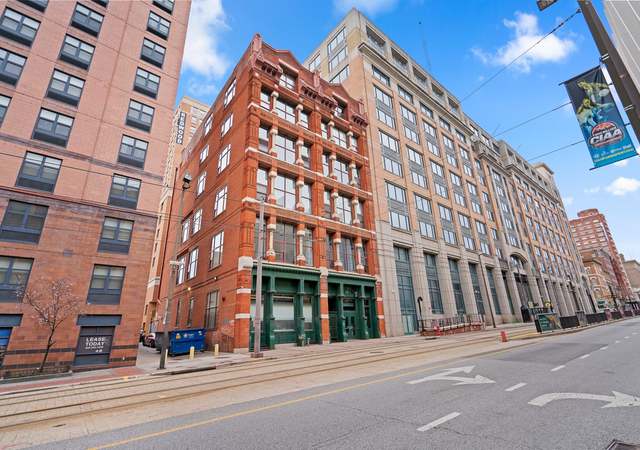
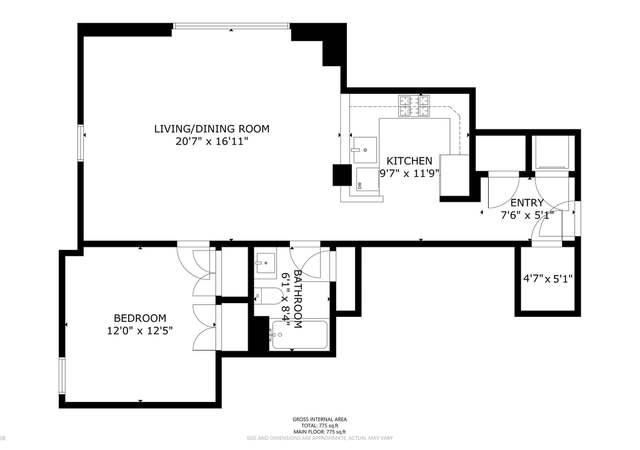
Welcome to urban living at its finest in this stunning 1 bedroom condo nestled in the sought-after Rombro Lofts building in Downtown Inner Harbor. Your inner chef will love the open kitchen with a brand-new gas range, sleek granite countertops, and a convenient breakfast bar. Be greeted by soaring 14' ceilings throughout the entire space. Custom floor-to-ceiling draperies frame expansive windows allowing ample natural light, and offering a breathtaking close-up view of the iconic Bromo Seltzer tower. Practicality meets style with the neutral paint throughout, and this unit meets everyday needs with a washer and dryer right in the unit, and rare abundant storage. Enjoy the convenience of urb
Beautiful Fells Point- 4 story with 2 car garage and roof deck- Fantastic views of the city!! 3 bedroom - 2.5 bath-Freshly repainted throughout. Open floor plan- Granite tops- stainless appliances-washer/dryer- dual zoned HVAC- AC /heat- Cooking range/hood- sparkling wood floors- HOA- Open House- Saturday- April 27th 2:30- 4 pm.
Location! It sounds like you've found an amazing home that has undergone a full renovation. Its convenient location near Johns Hopkins Hospital and Patterson Park is definitely a plus, providing easy access to amenities and attractions. As you step inside, you'll be greeted by a cozy living room that sets a welcoming tone. The spacious kitchen with its quartz countertop and stainless-steel appliances, is not only stylish but also functional, making it perfect for hosting dinner gatherings and preparing meals. The open floor plan adds a touch of luxury and comfort creating a seamless flow between the different areas of the home. The wood-looking luxury vinyl flooring on the main and upper le
Open House Sat 4/27, 12-2pm. Stunning 4BR/3.5BA Expanded Row Home in Highlandtown! Welcome to this meticulously renovated gem located in the highly sought-after Highlandtown neighborhood. This 4-bedroom, 3.5-bathroom home has been fully updated from top to bottom, offering a perfect blend of modern elegance and historic charm. Main Level Highlights: Step inside to discover a welcoming open floor plan that seamlessly connects the living spaces. The cozy family room is the perfect spot to relax and unwind, complete with an elegant fireplace that adds warmth and character. The heart of the home is undoubtedly the stunning kitchen, featuring a large quartz center island, sleek cabinetry, and to
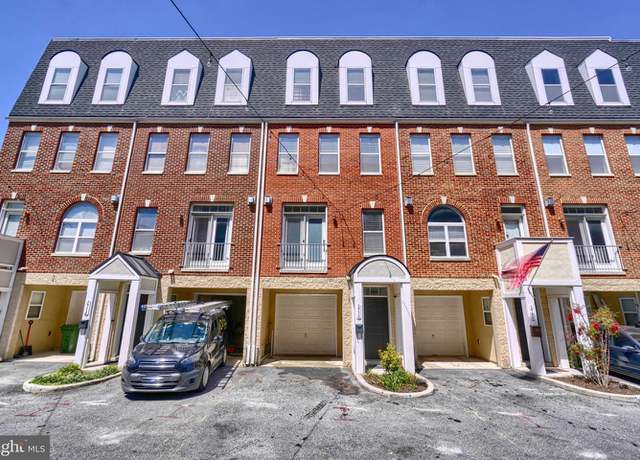
701 S Robinson St, Baltimore, MD 21224 🏡 A Stunning Mix of Classic & Contemporary Design: Welcome to this beautiful 3-bedroom, 2.5 bath townhome that seamlessly blends timeless charm with modern elegance. As you step inside, you’ll be greeted by an abundance of natural light, open living concept, and exquisite exposed brick. The hardwood floors throughout add warmth and character to this exceptional space. 🌟 Key Features: • Generous Living Area: The spacious layout provides room for both relaxation and entertainment. • Kitchen with Style: Granite countertops, stainless steel appliances, and crisp white cabinets create a culinary haven. • Upper Level Retreat: Two
This HUGE, MOVE IN READY, 2034 sq ft Ridgley's Delight row home offers 4 bedrooms, 2 full baths, Fenced yard, Driveway Parking for 1 car and much more! This is the home your clients have been looking for! Two parcels of land for the price of one! EXTRA LOT INCLUDED with the purchase of this home. It’s located at 631 Eislen St. behind the house. Home has Central AC, High ceilings throughout, living and dining room, Kitchen with lots of cabinets and granite counter tops, breakfast room with alcove for washer, dryer, and ceiling fans. Primary bedroom has an attached full bathroom. A Charming bedroom with vaulted ceiling and exposed beams. Unfinished basement with walk out, great for s
Welcome to your stylish new slice of the city! This Riverside/Federal Hill gem offers an immaculate VIEW of the harbor just in time for Fourth of July fireworks! Another rare bonus—A PRIVATE GARAGE with alley access. Nestled on one of South Baltimore’s best serpentine streets, you’ll find everything you need and then some at 639 Harvey St. Baltimore’s signature exposed brick carries you through the residence on both floors. Inside, you’ll find custom built-ins for the perfect backdrop to your zoom meetings or dinner parties. Updated appliances and sink can be found in your new spacious kitchen along with modern pendant lighting and the perfect-sized island (inc
Welcome to 701 Newington Ave, a charming storybook-style residence nestled in the premier Reservoir Hill neighborhood of Baltimore. This enchanting home offers a unique blend of historic charm and modern comfort, with a sunroom, a deck off the master bedroom, and access to a potential rooftop deck. Step inside to discover a warm and inviting interior featuring gleaming hardwood floors and an abundance of natural light that floods the space. The main level boasts a spacious living area, perfect for gatherings, and a kitchen equipped with a vent hood and ample cabinet space. Upstairs, you'll find serene bedrooms, including a primary suite with an ensuite bath. Plus, with access to the roof, t
Professional pictures coming soon. Welcome to Coldspring/Newtown Community where each unit offers its own special footprint and appeal. You will be pleasantly impressed as the new owner of 2355 Nutmeg Ct. that features a lower level covered parking w/ tandem parking for 2. Roof, Exterior, Water and Garbage are maintained by Coldspring Condominium. We are a neighborhood in Baltimore with a rich history. Among the most striking features of the this Coldspring Community built in the 80's is known for it's "deck house" design which showcases the architectural styling of Moshe Safdie. This spacious three-bedroom, two-full and one-half-bath deck house boasts a main level entry
The seller will give a buyer 10K towards the down payment or closing costs at settlement with a full priced offer. The home also offers a CHAP historic tax credit and is eligible for another 10K grant from V2V (Vacants to value program) if funds are available. All of this can be stacked together giving you, the buyer, great opportunity! Please reach out to listing agent with questions. Welcome to your dream Baltimore home! This fully renovated 2-bedroom, 2-bath gem of tastefully designed living space is ready for you to move in. Completely remodeled from top to bottom to include new water and sewer lines, all framing, walls etc. The historic brick exterior gives you the charm and everything
Nestled on a serene quiet street, this charming 2-bedroom, 1-bathroom home offers a tranquil retreat in a peaceful neighborhood setting. Upon entering, you're welcomed by inviting accent walls adorned with a cozy fireplace, creating a warm and inviting atmosphere perfect for relaxation or gatherings with loved ones. The second bedroom boasts versatility, providing the flexibility to serve as an office, nursery, or den to suit your individual preferences and needs. Convenience is paramount with a main level laundry room featuring brand-new washer and dryer units, making household chores a breeze. Step outside to discover a private outdoor patio, complete with power supply, offering an ideal
Welcome to your dream home at 137 E West Street in the vibrant neighborhood of Federal Hill! This charming residence offers the perfect blend of historic character and modern amenities, making it a haven for comfortable living and entertaining. Upon entering, you're greeted by a spacious living room and dining room combination, providing ample space for gatherings and meals. The kitchen, updated in 2020, boasts a unique tin ceiling, large eat in island & heated floors, adding a touch of luxury to your culinary experience. Exposed brick walls throughout the home enhance its charm, while beautiful original hardwood floors add character. An abundance of closets throughout the home make s
Welcome to 241 S Washington Street! This Upper Fells Point home will not disappoint. It has lots of historic charm with modern amenities. As you enter the home through the 6 panel front door into the living area you'll notice the built-in bookcases, decorative fireplaces and heart pine floors. The gourmet kitchen is impressive with it's KitchenAid 6 burner range and cherry cabinets. The dining area has French doors leading to a fenced landscaped yard with a bluestone patio. Lots of room for grilling out and entertaining. The second floor has 2 bedrooms with a full bath and laundry. The bedrooms has feature original hardwood floors decorative fireplace and solid hardwood doors with vintage
* * GARAGE AND OFF-STREET PARKING * * IMMACULATELY MAINTAINED 4 BEDROOM 3.5 BATH TOWNHOUSE WITH 2-CAR PARKING (GARAGE AND PARKING PAD) IN THE FEDERAL HILL HISTORIC DISTRICT. QUIET STREET LOCATION IN HIGHLY-DESIRED MONTGOMERY SQUARE COMMUNITY. OPEN FLOOR PLAN WITH OAK HARDWOOD FLOORING THROUGHOUT. ENTRY LEVEL FOYER FEATURES A BEDROOM/DEN WITH LAUNDRY CENTER, FULL BATH AND GARAGE ACCESS. THE MAIN LEVEL FEATURES THE LARGE LIVING ROOM WITH WOOD-BURNING FIREPLACE AND DECK, GOURMET KITCHEN WITH GRANITE COUNTERS, SOLID WOOD CABINETRY, GAS COOKING, DINING AREA AND HALF BATH. THE UPPER LEVEL FEATURES VAULTED CEILINGS, THE PRIMARY BEDROOM AND ENSUITE BATH WITH GRANITE VANITY AND HEATED TILE FLOORI
Beautiful, exquisitely finished 3 bedroom, 3.5 bath home with 3 decks (including a rooftop deck) with amazing views of Baltimore. This home, with its prime location in the bustling neighborhood of Canton, is convenient to Canton Square, restaurants, shopping and has a playground across the street that allows for plenty of parking. The main level and upper level have exposed brick and gorgeous hardwood floors. You will love the upgraded gourmet eat-in kitchen that has beautiful wood cabinets, granite counters, a peninsula with seating, plenty of space for a kitchen table and access to the first of the 3 decks. The main level also has a walk in pantry, powder room, family room and an open st
This block is on the rise. With 3 recent renovation on the same block this home offers amazing upside. Come see this 3 bed 1 bath townhouse minutes away from downtown Baltimore. This home has 61 years of memories made and has been meticulously maintained. Everything is working and in great conditions. It’s evident the owners took great care of this home. Upstairs, you will find 3 bedrooms with added closets. The partially finished basement includes space for a recreation room or 4th bedroom and a laundry area. The fenced in back yard provides great space for a small garden or space to play.
Investor alert!! The heavy lifting is already done - permit inspections completed for all 3 trade rough ins and framing inspection. From here, you can easily finish the interior and be done, with a low total investment. Sold as-is, permit information is available on permit website and rough-in stickers can be provided.
Room for everyone in this large colonial that is set up for in-laws with a second kitchen or easily converted back to single family. Above ground pool for those hot summer days on the way. Huge L shaped yard for the children or maybe a garden. Professional pictures coming soon.
Great location in Remington area with path to Wyman Park directly across from the home. Two bedrooms on 2nd floor with charming loft, plus spacious bathroom and dressing area. First floor laundry off the kitchen and next to the second full bathroom. Plenty of storage space in the cellar. New gas furnace in 2022 and roof resealed in 2024. Home has Central Air. 1 year Home Warranty covers HVAC, plumbing, electrical, and all appliances. Excellent opportunity!
Welcome home to Oldham Crossing! 2 bedrooms, 2.5 bathrooms & beautifully maintained. The main entry may be used as a TV room, workout space, or office, complete with a half bath. The spacious main level is perfect for entertaining--check out the kitchen bar with granite counters, the stunning backsplash, and the wine fridge! You'll love the large deck with retractable awnings, just in time for summer. Upstairs, you'll find the primary bedroom with his and hers closets and the primary bathroom with dual vanity sinks. Through the hall, you'll also find the stacked washer & dryer and the second bedroom and full bathroom. Don't forget the garage, perfect for extra storage or the ge
Welcome to 2109 Ridgehill Ave, Baltimore, MD 21217! Step into this bright and inviting home where natural light floods the main level, accentuating the brand new LVP flooring and recessed lighting. The seamless flow from the living room to the gourmet kitchen makes entertaining a breeze. The kitchen boasts stainless steel appliances, granite countertops, and more recessed lighting, creating a modern and functional space for culinary endeavors. Upstairs, discover two generously sized bedrooms and two full modern bathrooms, offering comfort and convenience. Outside, the backyard showcases all-new concrete and a freshly installed fence, providing privacy and a perfect space for outdoor relaxat
Embark on your next chapter in the vibrant heart of Baltimore's Hampden neighborhood! Nestled behind a charming porch front, this delightful residence exudes character and warmth, featuring a wealth of distinctive features including arched doorways with built-in shelving, crown molding, gleaming hardwood floors, and striking exposed brick walls accented by a beautiful stained glass transom. Step inside to discover a captivating blend of historic charm and modern comfort. The inviting living and formal dining areas welcome you with rich wood floors and captivating exposed brick walls, creating an atmosphere of timeless elegance. The spacious kitchen features granite counters, stainless steel
Check out this beautifully updated Duplex ! Lots of Seller updates, bright and airy rooms, huge yard, spacious bedrooms, new lvp flooring and carpet! 3 generous bedrooms and 2 full baths! Kitchen features granite counters, stainless steel appliances, lots of cabinet space and more! Finished lower level with full bath! Convenient to shopping and 695!
Rarely Available End of Group Townhouse on private court within walking distance to Quarry Lake shops and restaurants! Updated eat in kitchen with island and granite counters and open to Family room. Enjoy entertaining on deck accessible through kitchen door. Separate living and dining area, gorgeous stone stacked wood burning fireplace. Spacious bedrooms, cathedral ceiling, Primary BR en suite, with Jacuzzi tub and separate shower, walk in closet. Fully finished lower level with Den/Bedroom, recreation room and tons of storage! Community pool, tennis courts, and Clubhouse included in HOA! Welcome Home!
Welcome to this beautifully renovated Baltimore townhouse, offering exquisite finishes and immaculate details from the time you step through the door. The main level opens up to the spacious living room with elegant ceiling design and contemporary flooring throughout. You are then led to the bright dining area which faces the gourmet kitchen including an expansive island, sleek stainless steel appliances, ceramic flooring, generous cabinet space, and stunning granite countertops. Off of the kitchen you can access the balcony which overlooks the fenced back yard. The well-lit fully finished lower level provides ample space for you to create your own sanctuary, including a full bath, laundry,
Welcome to this lovingly restored historic home of exceptional proportions for the Fell's Point neighborhood. From the moment you step through the double front doors into the front room, it is clear this home is suited to gracious living and entertaining. The large living and dining space is flanked by twin wood-burning fireplaces that feature custom mantels and mirrors. Here, and in several other places in the home, you can see original walls that tell the story of what came before. This light filled space easily accommodates large gatherings of 20+ people. The chef's kitchen overlooks the side and back yards. With the fairytale lights and unique plantings, guest often marvel they've been
Welcome to this porchfront home in the neighborhood of Cherry Heights. Home offers 1553 sq ft of living space and features an open floor plan with carpet floors, a formal living room, kitchen-dining room combo with appliances, four spacious bedrooms with built-in closets, two full baths with soaking tub and a full basement that has plenty of living space and room for storage. The deck and large rear yard is great for outdoor fun.
Baltimore row house renovated in a contemporary style ----- 4 finished levels ready for a new owner to move right in and enjoy ----- The exterior is Baltimore City all the way with its weatherproof formstone front and Baltimore's iconic marble steps ----- To keep up with modern day living, a drop box has been installed outside so that your deliveries do not get wet in the rain while you are at work ----- The interior features Hardwood Floors, Exposed Brick Accent Wall, Zoned HVAC System, Copious Amounts of Kitchen Cabinet Space, Bedroom Level Washer and Dryer, 3 FULL Baths, Dedicated Level for the Primary Bedroom Suite, Transom Windows to Brighten Up the First Level, Rear Exits from the K
With approximately 2,600 square feet of finished living space, this 13.5-foot-wide Brewers Hill rowhome offers everything on your wishlist! This classic brick rowhome is adorned with string lights and gives a nod to old Baltimore with its marble front steps. Upon entering the home, you'll immediately notice how bright and spacious it is. The open main level has ample space for living and entertaining. You have space for a large dining table for more formal gatherings or can enjoy a casual meal at the breakfast counter in your eat-in kitchen. This kitchen is massive for a city home and is complete with granite countertops and stainless steel appliances. Plus, this level has a half bath for a
ONLINE AUCTION: Bidding begins 5/6/2024 @ 10:00 AM. Bidding ends 5/8/2024 @ 7:10 PM. List Price is Suggested Opening Bid. Deposit: $5,000. This 2-story home is located in the Brooklyn area, conveniently situated minutes away from Arundel Village Park, Brooklyn Park, and the Ritchie Hwy Shopping Center. Additionally, it offers proximity to a wide array of shops, restaurants, and businesses along Ritchie Hwy. The property provides easy access to major traffic arteries including Ritchie Hwy and I-895, facilitating smooth commutes. Currently, the property is vacant. For more details, please see the information provided below.
Check out this Row Home in the Patterson Park area. Its on the unit block north of Baltimore St. only a few blocks to Patteson Park, Restaurants, and Stores. The house has 2 Beds and 2 Baths on the 2nd floor, living room, half bath, and large kitchen on the main level, bonus room ( could be used as bedroom, office, den etc. .. ), another full bath, mechanical, laundry, storage in the basement. The property boasts fresh paint, flooring, and other improvements. Have agent review disclosures. This is so much house for the dollars. Its a great value. Sold as-is.
2bd/1.5bth rowhome located within walking distance of Johns Hopkins! Fully renovated over the last 5 years - new floors, cabinets, countertops, appliances, fixtures, and hvac! Property is currently rented with a lease that expires in August 2024. Don't miss out on this opportunity to capitalize on an affordable property located within the heart of Baltimore City prime for further investment and appreciation.
Nicely renovated home from top to bottom. New flooring throughout (hardwood flooring on the 1st. floor and new carpet in every bedroom on the 2nd floor). The lower level is fully finished, walk-out including a full bathroom. Located just steps from Coppin State College and minutes away from downtown. Energy efficient recessed lighting throughout.
A fantastic opportunity in the Bridgeview-Greenlawn district of Baltimore. This single-family rowhome, featuring three bedrooms and one bathroom, has the potential to be transformed into a stunning home. The property, spanning 1,080 sqft, has been vacated and is situated near Easterwood Park and Leon Day Park. Rental prices for renovated properties in the area range from $1,300 to $1,500, ensuring a promising return on your investment. Consider the recent sales of renovated homes in the vicinity: 2202 Roslyn Ave sold for $280,000. 2505 Roslyn Ave for $285,000. 2916 Poplar Terrace for $222,000. As-s sale. With opportunity knocking at your door, book your showing today!
Welcome to 1502 N Kenwood Ave in the Berea district of Baltimore! This single-family rowhome with three bedrooms and two bathrooms is currently occupied by a good-standing tenant (monthly rent excluding utilities $1,045). Situated near Clifton Park and Patterson Park. Rental rates for renovated apartments in the vicinity typically range from $1,400 to $1,600. Recent sales of renovated homes in the same area include: 3317 Richmond Ave sold for $310,000. 3303 Richmond Ave for $300,000. 901 N Kresson St for $250,000. Kindly request that you provide proof of funds for showing access, as-is sale. Opportunity is knocking! Book your showing today!
Welcome home to a move in ready three level fully remodeled & Renovated custom Patterson Park row-home. With private entrance and parking via back alley (securely behind the home) with entrance to the basement, rooftop balcony-deck with a magnificent view of the city , great for entertainment, a large, finished basement with a full bathroom for guests. Three fully renovated bathrooms with Jetted tubs, with high ceilings and custom lighting in every bathroom. Custom lighting in bedroom as well as recess lighting throughout. This home also includes a gourmet kitchen with stainless steel appliances with granite countertop, elegant stairways, very spacious interior, with a bunch of closet
This area's enrollment policy is not based solely on geography. Please check the school district website for more information.
Elementary schools
Middle schools
High schools
GreatSchools Summary Rating
7/10
Roland Park Elementary/middle School
Public, PreK-8 • Choice school
7/10
Relay Elementary School
Public, PreK-5
7/10
Thomas Johnson Elementary School
Public, PreK-8 • Choice school
6/10
Arbutus Elementary School
Public, PreK-5
6/10
Park Elementary School
Public, PreK-5
Only showing 5 of
100+ elementary schools.
School data is provided by GreatSchools, a nonprofit organization. Redfin recommends buyers and renters use GreatSchools information and ratings as a first step, and conduct their own investigation to determine their desired schools or school districts, including by contacting and visiting the schools themselves.Redfin does not endorse or guarantee this information. School service boundaries are intended to be used as a reference only; they may change and are not guaranteed to be accurate. To verify school enrollment eligibility, contact the school district directly.
Baltimore, Maryland boasts a comprehensive public transportation system, including buses, light rail, and subway services, offering residents various options for commuting. The city is known for its heavy traffic levels, particularly during peak hours, so driving a car can be time-consuming. Baltimore is well-connected to the rest of the country with several nearby highways and freeways, such as Interstate 95 and Interstate 83. Despite the traffic, the extensive public transportation and highway systems provide residents with multiple options for navigating the city and beyond. Learn more on our Baltimore city guide.
What types of properties are available in Baltimore?
Baltimore, Maryland offers a variety of single-family home types, including ranch-style, split-level, colonial, and contemporary homes, among others, each with their own unique architectural features and designs. These homes can be found throughout the city, in neighborhoods such as Canton, Federal Hill, and Roland Park, among others. Most properties in Baltimore offer a range of bedrooms, from two to five, and were built in various years, providing a diverse selection for homebuyers. To explore different property types for sale in Baltimore, Maryland, use the 'Home type' filter located above the active listings. Customize your search by selecting options like single-family homes, condos, townhomes, and more.
What is life like in Baltimore?
Living in Baltimore, Maryland offers a unique urban experience with a mix of historic and modern architecture. The city is surrounded by a diverse range of landscapes, including waterfront areas and vibrant neighborhoods. The weather in Baltimore varies throughout the year, with hot and humid summers and mild winters. The city provides a wide range of job opportunities across various industries, including healthcare, education, and technology. Baltimore offers a vibrant arts and culture scene, with numerous museums, theaters, and music venues to explore, as well as a variety of dining options and local festivals to enjoy.
What are the schools and amenities like in Baltimore?
Baltimore, Maryland, offers a variety of public amenities for its residents. The city is home to numerous restaurants, serving a wide range of cuisines to cater to diverse tastes. Baltimore also boasts several parks, providing spaces for relaxation and recreation. Grocery stores are plentiful throughout the city, making it easy for residents to access daily necessities. Additional amenities include libraries, gyms, and community centers, all designed to enhance the living experience in Baltimore.
In the past month, 670 homes have been sold in Baltimore. In addition to houses in Baltimore, there were also 204 condos, 2372 townhouses, and 22 multi-family units for sale in Baltimore last month. Baltimore is a moderately walkable city in Maryland with a Walk Score of 64. Baltimore is home to approximately 620,567 people and 325,448 jobs. Find your dream home in Baltimore using the tools above. Use filters to narrow your search by price, square feet, beds, and baths to find homes that fit your criteria. Our top-rated real estate agents in Baltimore are local experts and are ready to answer your questions about properties, neighborhoods, schools, and the newest listings for sale in Baltimore. Our Baltimore real estate stats and trends will give you more information about home buying and selling trends in Baltimore. If you're looking to sell your home in the Baltimore area, our listing agents can help you get the best price. Redfin is redefining real estate and the home buying process in Baltimore with industry-leading technology, full-service agents, and lower fees that provide a better value for Redfin buyers and sellers.


 REDFIN IS COMMITTED TO AND ABIDES BY THE FAIR HOUSING ACT AND EQUAL OPPORTUNITY ACT. READ REDFIN'S FAIR HOUSING POLICY AND THE NEW YORK STATE FAIR HOUSING NOTICE.
 United States
 Canada