Nestled just minutes from the pristine shores of Point Dume and Zuma Beach, this brand-new contemporary-style masterpiece boasts five ensuite bedrooms spread across 6,792 square feet of meticulously designed living space. Guests are greeted with gated entry and breathtaking ocean views. Inside, discover a chef's dream kitchen equipped with Thermador appliances. The primary bedroom offers large glass doors opening to the backyard, stunning ocean panoramas and dual bathroom suites and walk-in closets. The expansive yard features a sparkling pool, spa, a full gym that opens up to the backyard, barbeque area, dining space, fire pit, and multiple view decks. Enjoy a wine cellar, bar area, three-
Sensational bluff top townhome with totally unobstructed white water ocean views. Located in the guard gated and secure Zuma Bay Villas directly above sandy Westward Beach, this one of a kind end unit is privately located on a very quiet cul-de-sac street. It has been completely renovated and comes fully furnished. The unit features a custom-built floor plan with three spacious bedroom suites upstairs, two with direct, head-on white-water views. Downstairs is a spotless gourmet chef's kitchen with Blue Bahia granite stone counter-tops and stainless-steel Bosch, Subzero and Miele appliances. The kitchen is open to an adjoining living room complete with Restoration Hardware furnishings (inclu
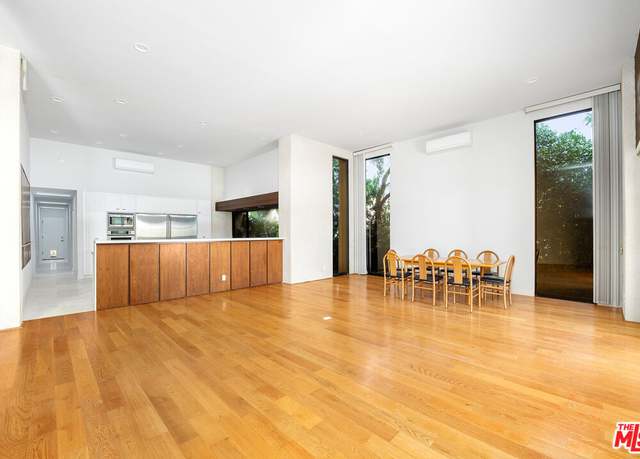
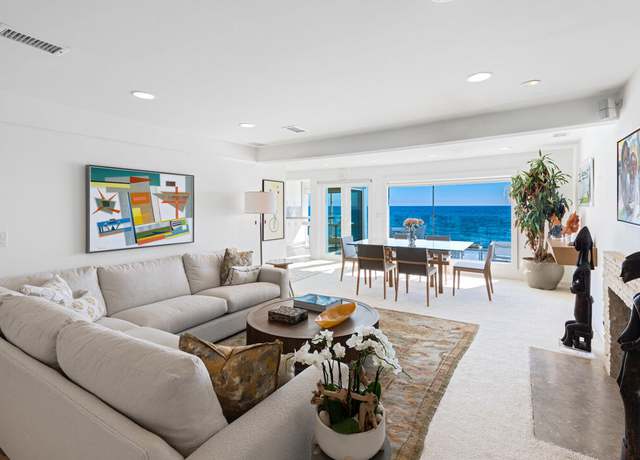
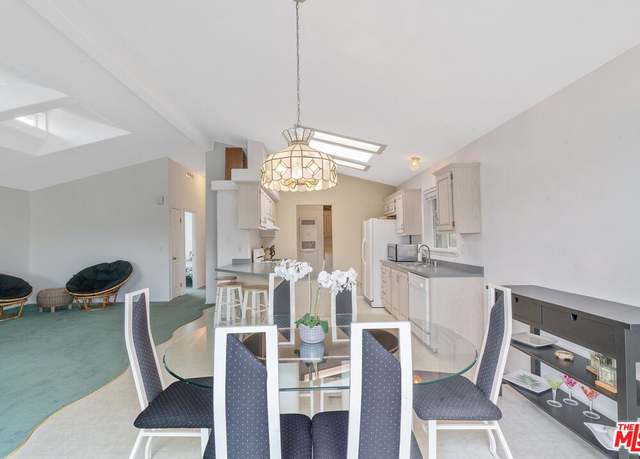
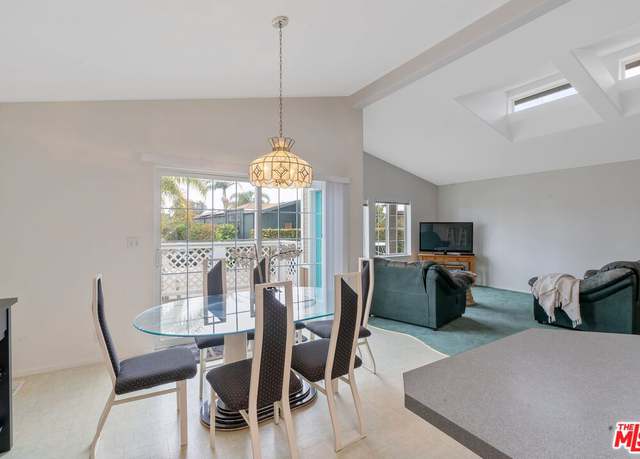
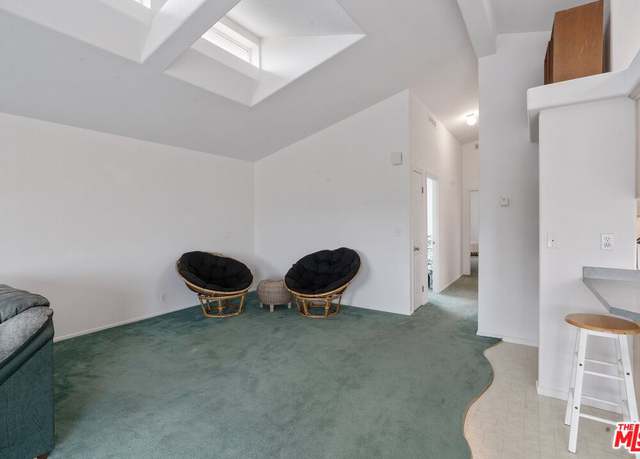
Ocean View 3 Bedroom, 2 Bath home in the Pt. Dume Club of Malibu. Wood floors, kitchen with granite counters, master bath with Travertine tile. Living room with fireplace and slider to huge outdoor deck with ocean, mountain, and sunset views. Large fenced yard. Enjoy the amenities the park offers, including clubhouse, pool, spa, tennis court, and Zuma beach access. 24hr gated community. Only a short walk to Zuma beach and local restaurants, shops, and market.
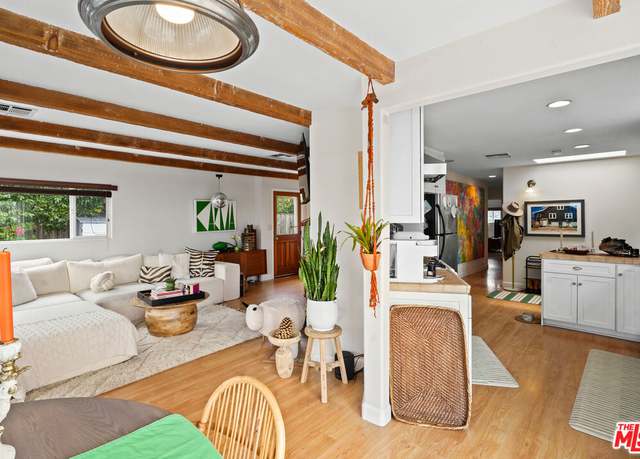
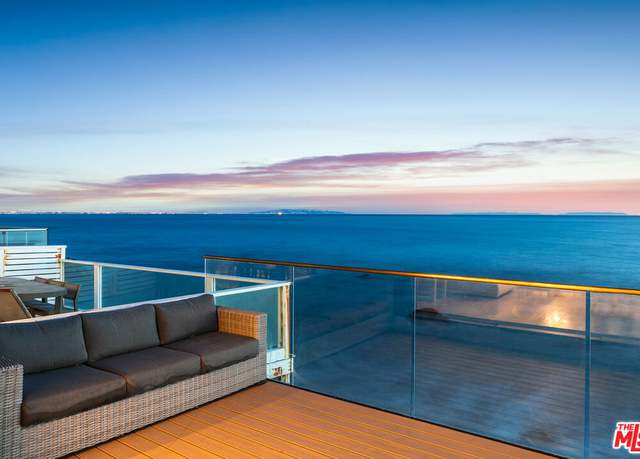
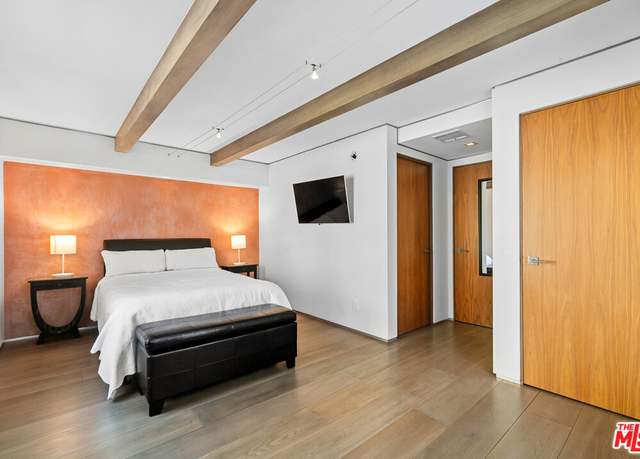
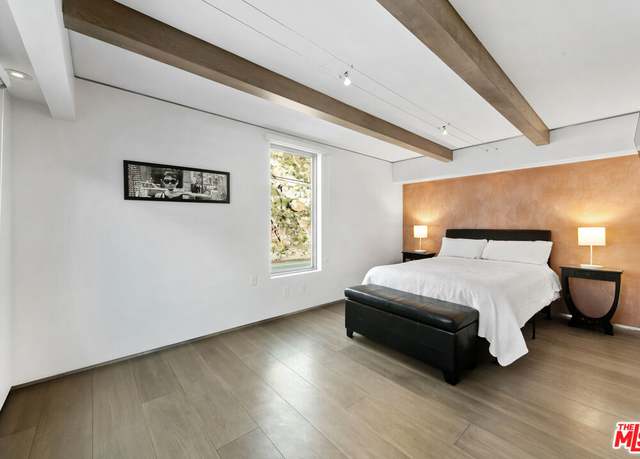
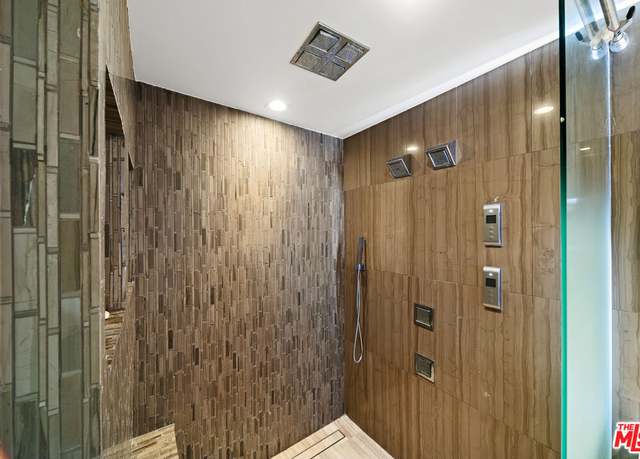
Welcome to Malibu Bay Club, an exclusive gated community of just seven streets nestled along the pristine Malibu Coast, offering breathtaking views of the glistening waters. It is one of the few beachfront complexes in Malibu and provides direct access to the sandy shores, and it's just minutes away from the local's favorite surf breaks. This beachy flat has renovated almost everything down to the studs, and now it features central air and heat (it's one of the very limited flats that offer this due to its location and ability to plumb for it. ) It now offers LED lighting, beamed ceilings, newer cabinetry, tiled backsplashes, sleek countertops, stainless appliances, glass shower enclosures,
Experience the epitome of luxury living at Escondido Beach's premier residence. This stunning contemporary home boasts opulence at every turn, featuring a grand entrance with a 20-foot glass rotunda, panoramic views of the Pacific Ocean through fold-up windows, and impeccable furnishings that exude beachside chic. Step into the newly renovated interior and discover four enchanting ensuite bedrooms, including two master suites, a state-of-the-art kitchen with custom cabinets and Viking appliances, and tasteful neutral decor throughout. Outside, indulge in breathtaking ocean vistas from expansive terraces on each level and unwind on the pristine grassy lawn, perfect for entertaining or unwind
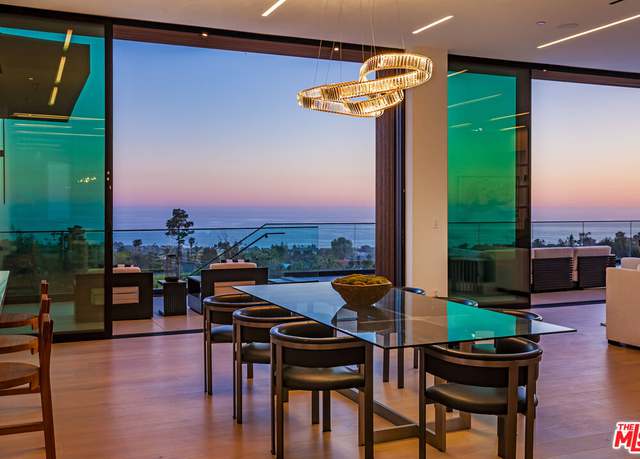
Sitting on a rocky outcropping where the waves of Matador Beach lap along the sand, this 2,861-square-foot, 4 bedroom 4.5 bathroom gem takes the experience of Malibu beach-front living to a new level. The interiors are a bastion of dazzling light and unobstructed coastline views of the sunset and the Channel Islands are incredible. A clean and contemporary design, where relaxation is paramount and vistas of the coveted serene surroundings take center stage. Recently renovated, the living spaces are remarkably open and bright, the corner dining room is wrapped in windows that create a veritable wall of dynamic, cinematic art capturing ocean waters, clear blue sky, from the Channel Islands an
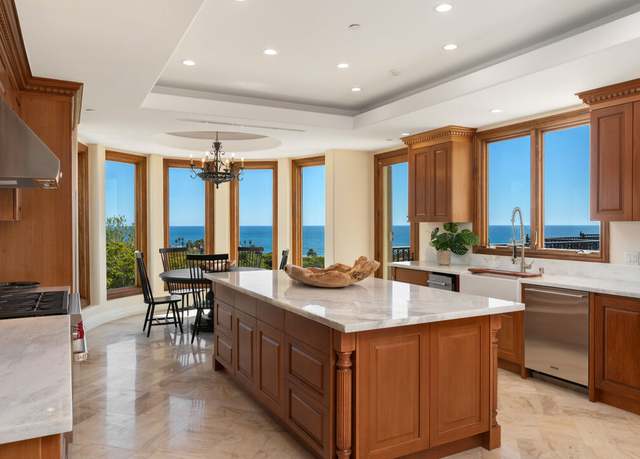
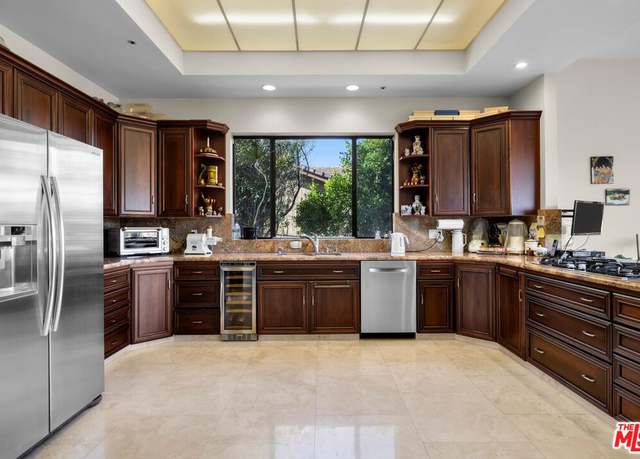
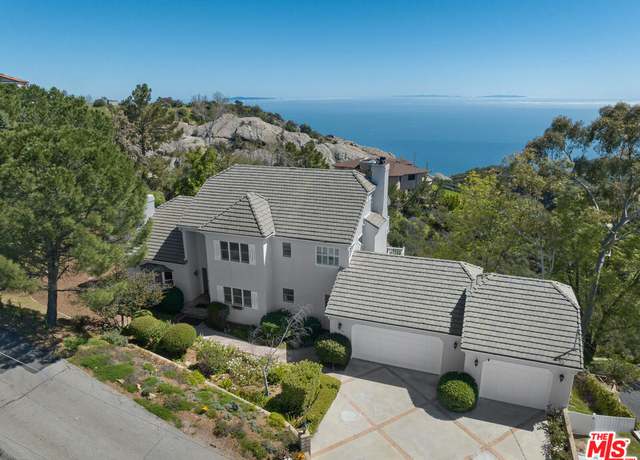
Perfectly situated above Zuma in the very desirable Sea Star Estates, this gorgeous, private, Tuscan-style compound commands a sweeping panorama of ocean, islands, coastline, and verdant mountainsides. From the breathtaking dual-staircase foyer to the double kitchens, wine cellar, grand terraces, and gym, this is a residence created for sophisticated indoor-outdoor entertaining. Exquisitely renovated, the interior is awash with natural light. Chandelier ceilings, stately columns, and stone floors define rooms that are spacious and elegant, with handsome woodwork and wonderful flow to ocean-view terraces and beautifully landscaped grounds. The estate's main floor is both formal and open, wit
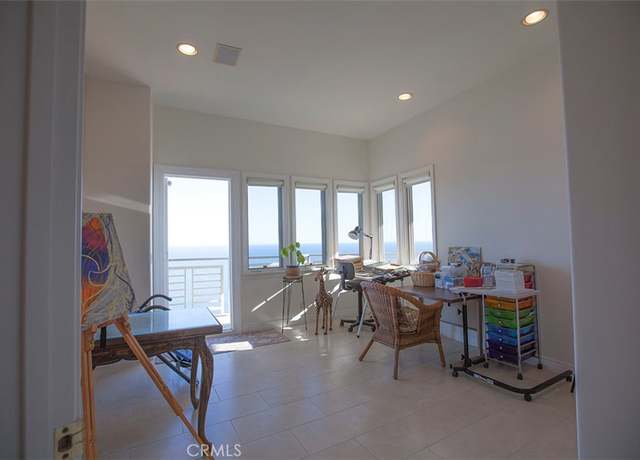
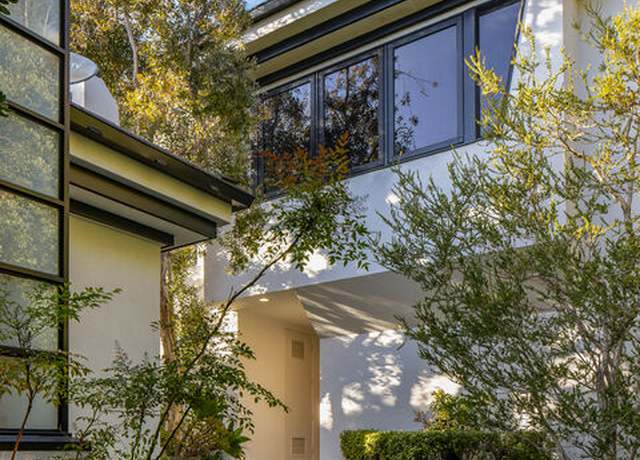
Nestled upon the bluffs of Zuma Beach, this extraordinary gem presents a rare chance to reimagine your own piece of paradise set on over an acre of pristine flat land. Just a minutes walk away from the famous Zuma Beach, you'll relish direct access to sandy shores, soothing waves, and breathtaking sunsets. This sprawling estate boasts an exceptional location, unmatched ocean views, large scale rooms, and a desirable neighborhood featuring prominent figures from the celebrity and tech elite circles. As you step inside this architectural marvel designed by renowned Buff and Hensmen, you'll be greeted by awe-inspiring 25ft ceilings that infuse the space with an open and airy ambiance. The prop
Nestled in the prime section of serene and highly coveted Sunset Mesa and first time on the market in 30 years, lies this inviting 4 bed, 3.5 bath single level gem. Featuring new roof, plumbing, electric, windows and doors, and upgrades throughout, not to mention tranquil Santa Monica Mountain and dazzling ocean views including Queen's Necklace, Palos Verde, and Catalina abound from this special property. A peaceful backyard awaits, replete with a relaxing jacuzzi, Endless Pool, and outdoor shower, perfect for winding down after those post-surf and beach days. A fabulous neighborhood for walking all the while just minutes to the Getty Villa, hiking trails, and beautiful beaches, in addition
Live the Malibu lifestyle to its fullest in this rare Paradise Cove property with breathtaking direct ocean views. The home features a stunning, expansive deck overlooking Paradise Cove Beach with plenty of space to relax, dine, and entertain, as well as a luxury built-in outdoor kitchen. Step through the glass doors into the open-concept living and dining space, and enjoy seamless indoor/outdoor living (and those incomparable ocean breezes). The spacious kitchen features a large center island and a charming breakfast bar perfect for enjoying a casual meal with an ocean view. In the tranquil primary bedroom, you'll find an en-suite bathroom with dual pedestal sinks for an added touch of lux
Location, location, location! Perfect opportunity for an end user and or developer to re imagine this home to its full potential. Located in the sought after Point Dume community in Malibu, this home sits on over 1 acre mostly flat with Ocean and Mountain Views. Currently the home is 4 beds and 3 baths that can be moved in and redone over time or rebuild now. This is an opportunity of a lifetime to acquire this much land with ocean views and only a few minutes to walk to the beach. Hurry this will not last!
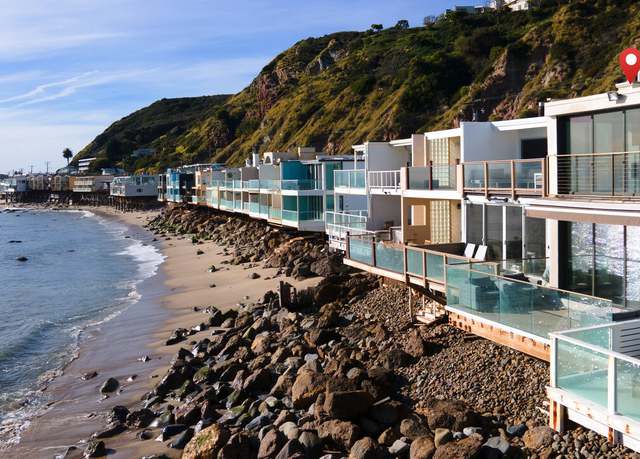
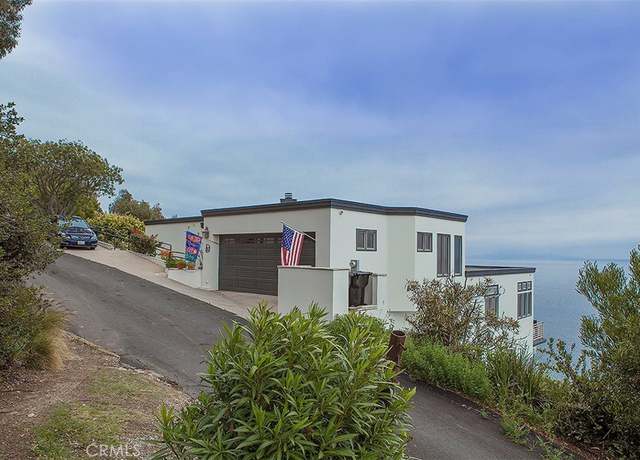
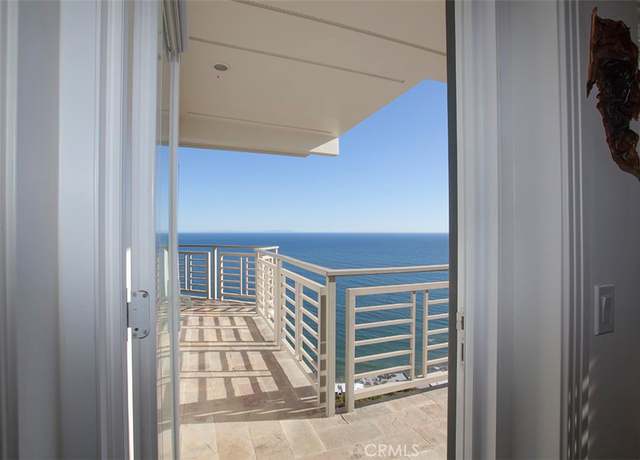
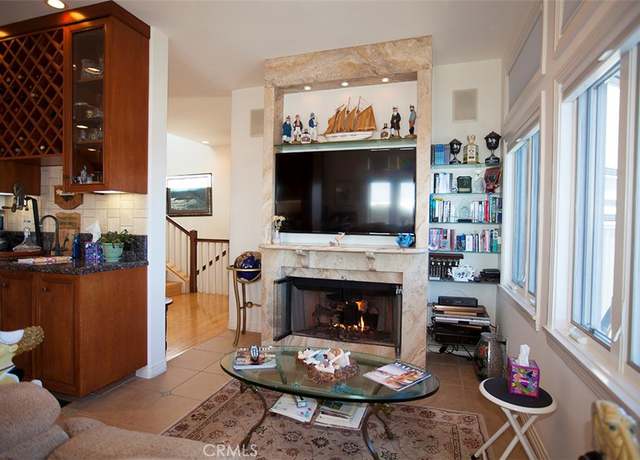
Perched above the sandy expanse of Las Tunas Beach in a highly desirable close-in Malibu location, this bright beachfront home is updated, comfortable, and fully focused on the breathtaking views. A sweeping panorama of picturesque coastline includes the sparkling lights of the Queen's Necklace, the ever-changing sunrise-to-sunset ocean and sky, plus the distinctive contour of Catalina Island on the horizon. With oceanfront decks on two levels for lounging, dining, and entertaining, the home's clean lines, huge windows, and art-gallery walls reflect its mid-century origins. On the lower level, the main living area features an open living/dining great room complete with fireplace, a wall of
This sensational hilltop estate offers some of the very best ocean views in all of Malibu. Located on a quiet cul-de-sac street in western Malibu, the property is surrounded by nature and backs up to hundreds of miles of pristine parkland. It is just two minutes away from PCH yet has no highway noise - just the sweet sounds of nature. Gated and secure, impressive hand painted tiles, risers, and tropical landscaping welcome you to enter through the handcrafted antique doors. Inside are giant exposed beam ceilings, and an entry skylight towering 23 feet above the foyer. The main entertaining space includes an expansive great room, walled with floor to ceiling windows and walls of glass that l
This exquisite oceanside property offers a rare opportunity to purchase a home in the highly-coveted Bluff section of Malibu's exclusive Paradise Cove community. Nestled on one of the park's most sought-after streets, with direct beach access and tons of charming features, the residence promises a coastal lifestyle sure to meet the most discriminating beach-lover's expectations. As you step inside, you'll be greeted by high ceilings and an abundance of natural light pouring through the skylights, illuminating the expansive living/dining areas with a warm and inviting glow. The open-concept floor plan creates a seamless flow, offering a bright and airy space in which to relax and entertain.
Just completed modern Malibu oasis on over an acre lot with an impeccable floor plan, lush grounds, huge grassy backyard, and views of mountains and the Pacific Ocean. Warm contemporary design with beautiful finishes throughout. This spacious home offers 5 BD, 5BA, and a game room. The living and dining rooms seamlessly blend with the kitchen and have gorgeous natural lighting from floor-to-ceiling sliding glass doors that open for indoor/outdoor living. The patio space has built-in heaters and is perfect for dining al fresco. Additional amenities include a mini ranch, citrus garden, swimming pool with spa, and outdoor space for a sport court. 2-car garage with large, gated driveway for add
Perched within the exclusive, private and gated Malibu Colony Estates, this contemporary masterpiece by renowned architect Doug Burdge offers luxury coastal living at its finest. Positioned on over 1.3 acres, the residence captures breathtaking vistas of the ocean, islands, and Queen's Necklace. Inside, discover seamless indoor-outdoor living, with expansive patios and decks creating inviting spaces for lounging and entertaining. The main level features high ceilings, travertine floors, and walls of glass framing panoramic views, while the upper level hosts four bedrooms, including a lavish primary suite with dual en-suite bathrooms and a view deck. The lower level presents a spacious rec r
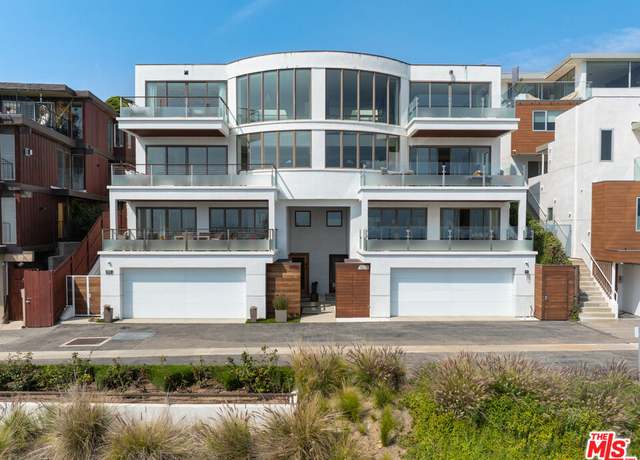
First time on the market! https://vimeo.com/902652312?share=copy Discover unparalleled luxury coastal living in this newer construction architectural masterpiece, by an award-winning developer, a 4-story townhome nestled along the beautiful Pacific Coast with full ocean views! Boasting 4 bedrooms, 5 luxurious baths, and an impressive 4930 square feet of tastefully appointed features, this property promises a life of unsurpassed comfort and elegance. Enjoy sweeping white water ocean views from Getty Villa to Santa Monica and Catalina. Revel in the breathtaking sights from the expansive limestone private decks, or enjoy from the comfort of your home, bathed in natural
Oceanfront bliss awaits in Malibu Cove Colony! Situated on approximately 50 feet of sandy beach frontage, this coastal oasis features endless whitewater, ocean, and coastline views all the way to Point Dume. Enter through a sun-filled, private courtyard with an expansive Ipe deck that wraps around all the way to the beach. Inside, enjoy casual elegance and beautiful natural light surrounded by high beamed ceilings, recessed lighting, and hardwood floors. A spacious living room boasts a tiled fireplace and endless ocean views through floor to ceiling windows and glass sliding doors, beckoning you onto the oceanfront deck that spans the entire frontage of the home. Private stairs offer easy a
This gorgeous, light-flooded two-level condo in Malibu's exclusive Point Dume neighborhood comes with a highly-coveted beach key acess to Little Dume - one of the most stunning beaches on the coast. Located in a private, gated complex, this home offers access to the incomparable Malibu lifestyle with the added bonus of ultra-convenience - fantastic shopping, dining, and pharmacy are mere steps away, and world-class Malibu schools are right down the street. The chic, modern exterior reflects the architectural beauty inside - soaring ceilings and oversized windows let the sunlight pour into the spacious living/dining areas on the lower floor. Enjoy relaxing in the sweet private sun deck area
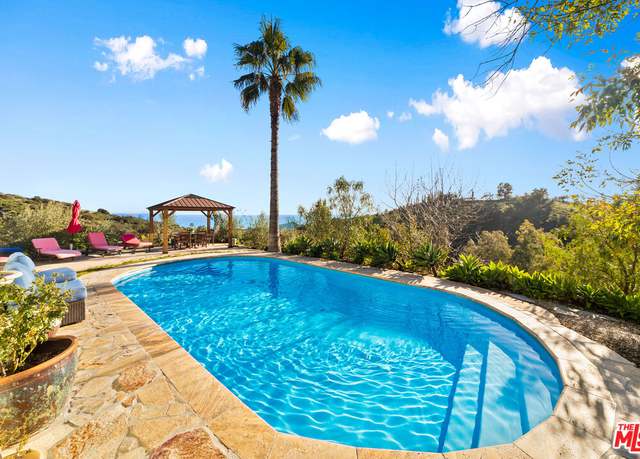
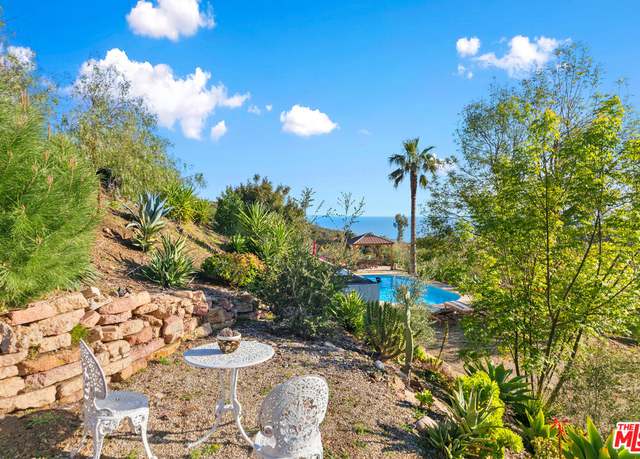
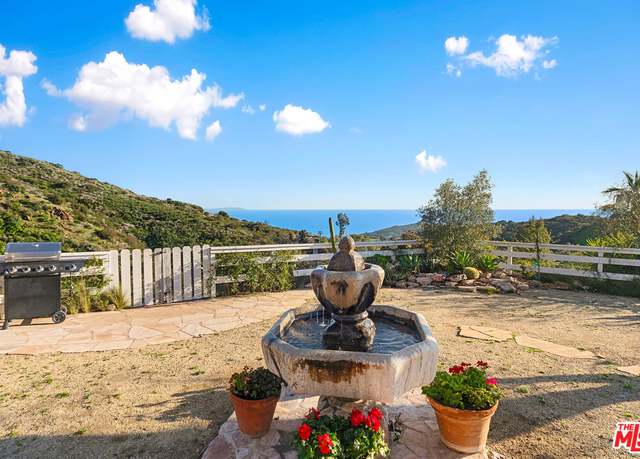
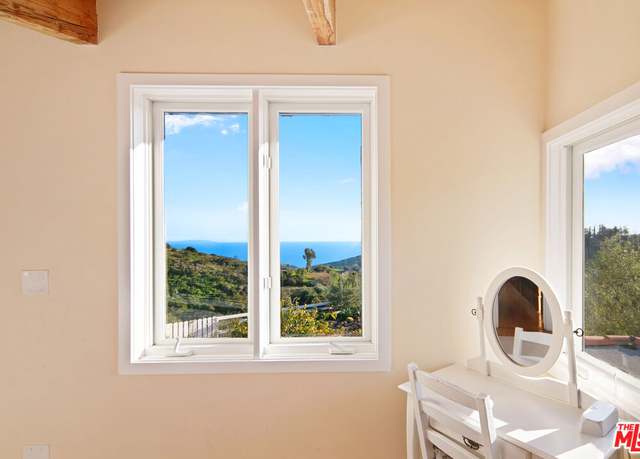
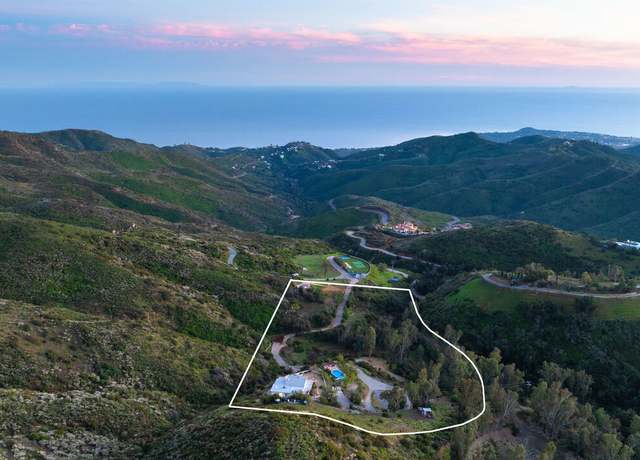
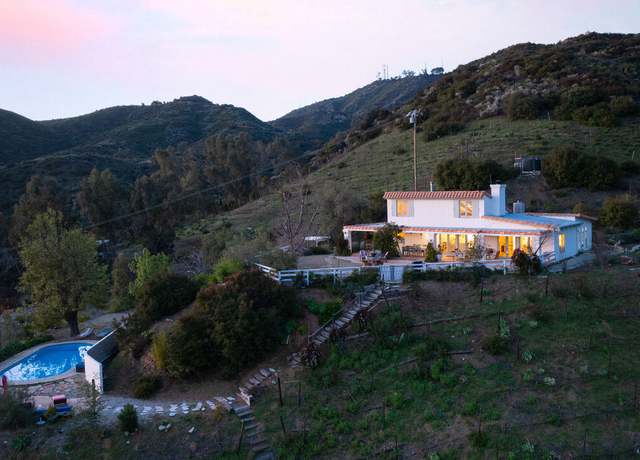
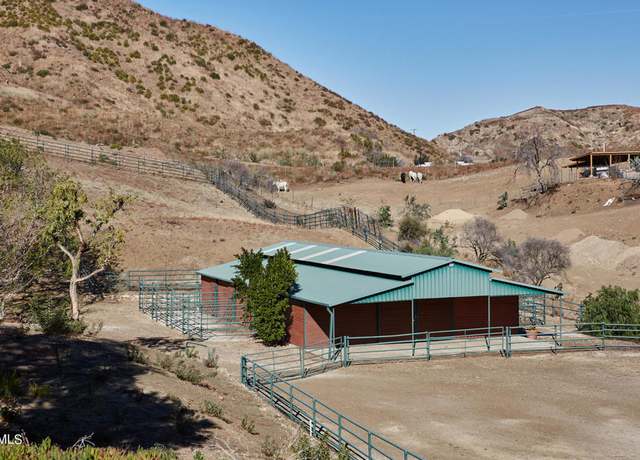
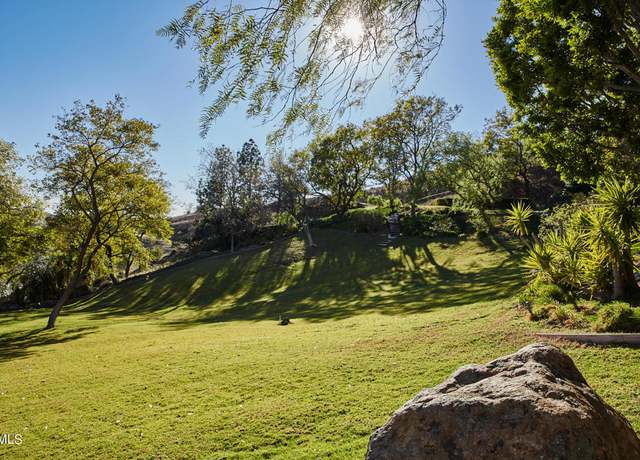
An opportunity to own an exclusive paradise in the hills of Malibu with this secluded cottage-style ocean-view home. Situated on 6 acres comprising of two legal lots, with a pool, vineyards and room for horses, this property offers breathtaking ocean views in a tranquil rural setting that is sure to captivate the heart. With 3 bedrooms and 2 bathrooms, this cozy retreat provides the perfect blend of comfort and convenience. The open-concept living space features a warm and inviting atmosphere, the ocean-view primary suite has French doors leading to the verandah, the second bedroom leads to a private patio with a fountain. The third bedroom is located in the loft. The kitchen has generous c
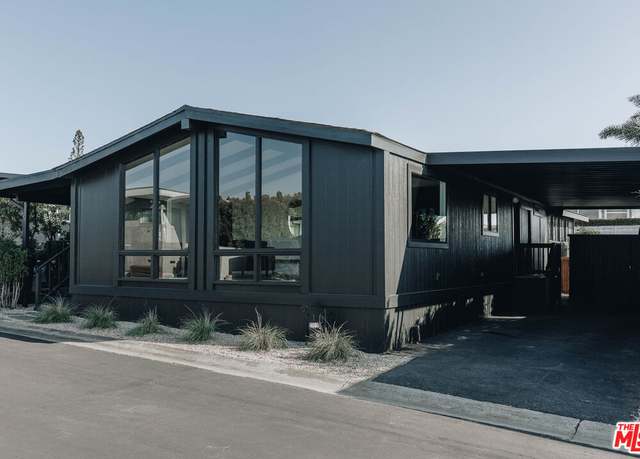
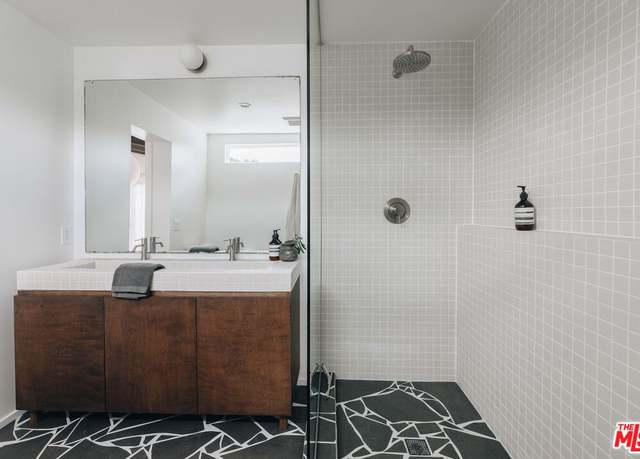
Welcome to this stunning mid-century modern home designed by Whlf Studio and featured in Dwell. Located in the coveted Point Dume Club of Malibu, this exquisite beach home boasts 4 bedrooms, 2 bathrooms, and a private backyard space. The recently remodeled home features high ceilings, exposed beams, white oak floors, stylish fixtures and an abundance of natural light throughout. Impeccable attention to detail is evident throughout this home, with the rich allure of wood and glass doors and large windows strategically positioned to capture the awe-inspiring vistas of the ocean and mountains. This thoughtful design element integrates the natural beauty of the surroundings into the flow of the
Just in time for the summer! This beach property boasts 3 bedrooms, 4 bathroom, oversized deck and access to the beach. Lots of natural light, large living room, remodeled kitchen and bathrooms, beautiful floors, and large bedrooms. The complex offers tennis courts and basketball courts, visitor parking and direct access to the beach just steps away.
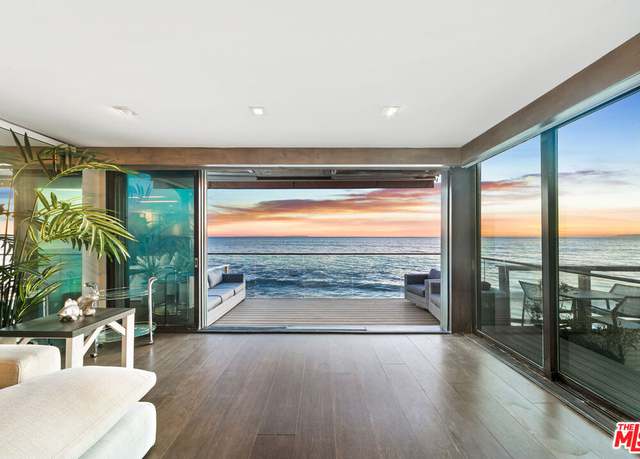
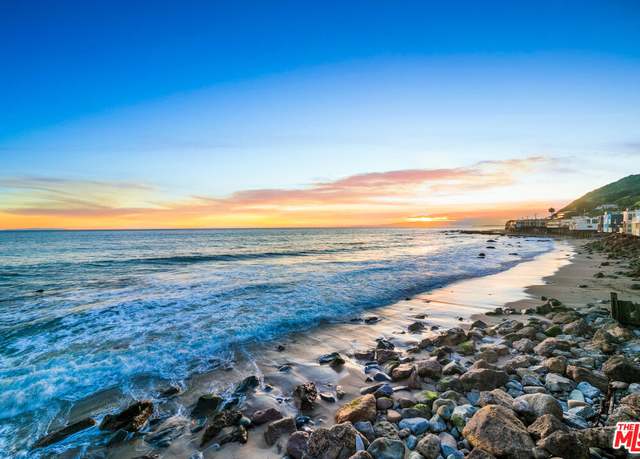
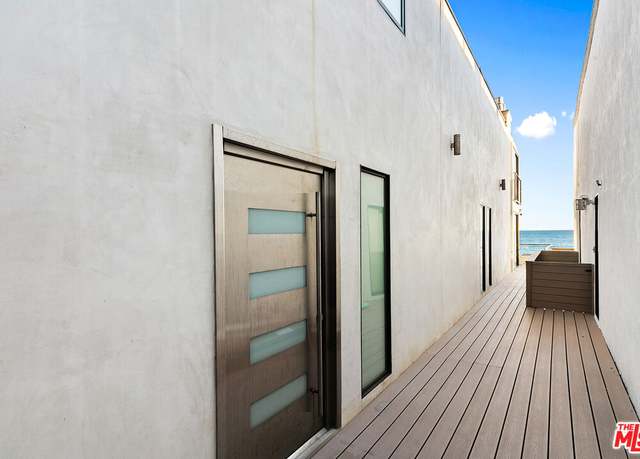
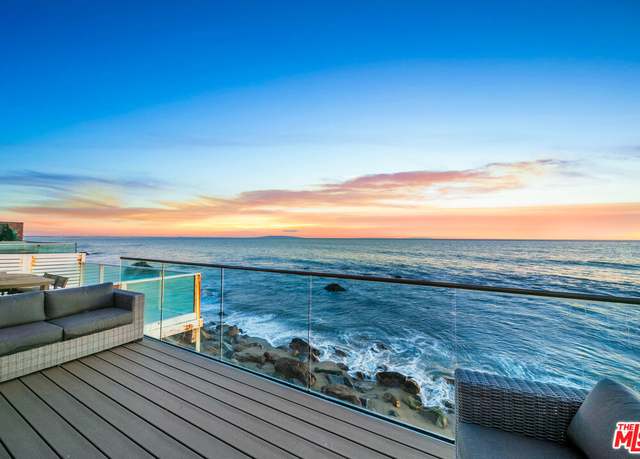
Ocean-front luxury home for sale in Malibu. 20532 Pacific Coast Highway is a recently renovated designer-done oceanfront retreat in Malibu. This two-bedroom, three-bathroom home embodies Southern California's indoor-outdoor coastal lifestyle, with stunning ocean and coastline views from Palos Verdes to the east sunsets to the west, and views of Catalina Island. The Poliform kitchen, adorned with Poggenpohl cabinets and Miele appliances, seamlessly connects to an open living and dining area. Glass slider doors open to a beachfront deck with an electronic retractable awning, over the private, ocean-front deck. The primary suite offers expansive ocean views, a spacious closet, and a luxurious
Welcome to your new chapter of your life, luxurious coastal living in Malibu! Ever dreamt of waking up to the soothing gaze out to the pacific ocean from your bedroom? Your dream has come true with this magnificent 4066 sqft coastal haven, nestled along the pristine shores of the Pacific Ocean. Prepare to be enchanted by breathtaking ocean views from every room, where each glance out of the window promises a new spectacle of nature's beauty. Step inside this 4-bedroom, 3 1/2 bathroom retreat, and immerse yourself in a world of tranquility and luxury. From the moment you arrive, you'll be captivated by the sense of total privacy and serenity that surrounds you, offering a sanctuary from the
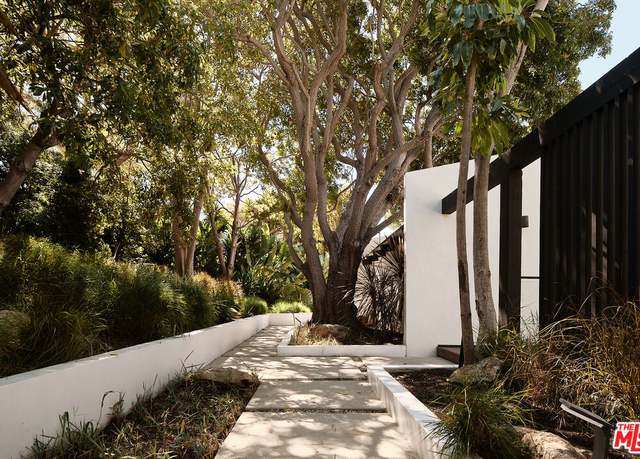
Welcome to your coastal paradise situated in a prime location on Malibu's famed Broad Beach. Beyond the entry and down a tranquil stone pathway lies a significant architectural compound, a haven of sophistication and tranquility surrounded by lush landscaping. The main residence captivates with an angular design, towering ceilings and lavish use of ceiling glass that captures the glorious sunlight to dance throughout the home. Enjoy the perfect blend of indoor comfort and outdoor serenity with elegant dining flowing to leisurely exterior lounging and entertaining. The dramatic entry foyer leads to the spacious ocean view living room with double sided fireplace, wet bar and picturesque views
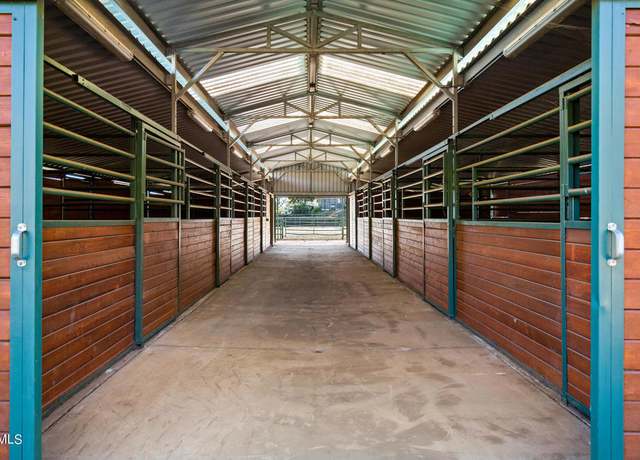
Discover the epitome of California living in this enchanting gated property nestled in Malibu's breathtaking landscape. Surrounded by natural beauty, this exquisite newer construction home boasts 4 spacious bedrooms and 4 bathrooms featuring stunning interiors and striking ocean views. Wake up to vibrant sunrises and sunsets over sweeping ocean vistas, providing an inviting backdrop for a day of exploration on foot, horseback, or motorcycle. This hidden gem offers a seamless balance between seclusion and accessibility, with gourmet dining at renowned restaurants like Nobu within easy reach and top-ranked schools district. The property spans an expansive 1-acre lot, inviting you to your own
Restored, reenvisioned, and celebrated as one of Edward Fickett's most remarkable architectural creations, The Filaree House is thoughtfully situated on over an acre in Malibu Park. While honoring Fickett's midcentury modern vision, the renovation upholds the authenticity of the original details and design. The gated driveway leads to the expansive approach and vestibule, where walls of glass unveil the grandeur of the double-level living room below, offering breathtaking vistas of the blue hues of the Pacific and vibrant sunsets. The main level contains the open-concept chef's kitchen and dining area overlooking the grassy lawn, shimmering pool, and paddle tennis court. A corridor of origi
Brand New Construction Doug Burdge Custom Coastal Modern Farmhouse with Panoramic Ocean and Mountain Views. Under development with completion Dec 2025. Developer will pre-sell this home and deliver this estate at close of escrow with a completed home and guest house totaling 4750 livable SF per Doug Burdge architectural and ID specifications with certificate of occupancy. Buyer customization of finish selections welcomed! Inquire about today's "as is" pricing or to review the Doug Burdge architectural plans. Now is the time to secure this breathtaking modern masterpiece and personalize finish and fixture selection with Burdge's ID team! Panoramic ocean and mountain views spanning
This serene, celebrity owned California retreat is tucked away in the hills of Malibu off of renowned Mulholland Highway. Surrounded by stunning mountain peaks and alluring ocean views, this private ranch property will transport you to another world. Drive through the front gates, down the private driveway surrounded by lush greenery, and you'll find a structure that currently sits on the property. The structure has been taken down to the studs, and is ready to be remodeled or transformed into your dream home. Approved building permits by Malibu architect Douglas Burdge AIA for a potential main house, which have expired, are available. The plans also contain the two bedroom (w/ bath &
Here is your chance to own a Malibu beach home in the coveted neighborhood of Point Dume for under $900,000.00! Located in the highly sought after and guard gated Point Dume Club, also known for being a friendly local community. In addition to the large community pool, spa, pickleball, basketball, and tennis courts, there is a kid friendly playground, BBQ, clubhouse, and saunas that offers recreation and relaxation alongside the ocean. Live the coastal lifestyle you have always dreamt about perched just above world famous Westward and Zuma beach. This home gives you front yard access to not only enjoy the mesmerizing sunsets, but to witness firsthand the abundant dolphin pods and gray whale
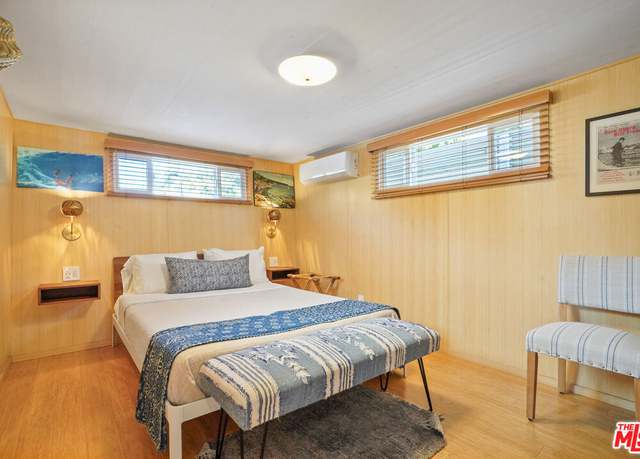
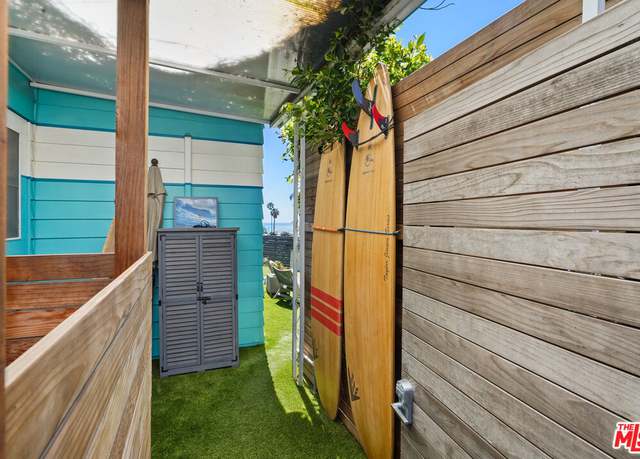
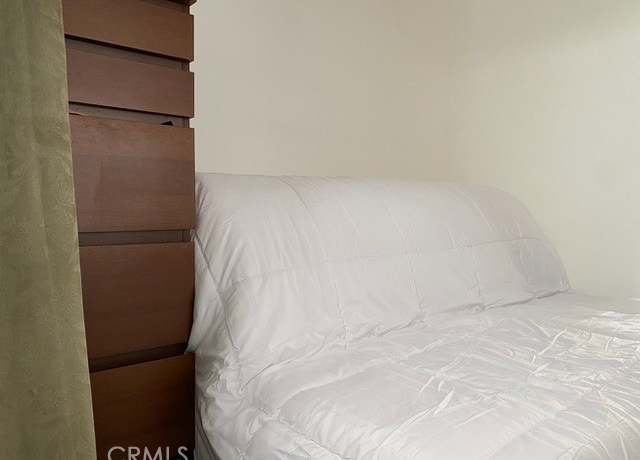
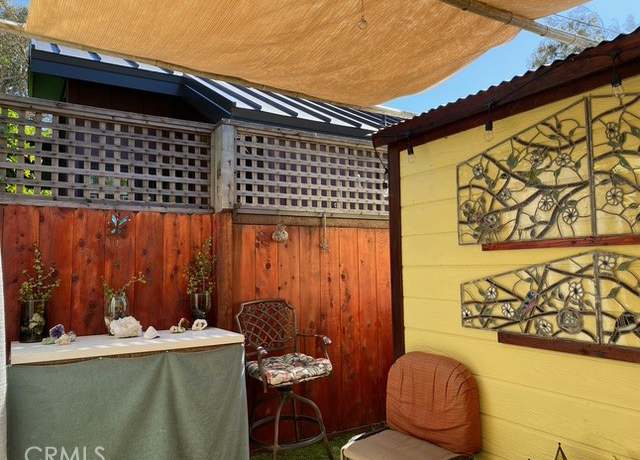
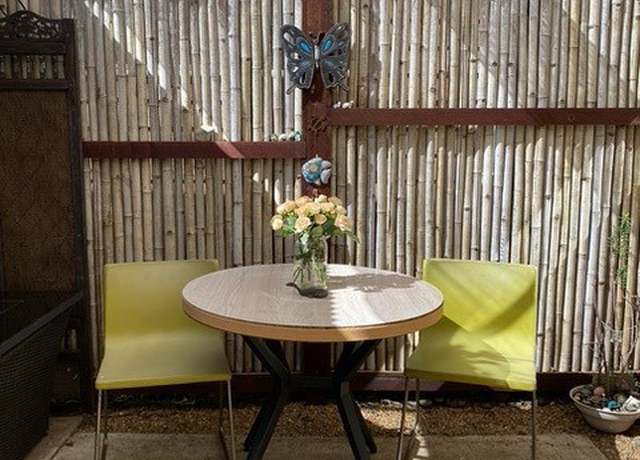
Come enjoy this iconic Paradise Cove Ocean view residence, where laid-back beach living meets comfort and convenience. This custom, one of a kind home offers a stunning ocean view, and a relaxed surf-inspired vibe that's perfect for those seeking a beachside retreat. This 2 bedroom, 1 bath, Casita provides a light and airy space, with a focus on natural bamboo wood interiors. Complete with high end fixtures and appliances, dual heating and AC units, outside shower, securely gated and fenced. The private outdoor deck and drop down garden sitting area is ideal for soaking up the sun, and taking in the breathtaking views of nature that surround you. Walk to the sand and surf, or golf cart ride
Nestled atop Winding Way in Malibu, spanning approximately 15.5 acres, lies an architectural gem crafted by the renowned Michael E. Barsocchini. This contemporary marvel showcases sweeping vistas of the ocean, stretching from Palos Verdes to Point Mugu. Upon the second gated entrance, a grand double-height foyer ushers you into a magnificent great room, adorned with a fireplace, retractable glass walls, and luxurious travertine flooring, all set against a backdrop of breathtaking views. The living space, dining area, kitchen, and media room seamlessly flow into one another and open onto an expansive deck running the length of the residence. A sophisticated floating walkway guides you to the
First time on market since major design renovations. This well designed impeccably maintained architectural beach house has all the comforts and style you want in your dream Malibu Road beach home, along with south facing views of the ocean, beach and bay, Malibu Colony, Palos Verdes and Catalina. This home sits on rock above the ocean so has none of the costly maintenance issues as homes with ocean rushing underneath them. Clad in white brick with Mahogany wood (same as Nobu) 22' plank garage doors and a unique Ipanema black and white marble mosaic driveway, this home exudes style. Soaring 36' Cathedral ceilings, white oak engineered wide plank floors with glass railings inside and out aro
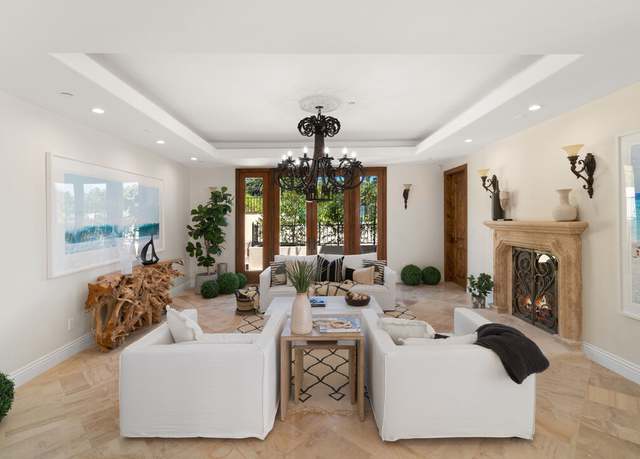
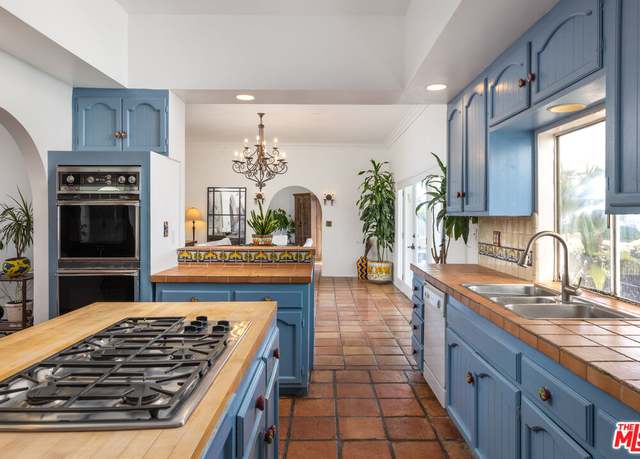
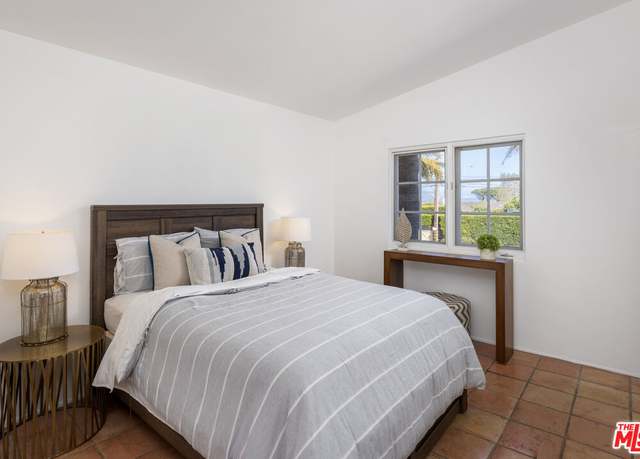
Nestled within the exclusive enclave of Point Dume, this Spanish-style villa exudes timeless charm and sophistication. Secluded behind gates, a grand circular driveway welcomes you, setting the stage for the captivating beauty that awaits within. From the moment you step inside, you are greeted by authentic details that evoke the essence of Spanish architecture. Hand-painted tiles adorn the space, while wrought iron fixtures accentuate the rustic elegance of the home. Terracotta tiles grace the floors, adding warmth and character to each space. The interior unfolds seamlessly, offering a harmonious blend of traditional craftsmanship and luxury. Expansive windows frame panoramic ocean views,
FLATROCK MALIBU ROAD: Located directly in front of the famous "Flatrock on Malibu Road" and on approximately 50 feet of sandy beach, this oceanfront residence offers endless coastline views from Point Dume to Palos Verdes. Malibu Road offers a location off Pacific Coast Highway while still being right in the center of Malibu near the best restaurants, shops and activities. Built in 2002, this home feels solid like the rock it takes it's name from with a concrete caisson foundation and the finest materials and finishes. The scale of the main level is unmatched with high ceilings and open living areas offering the perfect setting for beachside entertaining. Touch screen smart home a
An extremely private bluff top Malibu retreat, Casa Linda showcases exceptional architecture and ocean views from Palos Verdes to Point Dume. Featuring design by Marshall Lewis AIA, Casa Linda was crafted over 10 years and extensively updated in 2022, mirroring the hillside with curved walls and seamless indoor-outdoor living. Intricate details elevate the interiors, such as the formal living room with soaring ceilings and chef's kitchen with granite counters and Viking/Wolf appliances. A ribbon staircase to the primary suite with unobstructed views of Palos Verdes and Catalina , an ocean view office, kitchenette, with 3 closets and dual baths. An additional ensuite bedroom, stunning ocean
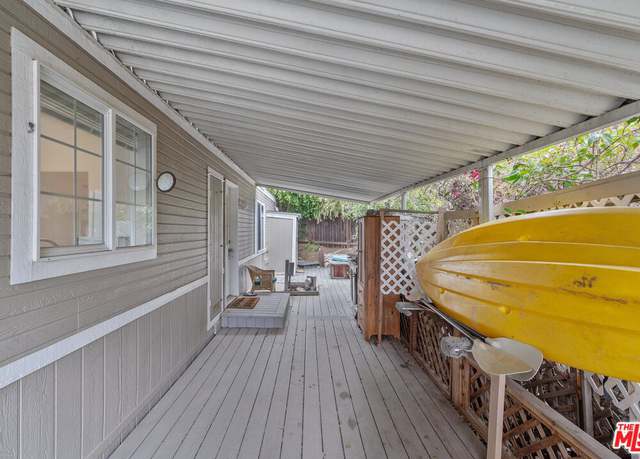
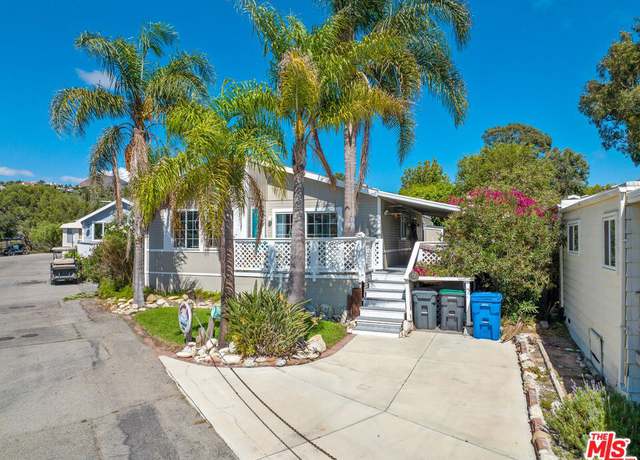
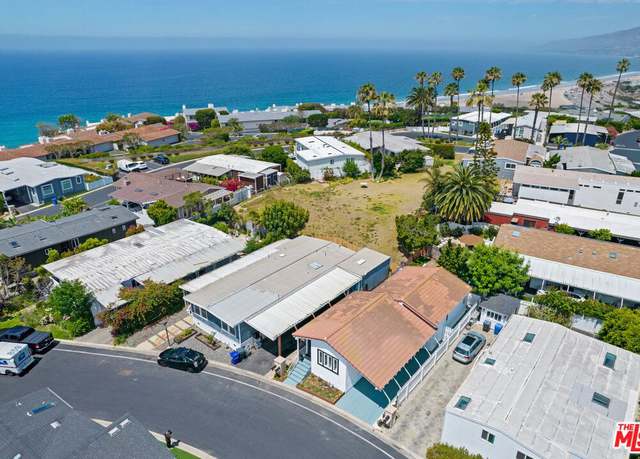
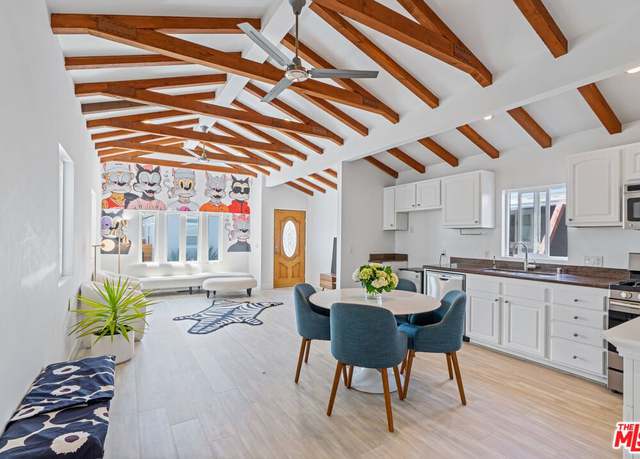
For Sale: Charming Oasis Mobile Home near Paradise Cove Beach Discover your own slice of paradise with this charming mobile home nestled next to the highly sought-after Paradise Cove Beach. Ideal for those seeking tranquility and coastal living, this cozy 1 bedroom, 1 bathroom home offers a perfect retreat. Key Features: 1 bedroom, 1 bathroom, ideal for singles or couples. Remodeled interior with modern finishes. Functional backyard providing ample space for storage and outdoor relaxation. Super low space rent, making coastal living affordable. Convenient 1 car parking space. Proximity to the renowned Paradise Cove Beach, perfect for beach lovers and outdoor enthusiasts. Great potential
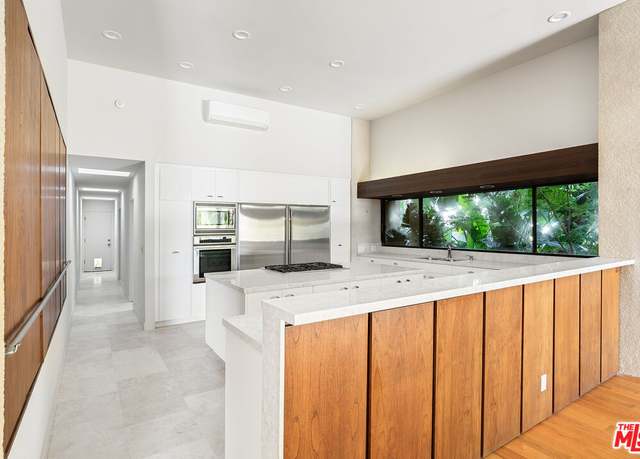
Presenting this recently constructed architectural masterpiece with head-on ocean views, breathtaking sunrises, and sunsets. Conveniently nestled in Sunset Mesa, the closest-in neighborhood of Malibu, it allows for easy access to Santa Monica, the Westside, and the freeways. Spanning 5,360 square feet with 4 bedrooms and 5 baths, the home offers sprawling entertaining spaces, including a vast living/dining/kitchen great room and a separate level for a media room, office, or more. Both spaces open to entire Queen's Necklace vistas and adjoining outdoor terraces. The spacious primary suite features a one-of-a-kind, custom 3D printed ceiling, private balcony, and spa-like bath. Crafted with se
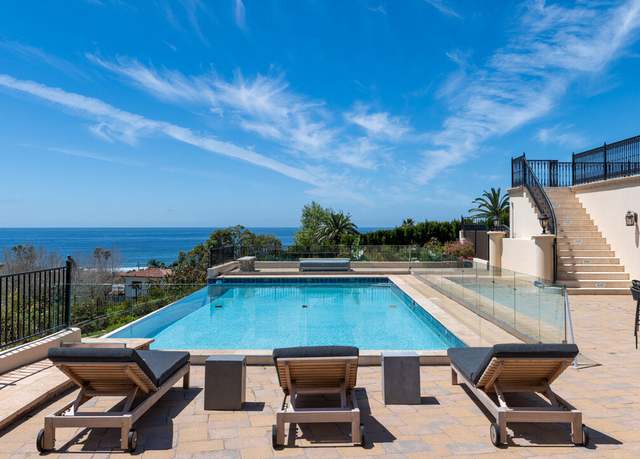
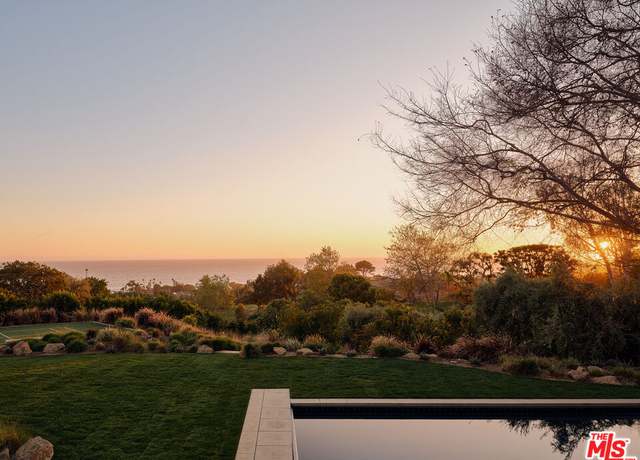
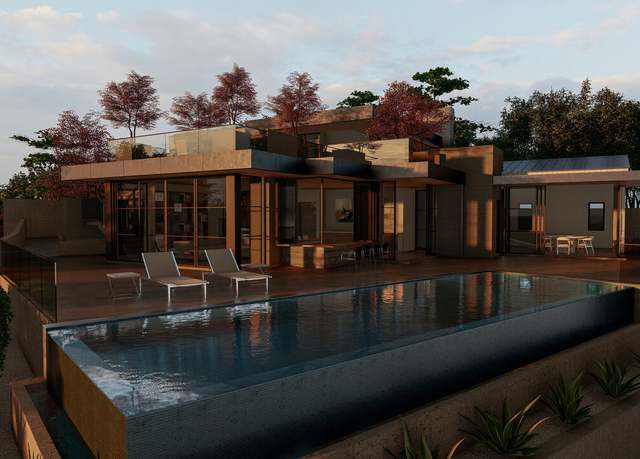
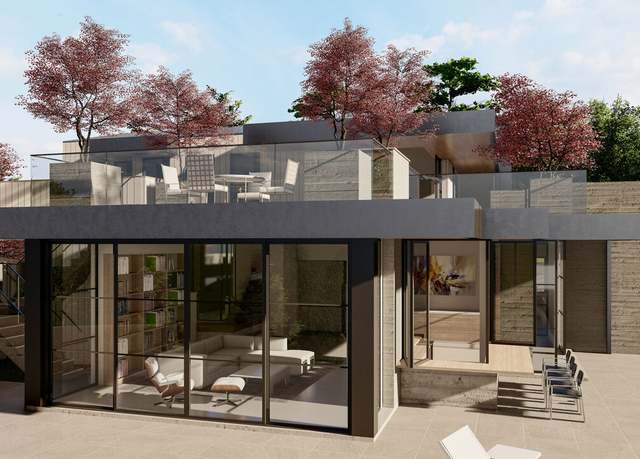
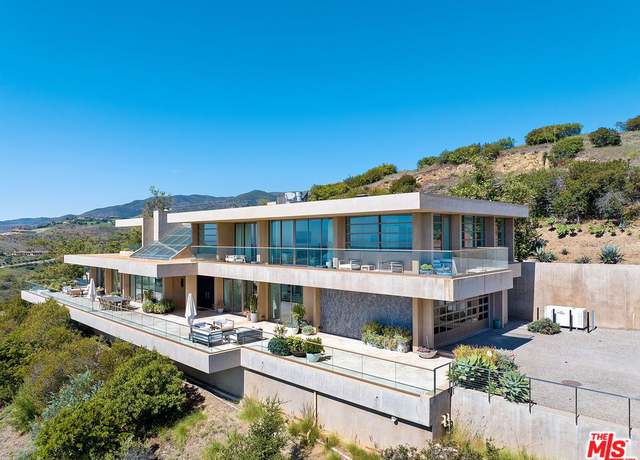
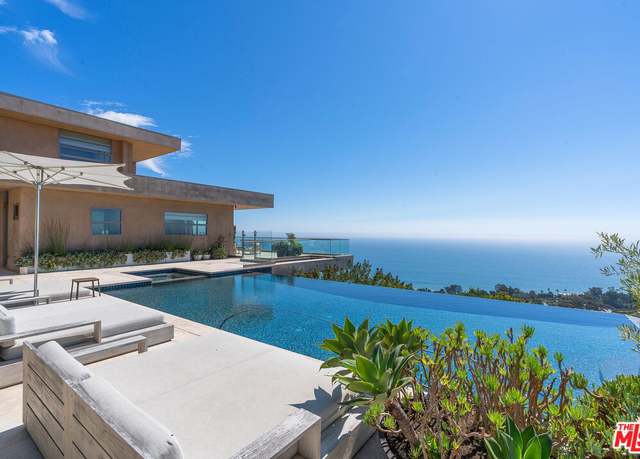
Nestled on a serene 2.8 acre bluff overlooking the Pacific Ocean, this architectural masterpiece epitomizes coastal luxury. Newly completed in 2023 and designed by renowned architect Steven Kent, this 5-bedroom, 5.5-bathroom residence offers unparalleled privacy and breathtaking ocean views. Step into sophistication as you're greeted by a meticulously crafted interior, where an expansive double-height living volume overlooks the spacious backyard entertainment area and infinity-edge pool. Floor-to-ceiling glass doors and windows seamlessly connect the indoor and outdoor spaces, allowing for effortless entertainment and relaxation. Architectural elegance abounds with board-formed concrete wa
New co-ownership opportunity: Own one-eighth of this turnkey home, professionally managed by Pacaso. The Pacific is front and center in this contemporary oceanfront home that maximizes the views and beach lifestyle. The living space features a dining area with banquette seating, a brick fireplace and bi-fold French doors that open to a cozy covered deck. The kitchen has stainless steel appliances, a double-drawer dishwasher and access to the 2-car garage. Skylights bring warm shafts of light throughout the second floor. The zen-like primary bedroom features bi-fold doors to a private balcony overlooking the ocean, a modern fireplace and an en suite bathroom with soaking tub, dual-sink vanit
School data is provided by GreatSchools, a nonprofit organization. Redfin recommends buyers and renters use GreatSchools information and ratings as a first step, and conduct their own investigation to determine their desired schools or school districts, including by contacting and visiting the schools themselves.Redfin does not endorse or guarantee this information. School service boundaries are intended to be used as a reference only; they may change and are not guaranteed to be accurate. To verify school enrollment eligibility, contact the school district directly.
Homes for sale in Malibu have a median listing price of $5.79M. Some of these homes are Hot Homes, meaning they're likely to sell quickly.
What are some of the most popular neighborhoods in Malibu?
Popular neighborhoods include Point Dume, Paradise Cove, Central Malibu, Malibu Colony, Malibu Park, Eastern Malibu, Malibu Beach, Zuma Canyon, Malibu Road, and Western Malibu.
How often does Redfin update their new listings?
Most of our new listings in Malibu are updated every 5 minutes so you can see new homes as soon as they come on the market. Learn more
What is transportation like in Malibu?
Malibu, California, is known for its scenic Pacific Coast Highway, which can be congested during peak hours due to the high volume of cars. Traffic levels can be heavy, especially during the summer months when tourists flock to the area. While Malibu does not have a comprehensive public transportation system, it is served by the Metro bus line. Additionally, the city is conveniently located near several major freeways, including the 101 Freeway, providing residents with easy access to surrounding areas. Learn more on our Malibu city guide.
What types of properties are available in Malibu?
Malibu, California offers a variety of single-family home types, including contemporary, modern, Mediterranean, and ranch-style homes, among others. These homes can be found throughout the different neighborhoods of Malibu, such as Malibu Colony, Point Dume, and Broad Beach. Most properties in Malibu, California feature multiple bedrooms and were built in various years. To explore different property types for sale in Malibu, California, use the 'Home type' filter located above the active listings. Customize your search by selecting options like single-family homes, condos, townhomes, and more.
What is life like in Malibu?
Living in Malibu, California offers a unique experience with its breathtaking coastal landscape. The region boasts a picturesque blend of mountains and ocean, creating a stunning backdrop for everyday life. The weather is consistently pleasant, with mild winters and warm summers, allowing residents to enjoy outdoor activities year-round. Job opportunities in Malibu are diverse, ranging from positions in the entertainment industry to local businesses catering to the community's needs. Residents can partake in a wide range of activities, such as hiking in the nearby Santa Monica Mountains, exploring local art galleries, or dining at the various high-quality restaurants in the area.
What are the schools and amenities like in Malibu?
Malibu, California offers a variety of public amenities to cater to the diverse needs of its residents. The city is home to several restaurants, providing a wide range of culinary experiences. Numerous parks are available for leisure and recreation, offering a breath of fresh air amidst the urban setting. For daily necessities, there are multiple grocery stores throughout the city. Additionally, the city provides other amenities such as libraries, fitness centers, and public beaches, enhancing the living experience in Malibu, California.
In the past month, 14 homes have been sold in Malibu. In addition to houses in Malibu, there were also 30 condos, 8 townhouses, and 1 multi-family unit for sale in Malibu last month. Find your dream home in Malibu using the tools above. Use filters to narrow your search by price, square feet, beds, and baths to find homes that fit your criteria. Our top-rated real estate agents in Malibu are local experts and are ready to answer your questions about properties, neighborhoods, schools, and the newest listings for sale in Malibu. Our Malibu real estate stats and trends will give you more information about home buying and selling trends in Malibu. If you're looking to sell your home in the Malibu area, our listing agents can help you get the best price. Redfin is redefining real estate and the home buying process in Malibu with industry-leading technology, full-service agents, and lower fees that provide a better value for Redfin buyers and sellers.


 REDFIN IS COMMITTED TO AND ABIDES BY THE FAIR HOUSING ACT AND EQUAL OPPORTUNITY ACT. READ REDFIN'S FAIR HOUSING POLICY AND THE NEW YORK STATE FAIR HOUSING NOTICE.
 United States
 Canada