Welcome to 3888 Delmont Avenue, where modern comfort meets classic charm! This 4-bed, 3-bath (plus office) home is a gem nestled in the upper Millsmont neighborhood of Oakland. With 2011 square feet of living space and a generous 6651 square foot lot, there's plenty of room to spread out and enjoy the California lifestyle. Step inside to discover a beautifully upgraded kitchen featuring stainless steel appliances, new countertops, hardware, and fixtures. The open layout seamlessly flows into the living areas, creating the perfect space for entertaining guests or simply relaxing with loved ones. Hardwood and tile floors add a touch of elegance throughout, while the entire home has been fresh
Foreclosure!!! Opportunity strikes in North Oakland! 5300 Genoa has been foreclosed by the bank and presents an opportunity for a savvy investor to come in, make repairs and end up with a really nice triplex! The unit that could be owner occupied is very large, with a ton of windows and natural light. The one bedroom and the studio will provide great monthly income to support the property. Detached two car garage, and an unpermitted addition all create more opportunity!!!
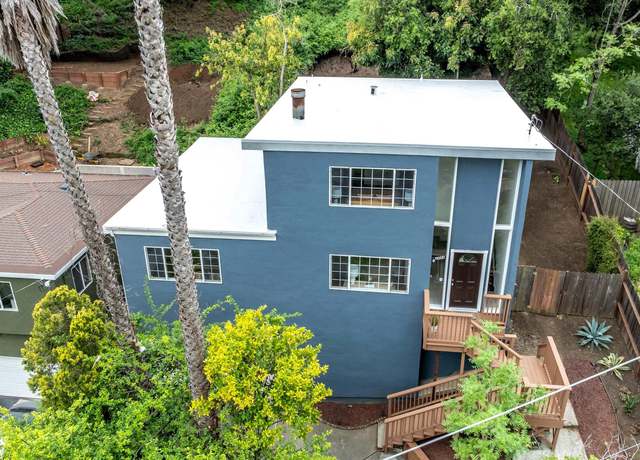
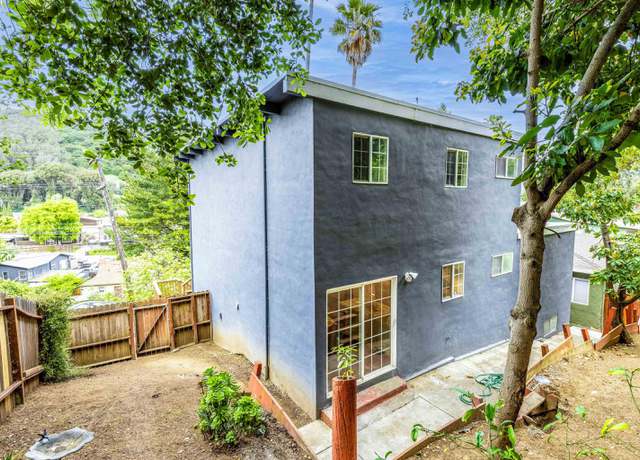
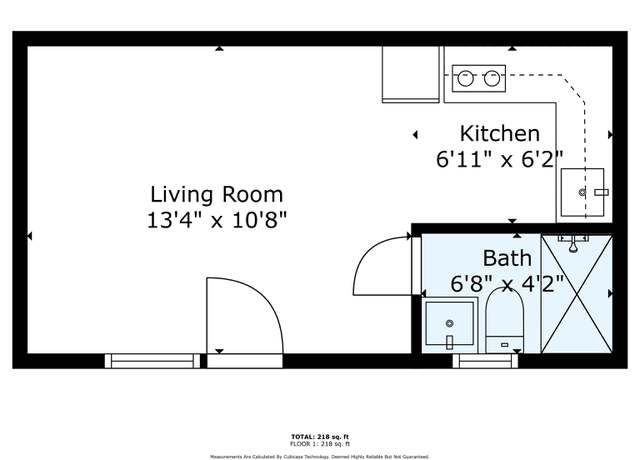
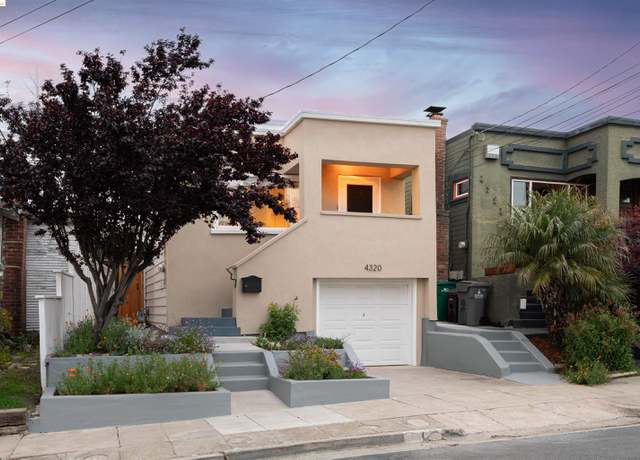
Welcome to 4320 Pampas Avenue, where classic charm and modern comforts feel like home. An inviting front porch leads into a sunny living room with stunning Bay views. Natural light abounds throughout. The open-concept kitchen features a breakfast bar and connects to the dining area and living room, creating an ideal space for entertaining. The spacious primary suite features a beautifully remodeled en-suite bathroom, ensuring privacy and relaxation. Head outside to a beautifully landscaped private back garden, complete with a trellis, patio, play area, and planter beds. Recent updates include a fully remodeled façade, recessed lighting, structural and seismic retrofit work, HVAC inst
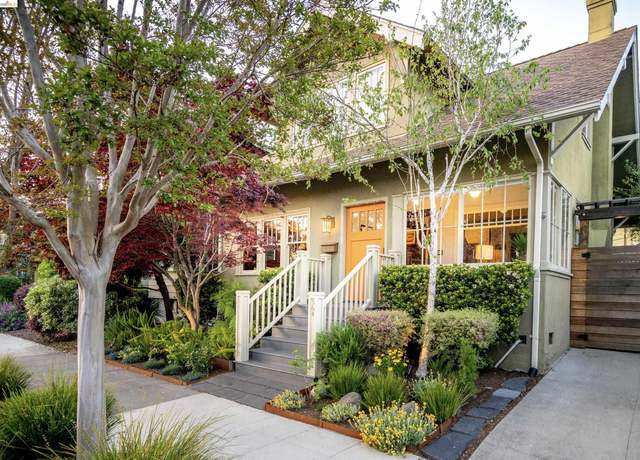
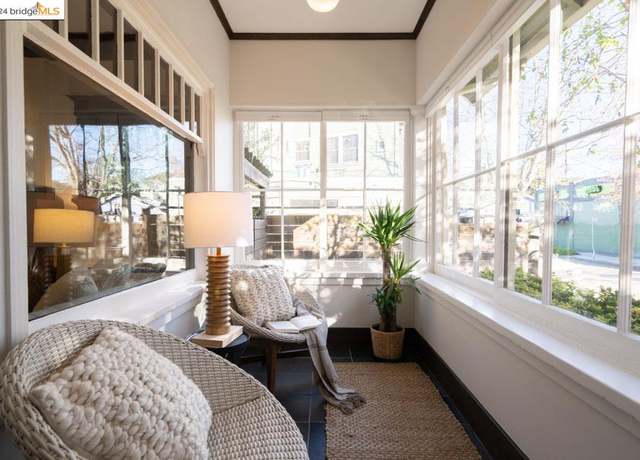
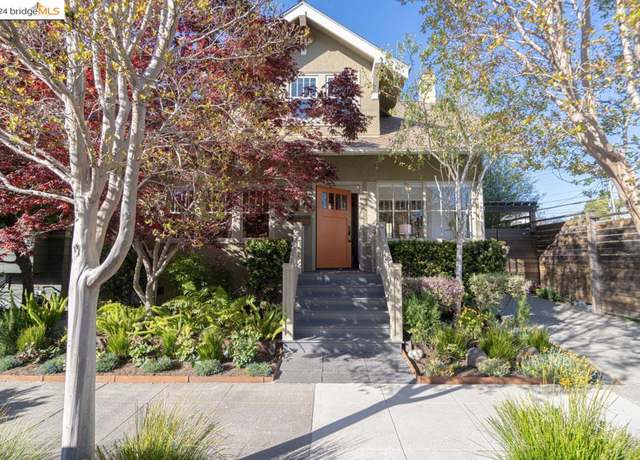
Nestled in the heart of Rockridge, 564 Forest St offers unparalleled access to all that College Avenue has to offer. Beautifully maintained and updated, this charming two-bedroom, one-and-a-half-bathroom residence epitomizes the timeless allure of Rockridge's craftsman architecture, evoking a sense of owning a piece of the neighborhood's rich history. Originally constructed in 1913, the home showcases meticulous attention to detail and exceptional craftsmanship. Inside, exquisite craftsman molding seamlessly connects the kitchen, living, and sunroom areas, boasting a vintage fireplace and original built-in cabinetry. The sunroom, adorned with craftsman casement windows, serves as a tranquil
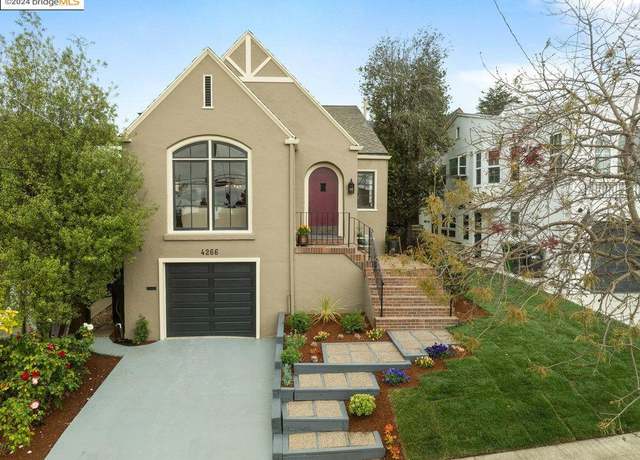
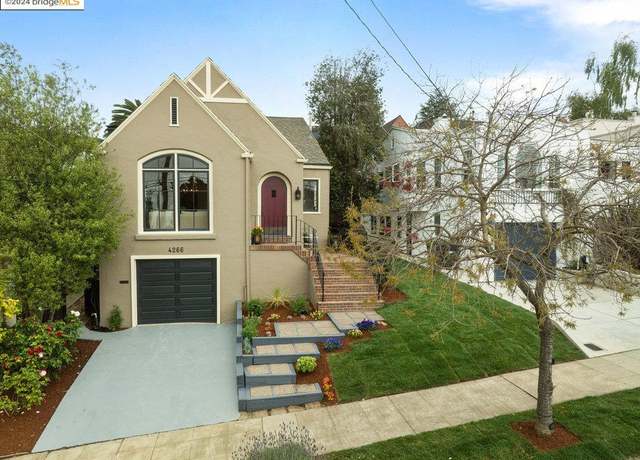
Sunny East Bay indoor-outdoor living - 1928 Redwood Heights Tudor with easy commutes, nearby amenities, curbside charm. Green lawn, fresh landscaping, brick porch, arched door with speakeasy peephole. Or enter through garage under house (2nd family room, laundry, workspace, plethora of storage, stairs up). Storybook details: h/w floors, real plaster, archways, built-in nooks, stained glass. Foyer to inviting, light-filled living room with arched picture window (peek-o’Bay view), tall plaster fireplace with niche, archway to stunning formal dining room. What everyone wants: Open-flow layout for entertaining or family fun in open airy kitchen flooded with light: chef’s desk, white
Rare Colonial Revival Compound! Discover a rare gem nestled between Oakland's vibrant Temescal and Rockridge neighborhoods. This beloved Colonial Revival home offers a unique urban oasis w/ multiple flexible spaces, ideal for modern living. Property is situated across from Bushrod Park, enjoy easy access to green spaces & recreational activities. Property has been currently used as a duplex w/ an additional studio, offering versatile living arrangements. Both units have been thoughtfully updated while retaining charming period details. Lower unit features a grand formal dining room, sunny living room, utility room, bedroom w/ vaulted ceilings, and a bathroom. Upper unit boasts abundan
Gorgeous Hill & Valley views from this beautifully updated 1,818 sq ft ranch style 3 bed, 2 bath home, situated in Chabot Park Estates on a 1.01 acre sprawling lot that sits back from the road w/ plenty of off street parking. Once inside, you will find an open living concept w/ living & dining area w/ doors to the patio & yard, updated kitchen w/ eating area, stainless appliances, side door to patio & door to the oversized garage. Primary bedroom w/ updated bath w/ shower, new mirror, vanity w/ quarts counter top & flooring. Hall bath w/ shower over tub, new vanity w/ quartz counter top & mirror. There are also 2 good sized additional bedrooms. Step outsi
This spacious 1925 charmer boasts 3 bedrooms and 2 bathrooms. Flooded with natural light, this home showcases hardwood floors, dual pane windows, and a generously sized kitchen with granite countertops. Additional features include a laundry room and porch area. Outside, the private yard is fully fenced and features mature vegetation, along with a detached one-car garage and off-street parking for multiple cars. Situated in the Havenscourt neighborhood of Oakland, this property offers both comfort and convenience.
Discover the potential of 169 Sheridan Rd! This promising property awaits savvy investors ready to embark on a new project without the hassle of building from scratch. With neighboring homes fetching prices in the upper 2 million dollar range, the value proposition here is undeniable! Spanning four stories and boasting nearly 3,000 sqft on a 6,000 sqft lot, this unfinished gem offers panoramic views from every level. Don't miss out on this prime opportunity!
Live in the heart of Oakland's Chinatown in the Pacific Renaissance Plaza. Remodeled unit with new luxury vinyl plank flooring, new paint and new stainless steel appliances. Easy access to shopping, dinning & services such as banking/doctor/dentist/legal. Below market rate condo. Unit faces courtyard. Near 12th BART & public trans. Common courtyard, 24 hour security, 1 parking space deeded. Must be income qualified to purchase at PacRen BMR.
Welcome to 171 Sheridan Rd nestled within the serene hills of Oakland. This remarkable 4-story, 5-bedroom, 5-bathroom residence offers breathtaking views from every level, promising to leave a lasting impression on your loved ones. With its construction nearly complete and offered at an exceptionally reasonable price, this home presents an irresistible opportunity for those seeking to balance affordability with luxury living in the hills. Furthermore, its customizable interior design options ensure that you can tailor the space to suit your unique preferences, while also securing a sound investment for the future. Spanning almost 3,000 square feet and occupying a generous lot size of 6,000
52 Glen Alpine is an exquisite English County Tudor estate property offering an extraordinary combination of breathtaking craftsmanship, European influenced style, elegant and gracious spaces, wonderful indoor/outdoor living and compelling possibilities. Architecturally stunning, as you enter in the dramatic foyer, you are welcomed by generous formal rooms, a stunning hand-carved floating staircase, custom decorating plaster ceilings, and beautiful two-story leaded glass windows providing natural light and warmth. Ideally sited on a . 69 acre lot spanning the entire distance between two streets in a quiet and coveted Piedmont location, outdoor amenities include mature landscaping, majestic
Versatile RM-3/C Zoning: Whether you envision residential, commercial, or a dynamic blend of both, the flexible zoning sets the stage for multiple possibilities. Current Dual Residential Unit Configuration: Embrace flexibility with two distinct residential units, offering the ideal setup for multi-generational living, rental income, or a live-and-work scenario. (Currently used as 2 residential units with one unit vacant). Radiant Updated Ambiance: Bask in the renovated and updated atmosphere of light and bright light-filled interiors, creating an inviting and inspiring environment for living, working, or both. Convenient Off-Street Parking: Say goodbye to parking woes with dedicated gated o
1215 Alvarado Rd, is the last home built by the renowned Berkeley Hills builder, Hopkins/Palmer & Associates. This is a custom home with craftsman touches, has soft colors & high quality finishes. 5 BDs plus den, family & media room. Possible in-law set-up. Expansive Claremont Canyon views. Living room balcony some bay views. Primary suite has a fireplace, attached workout room/large walk in closet. Bathroom has a large soaking tub with jets and a large separate shower. Home has ample storage, privacy and elegance with a central location.
Updated 2 bedroom 2 full bathrooms, new interior paint, windows and flooring. Remodeled kitchen with modern finishes, open floor plan with an abundance of light. Newer composition roof and Furnace! Long gated driveway for parking. Low maintenance yards, detached storage/shed with lots of possibilities. Conveniently located near public transportation & Bart.
This charming 2+BR/1BA Mediterranean Bungalow is located in the heart of the vibrant Lower Dimond District. This exceptional home has been thoughtfully updated and offers an all level floor plan. The cozy living room has refinished hardwood floors and a lovely brick fireplace. The living room flows into a well-lit formal dining area. Adjoining this area is the recently updated cook's kitchen with stainless steel appliances, Heath tile backsplash and quartz counters. A laundry area is off the kitchen as well. The two sunny bedrooms have roomy closets and share an updated bathroom. An additional room can be used as an office/den or bedroom as it has a custom closet. A partially finished basem
Welcome to a remarkable West Oakland investment - a Victorian home and backyard cottage offering versatile prospects. Set amidst the area's historical tapestry, this property blends timeless charm with modern allure. Its proximity to transit, parks, and local eateries creates a delightful fusion of convenience and exploration. Use it as a retreat, event hub, or rental - its adaptability is its strength. New in-law unit included in lower level buildout. Street-level access and an automatic gate enhance its appeal, offering a ready-to-move-in option or the chance to tailor your dream space. An Auxiliary Dwelling Unit (ADU) in the backyard expands possibilities. Generate rental income or creat
155 Pearl Street: Completely remodeled Top Floor corner unit is a 2 bedroom 2 bath condo located in the highly desirable Adams Point neighborhood. This unit boasts a warm welcoming space that has a tan laminate flooring throughout and an upgraded gas fireplace for added comfort and style in the main living area. Enjoy preparing meals in this impressively remodeled kitchen with quartz countertops, large peninsula, and all stainless steel appliances. The main bedroom is spacious and has a walk-in closet. Also includes a private balcony for relaxing fresh air. The building includes private courtyard, Washer/dryer on site, and gated garage that includes a parking spot for the owner. The desirab
Nestled in the serene enclave of Montclair, this one-of-a-kind home offers an idyllic retreat amidst nature's embrace. Adorned with charming brown shingles that harmonize with the surrounding landscape, this residence exudes warmth and character from the moment you arrive. The interior boasts bamboo floors and vaulted ceilings which lend to an airy atmosphere. The home features a generous primary suite complete with a spacious walk-in closet and an en-suite full bath. The living room boasts a large fireplace, an office nook and a loft. A two-car garage provides ample space for your vehicles and the basement offers a laundry area with sink and abundant storage space. Stepping outside onto th
Charming and newly remodeled, this inviting home in Oakland offers a perfect blend of comfort and modern style. Boasting 3 bedrooms and 2 bathrooms, it's ideal for a growing family seeking a move-in ready residence. Step inside to discover a freshly updated interior featuring contemporary finishes throughout. With its recent renovations and family-friendly layout, this home is ready to welcome its new owners into the vibrant Oakland community. Don't miss out on this opportunity to own a beautifully updated residence in a prime location!
The Essex is a Luxurious & Sophisticated Condominium on the shores of Lake Merritt in Oakland. Enjoy the comforts of an urban vibe and effortless lifestyle - conveniently located by Lake Merritt’s natural surroundings and downtown Oakland’s dining and boutique shops. This stunning 1-bedroom, 1-bathroom, plus flex-space (office/den) with new LVP flooring, new carpet, new kitchen appliances, and new paint. Corner unit with no neighbors on one side, bright, and quiet unit with a living room balcony with direct views of Lake Merritt, pool, Oakland downtown and hills. 1 parking space in a secured garage, HOA amenities: 24/7 lobby front desk; Pool; Spa; Fitness Center; Library;
Absolutely stunning TWO detached homes featuring ALL new Kitchens with SS appliances New baths, New windows, flooring, lighting, doors, heating, Completely painted interior and exterior. Landscaped. Perfect for a large family. Live in either house. The beauty is that it's in perfect condition and all vacant. Choose your own occupants! Sewer lateral paid by Seller! Model condition! So much real estate for this price!
Owned by the same family for 5 decades, 6070 Rockridge Boulevard is a stately prairie-style home with preserved woodwork, built-ins, large rooms, and brilliant natural light. Bask in the luminous living room, dining room, and expansive sun-drenched primary suite with slices of Bay view, savor a moment of solitude on the covered front porch, and retreat to the covered cozy rear patio with lights, and an outdoor shower on a hot summer's night. The main floor has a large living room, formal dining room, eat-in kitchen, 2 bedrooms, and an updated bathroom. There are three access points to the backyard: off the kitchen, conveniently off the hall bathroom, and off the garage/workshop. Owned by a
Welcome to The Phoenix Lofts, where urban sophistication meets Oakland's vibrant energy. Step into luxury living with this stunning loft-style condo nestled near Jack London Square. This unit features a contemporary aesthetic with high ceilings, newly refinished hardwood floors and ample natural light, illuminating the open-concept layout and highlighting the sleek finishes throughout. One of the true gems of this residence is the exclusive rooftop patio, offering views of the Oakland skyline. Experience the best of urban living at The Phoenix Lofts. With its prime location near Jack London Square, you'll have easy access to freeways, public transportation (West Oakland BART is less than on
Come and see this lovely move-in ready home! This home is light and airy throughout and features new light fixtures and new laminate floors with generous living and dining room spaces that seamlessly flow into the kitchen for easy entertaining. New stainless steel appliances and quartz countertops accentuate the well-designed space. You’ll be located just minutes away from the freeway, shopping, & restaurants. Don’t miss out on this one!
Rare duplex in the heart of the Upper Laurel neighborhood. Total SQFT 1751, 2 spacious garage and full basement for storage- 1245 sq ft (appraisal). Ideal for owner occupied buyers with extended families. Or live in one and/or get income from the other unit. Front Unit 1 BR/1BA. Back unit 2 BR/1BA, spacious living/dinning combo. Freshly painted, new living room flooring, remodeled kitchen. Large backyard with fruit trees and a possibility of ADU, check with City of Oakland. Very convenient location. Easy access to HYW 580/13 . Closed to pubic transportation, shops and schools. Redwood Regional Park is just a few minutes away.
This renovated 3-bedroom, 2-bathroom home is designed for modern living. The updated kitchen boasts new appliances and countertops, flowing into a spacious backyard patio. A detached garage provides flexibility for a home office or workshop, along with a long driveway for multiple off-street parking spots. New flooring throughout and renovated bathrooms add a touch of style and functionality. Conveniently located near the freeway, this home offers easy access to amenities, making it ideal for comfortable living.
OH 4/27/28 2-4PM. This bright, clean, & cheery condo lives more like a townhouse in this 3-unit community. The “upside down floor plan” provides 2-bedrooms, 2-full bathrooms & the in-unit laundry on the ground floor. Upstairs is your open concept living space with a generously sized, great room that includes a dining area, refreshed kitchen, 1/2 bath & a deck on the sunny side of the home. There’s a wood-burning stone, fireplace in the living room & a kitchen with a dishwasher & both a new stove & new refrigerator. More updates throughout the home include new flooring, LED light fixtures, fresh paint, new faucets, & a new vanity. The
Fantastic investment opportunity! This property consists of three units across two buildings. One unit is currently vacant. The total rental income is $4,660 per month. Each unit has its own PG & E and water meters, with the owner responsible only for garbage. The property also features a one-car garage and ample driveway parking. Near shops and BART station. Easy free way access.
Calling all house hackers! Nestled in the vibrant heart of Oakland, this duplex presents an incredible opportunity. Each unit boasts its own one-car garage, washer/dryer, ample storage, and a generous low maintenance backyard, perfect for unwinding or hosting gatherings. Unit 5330 welcomes you with a cozy one-bedroom, one-bathroom layout featuring charming wood flooring hidden beneath the carpet. A generously sized living room with a wood-burning fireplace and an inviting eat-in kitchen enhance its cozy ambiance. The bedroom and bathroom offer ample space for comfortable living. In contrast, Unit 5332 dazzles with its fully remodeled interior (2021), boasting laminate flooring, fresh paint,
This centrally located 3 bedroom 1 Bath home with updated features has a lot of potential. Newly updated with fresh textured walls, interior paint, linoleum flooring, kitchen cabinets and backsplash. The detached garage can be used for a vehicle or an opportunity for an addition. Come view this GEM!
WOW!!! Diamond in the rough! Prime Location 3520 Harrison St. deserves your undivided attention! This unforgettable Home, nestled between other beautiful nostalgic homes, has so much potential and great square footage. This could be added to your investor portfolio or you just might want to live in it and DIY! This unique treasure exudes old world charm which could tastefully be restored or put your own spin on it and create a modern space for urban living. There are endless possibilities here! You have Grand Lake area nearby as well as the popular Piedmont Avenue for shopping and dining. Close to transportation and Kaiser! You really need to come visit this one to appreciate all that it
Nice top floor unit features one bed and one bath. Unit has an updated kitchen with granite counters and cabinets. Spacious bedroom with three closets. The building is walking distance to Whole Food, Lake Merritt, restaurants and many more. Close to 580 access and other transportation too.
The historic Clausen building located in the Rockridge-Temescal District presents an opportunity for development into a 5 multi-family building - four condos and one live|work space. The previous developer repurposed and redesigned the interior floorplans|framing to fit the needs of the new condo units. The building has a solid foundation and structure. However, certain modifications will need to be made to meet building and zoning code requirements and to accommodate individual units, including the installation of plumbing, electrical, and HVAC systems. Here is your opportunity to finish what the prior developer had started. Original architect plans are available upon request. Ideal for de
A delightful home occupied by a long-term tenant, bathed in natural light from every direction. Features include an eat-in kitchen, laundry hookups, a single-car garage with additional tandem parking, and a backyard perfect for entertaining.
The front house boasts original charm with its unique features. An enclosed front porch leads into an expansive living and dining area. Bedrooms are well-lit by natural light. The galley kitchen is complemented by a separate laundry room with hookups. A grassy front yard and a cement patio that doubles as a parking space lie between the houses. The rear house features a vaulted ceiling in the living room with a decorative beam, alongside a dining space that opens to the kitchen, which includes a laundry area. It offers luminous bedrooms, a full bathroom, and a small, fenced backyard perfect for entertaining and container gardening.
Welcome to this Charming home. It's located on the good location Just full updated about few years ago: Kitchen with quartz counters , new design inspired cabinets, new stainless sink and appliances ; excellent new bathroom; Well take care . Excellent tenants ; income $3,500 monthly. Tenants pay all utilities Garage converted to 1 bedroom permit unknown Convenience location , near shopping, dining, restaurant, recreation , minutes to freeway and much more. .. It's wont be last long ; The must see property ; Excellent opportunity for new owners and investors. Seller has the right to accept or refuse any offer. Buyers are strongly to do any investigate if wanted Seller prefer " As Is&qu
Built in 1898 this home now has approved plans from the City of Oakland to take it through the next 125 years. New plans expand the main house into the attic, and convert the basement space into an attached ADU. Main floor of the house includes: living room, office, kitchen, dining room, 2 bedrooms, 1.5 bathrooms. Upper level is the primary bedroom, en-suite bathroom, den, exercise room, laundry, and a patio with a sunset view. ADU has 2 bedrooms, 1 bathroom, living area, kitchen, and private laundry. An additional office space/flex room is also on this level.
5817 Florence Terrace beckons you with its charm. Step onto the sunny front porch as you enter this exquisite home. Recently remodeled with sophisticated designer touches and meticulous attention to detail, it offers a bright kitchen featuring top-of-the-line stainless-steel Bosch and Miele appliances, a farmhouse sink, and a cozy breakfast nook surrounded by windows to bathe the space in natural light. With thoughtfully placed windows and wide plank hardwood floors, this home seamlessly blends classic and modern styles. The primary bedroom boasts French doors leading to a serene balcony, a stylish ensuite bathroom, and a spacious walk-in closet. With 3 beds, 2 baths, and approximately 2176
This area's enrollment policy is not based solely on geography. Please check the school district website for more information.
Elementary schools
Middle schools
High schools
GreatSchools Summary Rating
9/10
Lincoln Elementary School
Public, K-5 • Choice school
9/10
Camino Pablo Elementary School
Public, K-5
9/10
Edison Elementary School
Public, K-5
9/10
Beach Elementary School
Public, K-5
8/10
Donald L. Rheem Elementary School
Public, K-5
Only showing 5 of
100+ elementary schools.
School data is provided by GreatSchools, a nonprofit organization. Redfin recommends buyers and renters use GreatSchools information and ratings as a first step, and conduct their own investigation to determine their desired schools or school districts, including by contacting and visiting the schools themselves.Redfin does not endorse or guarantee this information. School service boundaries are intended to be used as a reference only; they may change and are not guaranteed to be accurate. To verify school enrollment eligibility, contact the school district directly.
Homes for sale in Oakland have a median listing price of $757K. Some of these homes are Hot Homes, meaning they're likely to sell quickly.
What are some of the most popular neighborhoods in Oakland?
Popular neighborhoods include Glenview, Crocker Highlands, Montclair, North Berkeley, Bay Farm Island, West Oakland, Oakmore, North Oakland, Upper Rockridge, and Temescal.
Oakland, California boasts a comprehensive transportation network, with a variety of options for getting around the city. The city experiences moderate to heavy traffic, particularly during rush hours, making driving a car a potentially time-consuming choice. Public transportation is readily available, with services like buses and the Bay Area Rapid Transit (BART) system serving the city and its suburbs. Oakland is also well-connected to other parts of California and beyond, with several major highways and freeways, such as Interstate 880 and 580, running through the city. Learn more on our Oakland city guide.
What types of properties are available in Oakland?
Oakland, California offers a variety of single-family home types, including ranch-style, bungalow-style, and contemporary-style homes. These homes can be found throughout Oakland, with ranch-style homes commonly found in neighborhoods like Montclair and Redwood Heights, bungalow-style homes in areas like Rockridge and Temescal, and contemporary-style homes scattered throughout the city. Most properties feature two to four bedrooms and were built between the 1920s and 1960s. To explore different property types for sale in Oakland, California, use the 'Home type' filter located above the active listings. Customize your search by selecting options like single-family homes, condos, townhomes, and more.
What is life like in Oakland?
Living in Oakland, California offers a vibrant urban experience with a variety of neighborhoods and cultures. The landscape is characterized by a mix of city streets, parks, and hills, providing diverse scenery. The weather is generally mild, with cool summers and mild winters. Job opportunities in Oakland are abundant, with a thriving tech sector, creative industries, and a strong local economy. Residents can enjoy a wide range of activities, including exploring local markets, enjoying outdoor festivals, and immersing themselves in the city's rich arts and music scene.
What are the schools and amenities like in Oakland?
Oakland, California, boasts a vibrant array of public amenities for its residents. You'll find a wide selection of restaurants offering diverse cuisines to satisfy your palate. Numerous parks are scattered throughout the city, providing green spaces for relaxation and recreation. Grocery stores are conveniently located across the city, ensuring easy access to daily necessities. Additionally, Oakland offers more amenities such as libraries, gyms, and community centers to cater to various interests and needs.
In the past month, 227 homes have been sold in Oakland. In addition to houses in Oakland, there were also 215 condos, 23 townhouses, and 162 multi-family units for sale in Oakland last month. Oakland is a fairly walkable city in Alameda County with a Walk Score of 75. Oakland is home to approximately 390,816 people and 197,279 jobs. Find your dream home in Oakland using the tools above. Use filters to narrow your search by price, square feet, beds, and baths to find homes that fit your criteria. Our top-rated real estate agents in Oakland are local experts and are ready to answer your questions about properties, neighborhoods, schools, and the newest listings for sale in Oakland. Our Oakland real estate stats and trends will give you more information about home buying and selling trends in Oakland. If you're looking to sell your home in the Oakland area, our listing agents can help you get the best price. Redfin is redefining real estate and the home buying process in Oakland with industry-leading technology, full-service agents, and lower fees that provide a better value for Redfin buyers and sellers.


 REDFIN IS COMMITTED TO AND ABIDES BY THE FAIR HOUSING ACT AND EQUAL OPPORTUNITY ACT. READ REDFIN'S FAIR HOUSING POLICY AND THE NEW YORK STATE FAIR HOUSING NOTICE.
 United States
 Canada