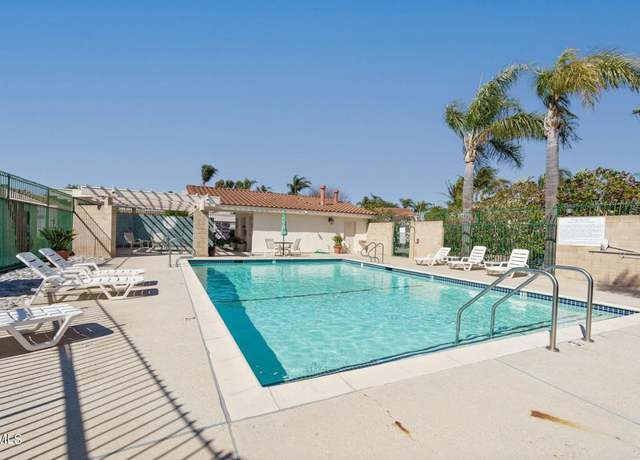
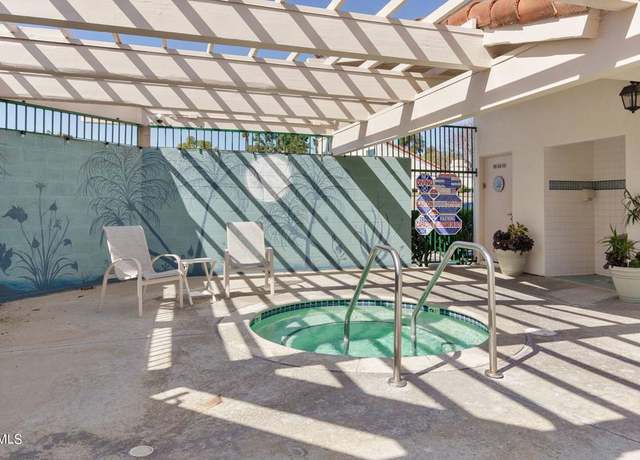
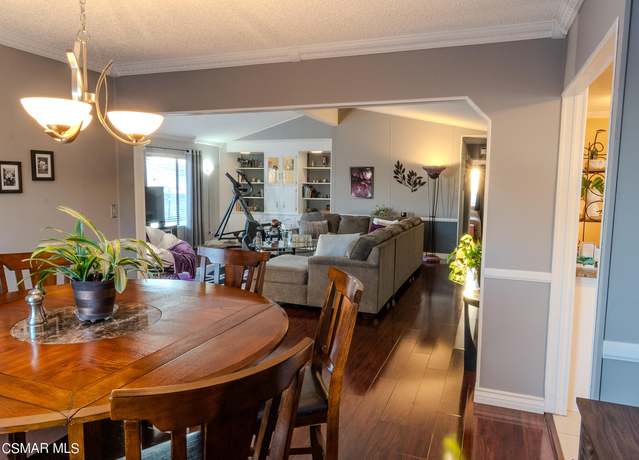
This beautiful single level condominium is a must see!! Situated on the ground floor, this unit offers highly sought after direct garage access. The home is beautifully appointed with laminate flooring, crown molding throughout, a modern kitchen with top of the line appliances, and a huge deck with views of a private cove as well as the main channel. The home also offers a tankless water heat as well as a whole house magnetic water softening system. Nestled behind elegant security gates, the community offers a pool, spa and clubhouse with regular community events. Come take a look, you won't be disappointed!
Nestled within the coveted Hueneme Bay Community is this stunning 3 bedroom 2 bath home boosting 1,300 sq. ft. of living space. Kitchen with upgraded cabinetry pullouts, soft closing drawers and brushed nickel hardware, Breakfast bar, Plantation Shutters, Samsung Refrigerator, Farm Style Sink, Stone Counters, Tiled Back-Splash, Built-In Microwave & Electric Range/Oven. The home has wood-like plank flooring throughout, Plantation Shutters, Drapery, Dual Glazed Windows, Raised panel doors and recessed lighting. The open concept dining and living room lead to a large private patio. A spacious primary bedroom has a large wall-to-wall custom closet with BiFold doors and plantation shutters
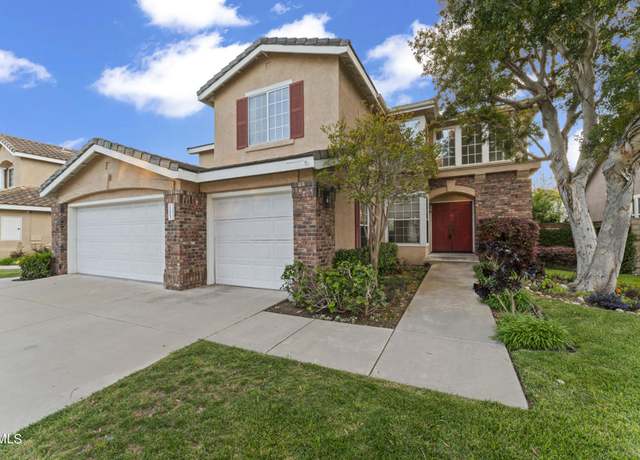
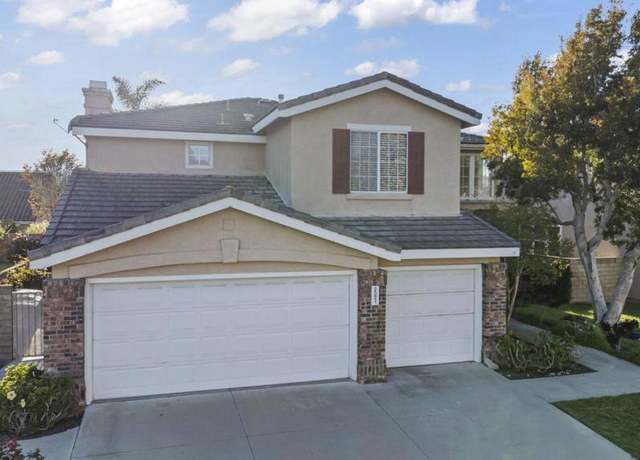
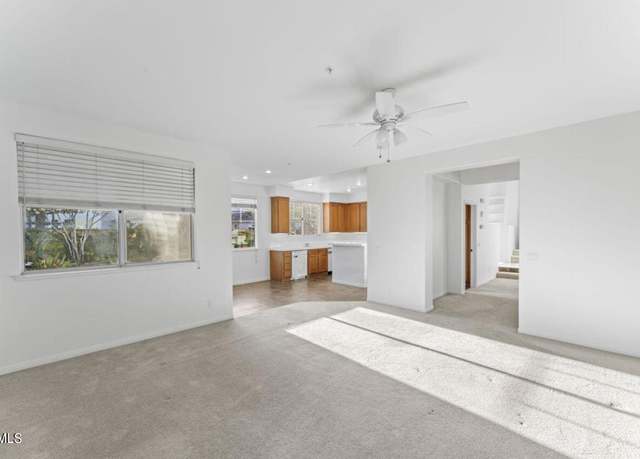
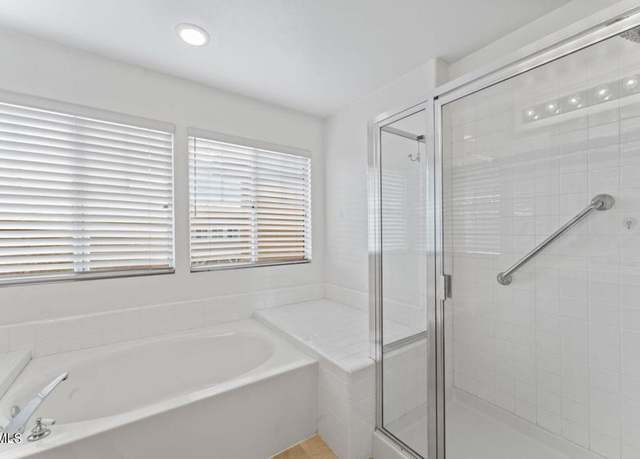
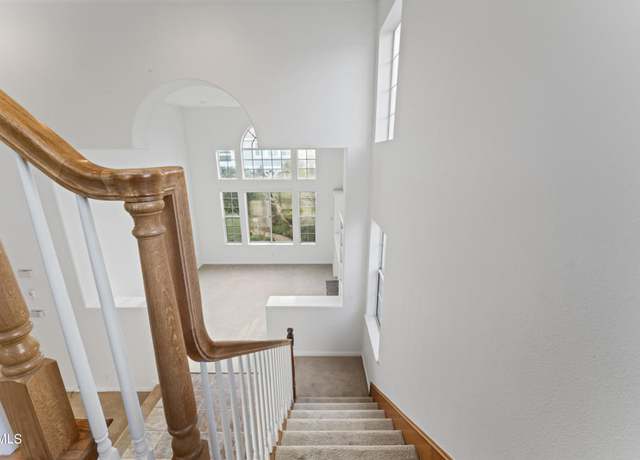
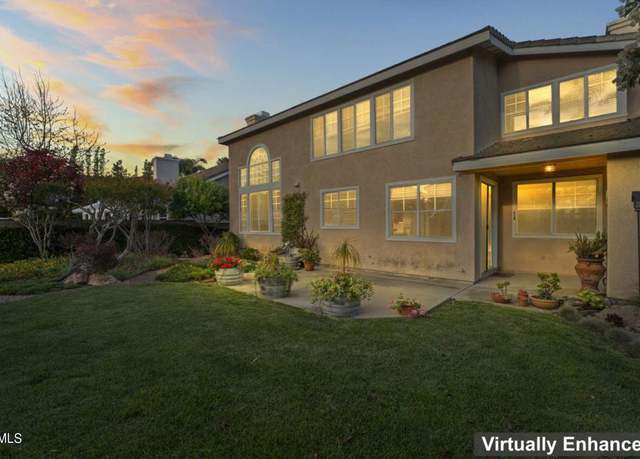
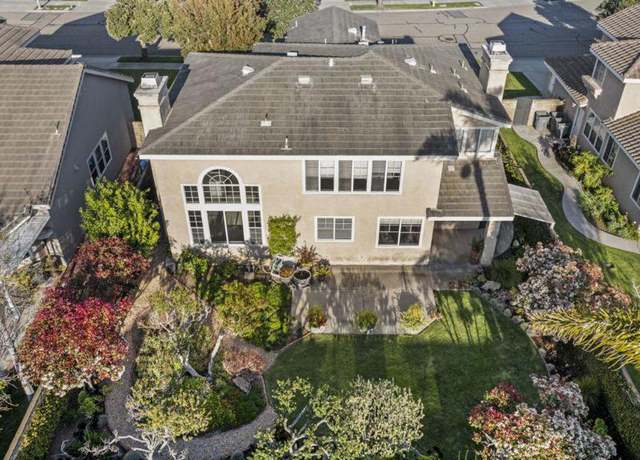
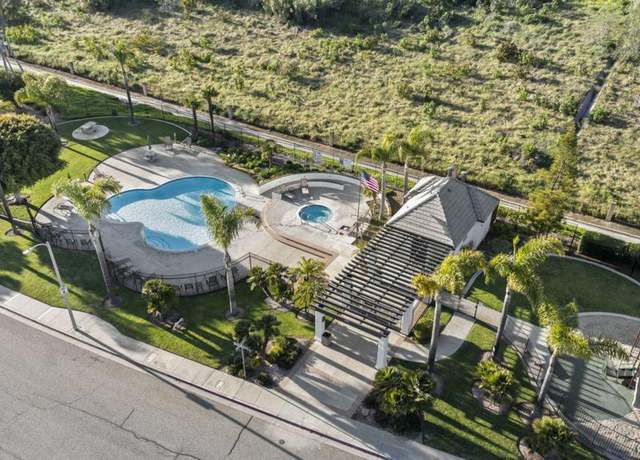
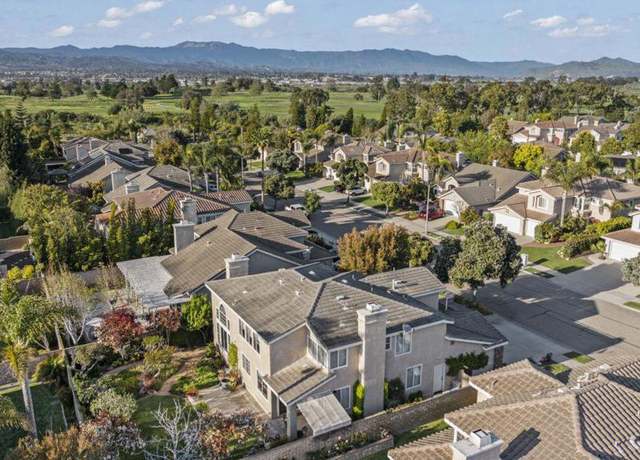
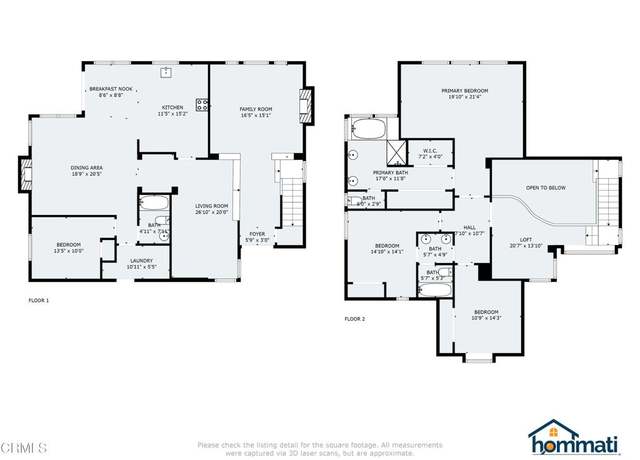
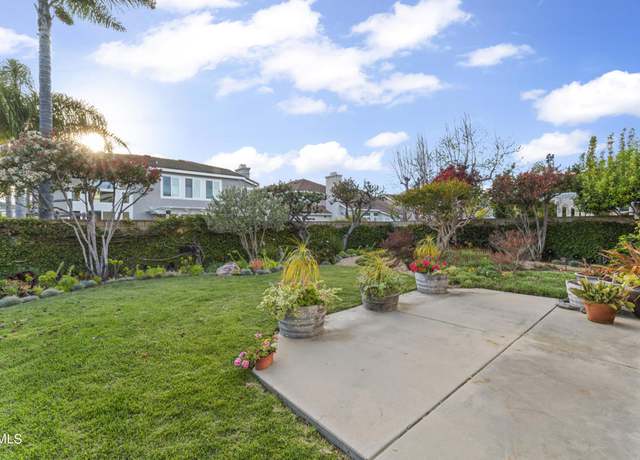
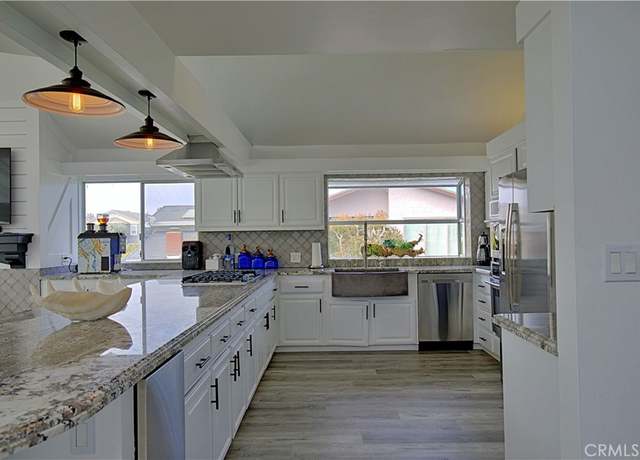
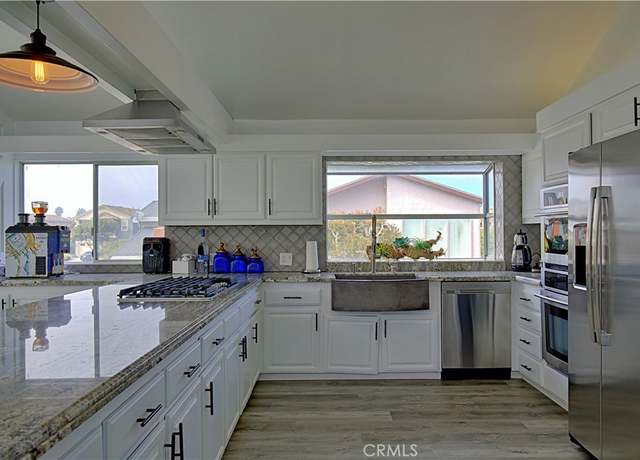
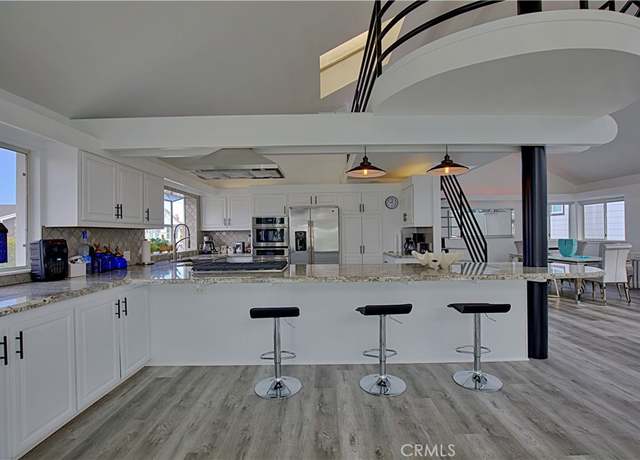
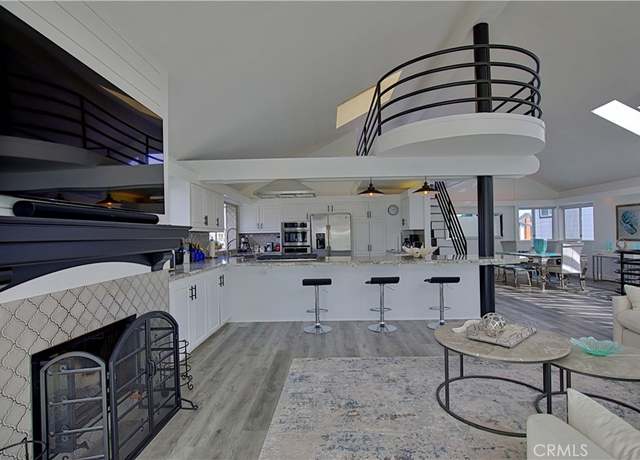
Stunning Cypress Point corner home on an over 9,000 square foot lot! As you enter the living room is open and inviting with a formal dining area. There is also a family room with a custom ship-lap fireplace surround and a new contemporary fireplace insert. The kitchen has been remodeled with new appliances, new cabinets, and marble counters. This model also features a first-floor primary bedroom with a beautifully remodeled en suite that offers a large soaking tub, separate shower, and beautiful double floating vanity. Stunning hardwood flooring throughout. Custom stairs and stair railing lead to the three bedrooms, loft, and large remodeled bathroom upstairs. There is a half bath downstair
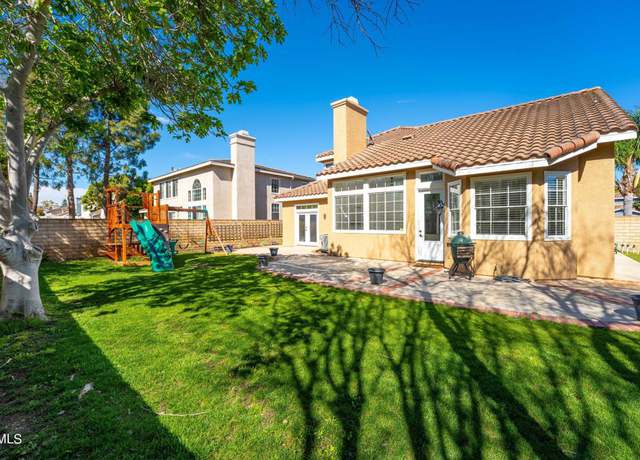
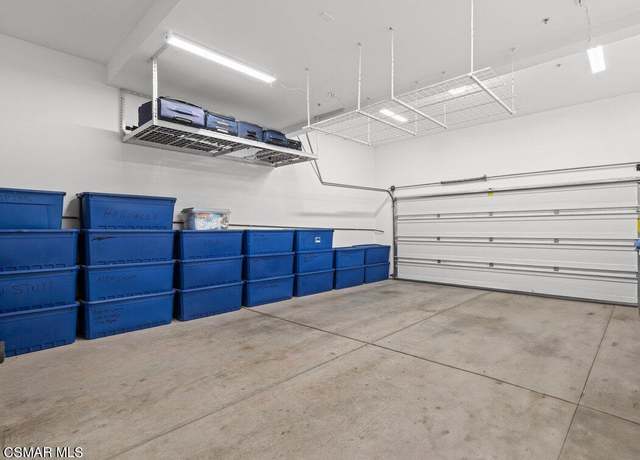
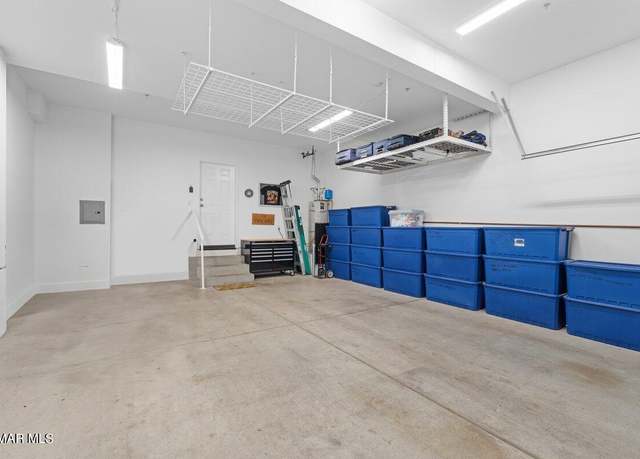
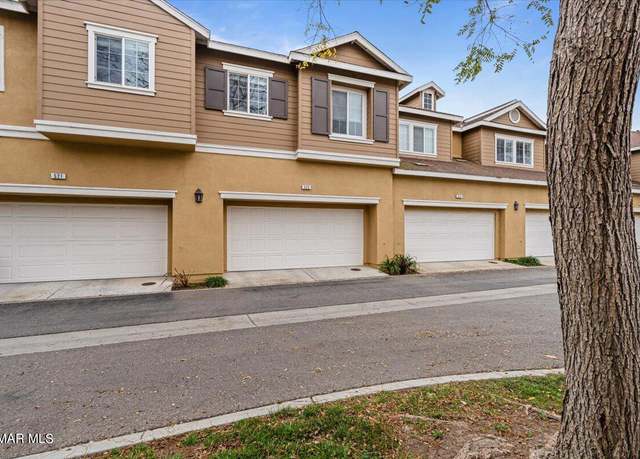
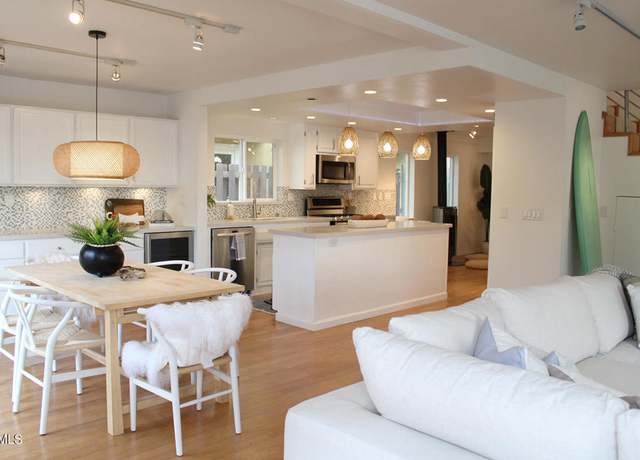
It's good to be home! This 4 bedroom, 3 bath 2100+ square foot home has it all. Enter through the double doors to the oversized, vaulted ceiling living room, downstairs - 1 bedroom, full bath, laundry, kitchen with high end appliances and a family room with fireplace and bar. Make your way up the stairs to the primary bedroom and en - suite and 2 more large bedrooms. The 3-car garage has abundant storage with access to the back yard. This desirable North Oxnard neighborhood is conveniently located close to schools, shopping and is easily accessible to the 101 freeway. Minutes to the great shopping, beautiful beaches, golf, parks and more. This home is comfortable, cozy and bright, with very
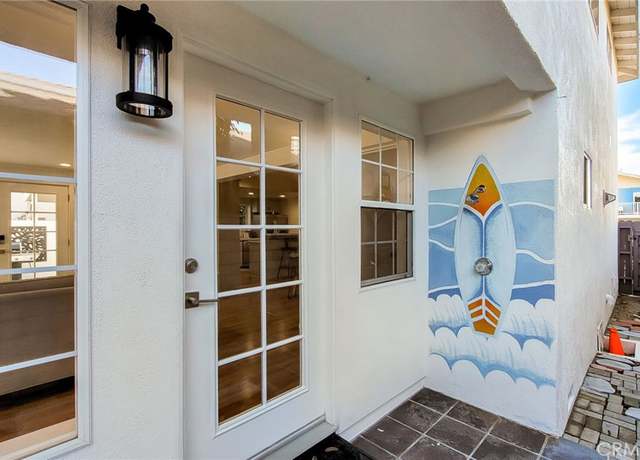
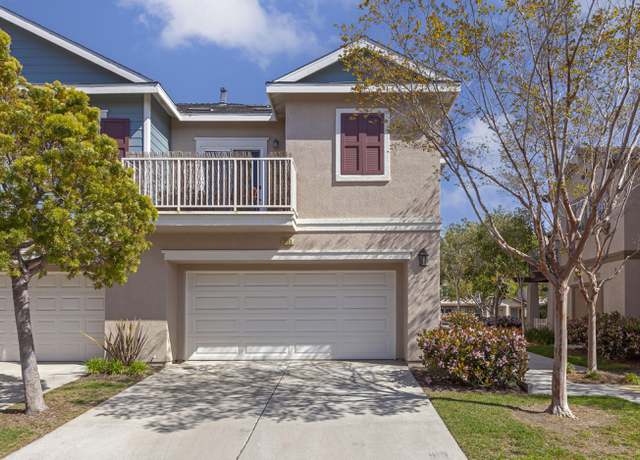
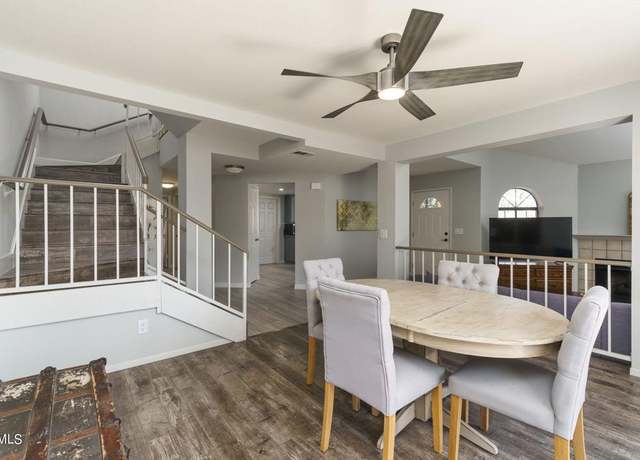
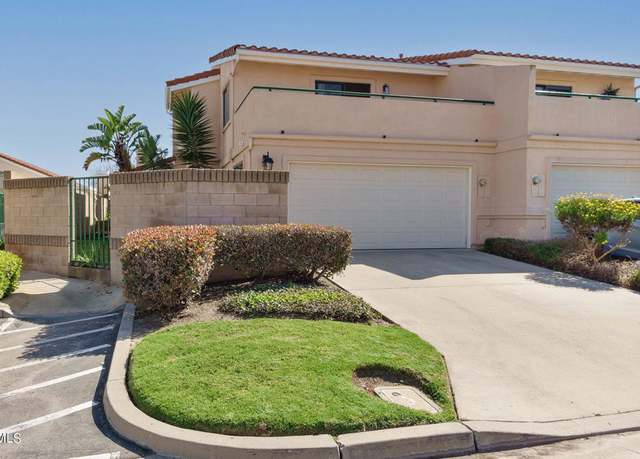
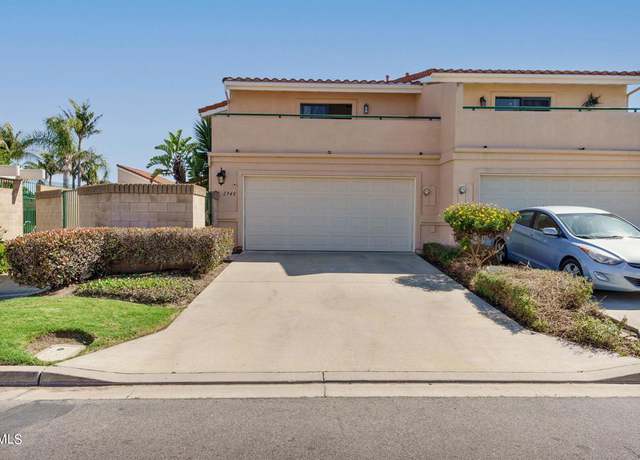
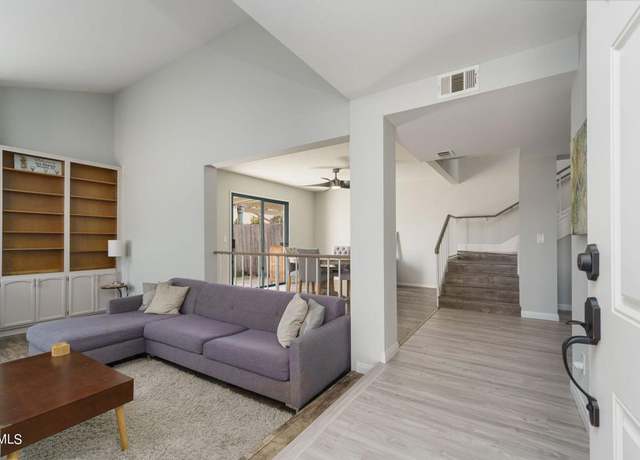
Come see this fabulous and nicely upgraded 4 bedroom, 3.5 bath tri level townhome located minutes away from the beach and Marina! Fresh modern paint and flooring just completed making this unit move in ready. Main floor offers open living room-kitchen concept and half bath to accommodate guest. Kitchen boasts white kitchen cabinets, stainless steel stove, built in microwave, dishwasher and refrigerator. All included in the sale. Spacious walk-in pantry offers tons of storage. Upper lever includes large primary bedroom with separate tub & shower, walk in closet and double sinks adorned with modern white quartz counters. 2 additional bedrooms and one full bath located on the upper leve
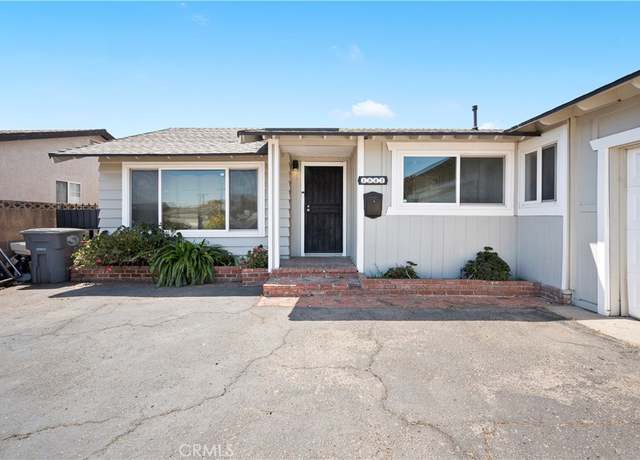
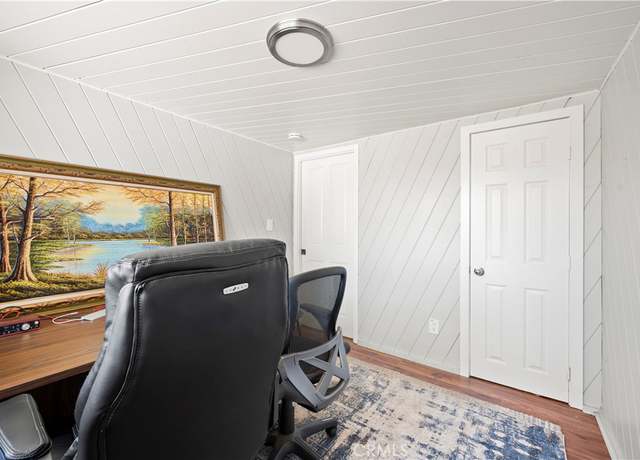
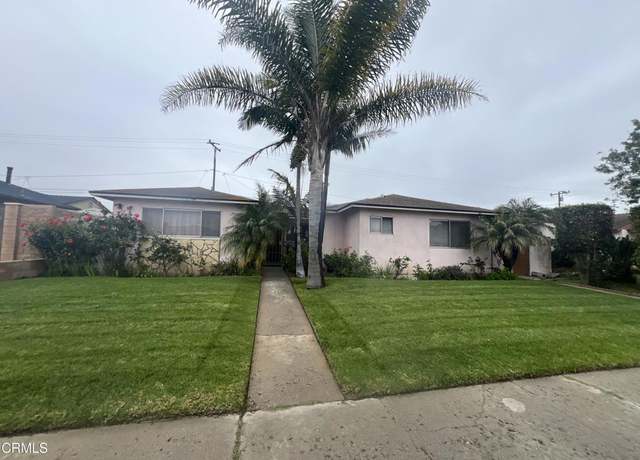
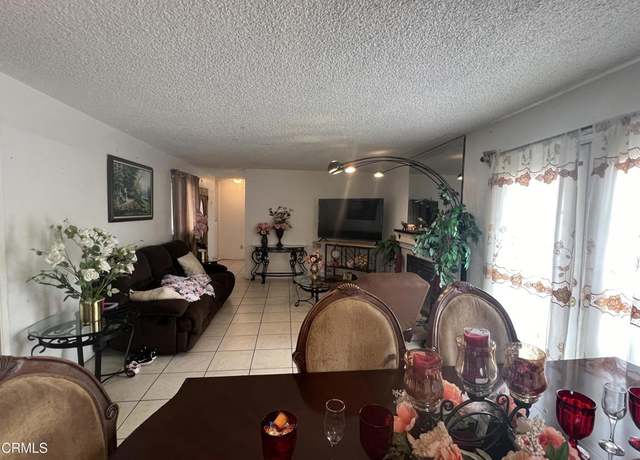
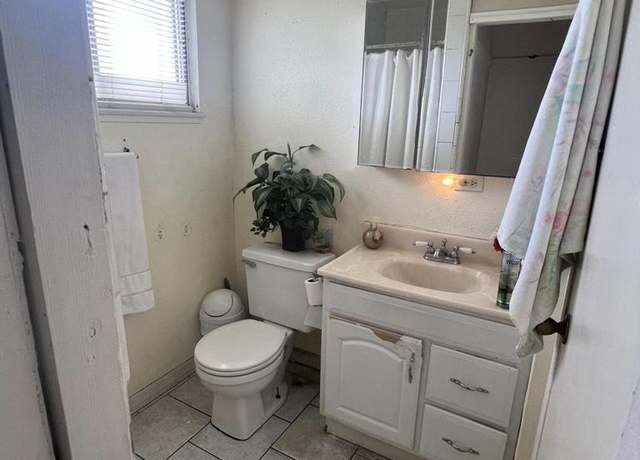
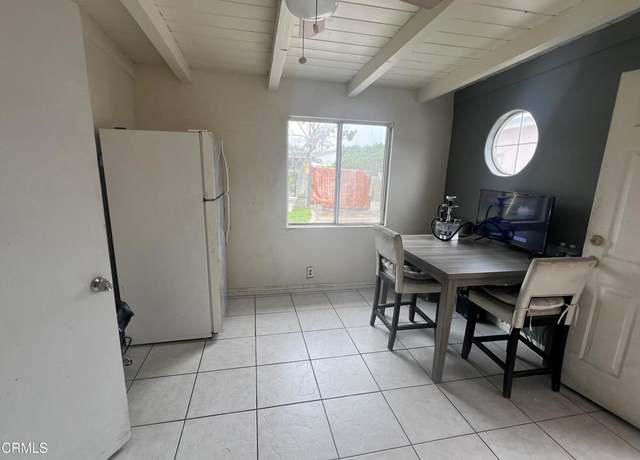
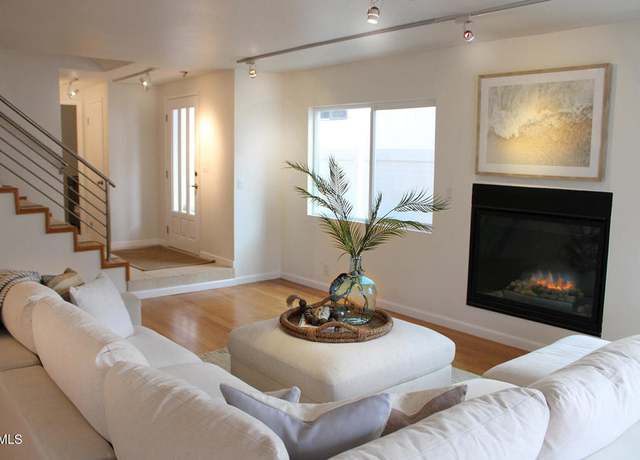
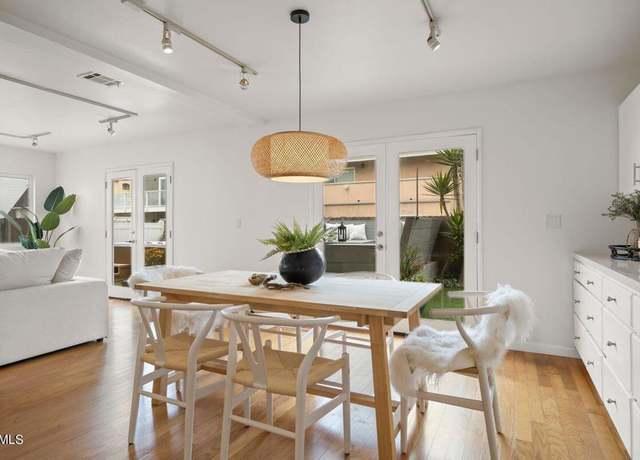
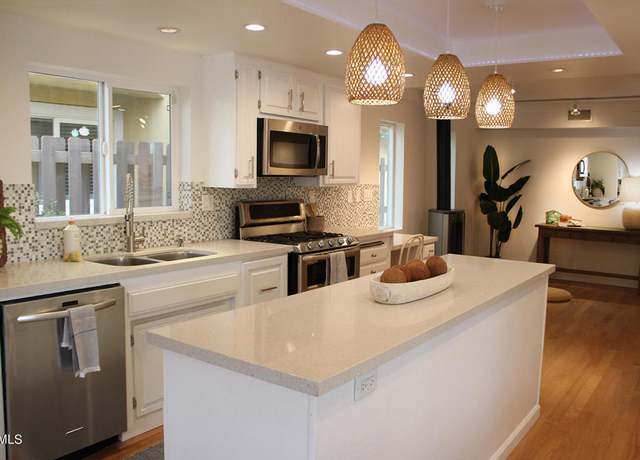
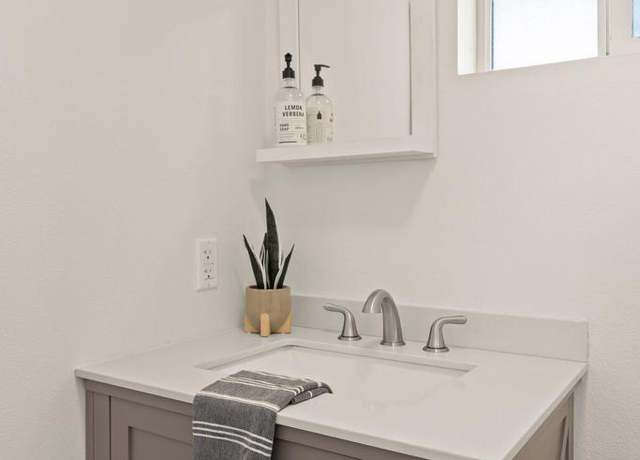
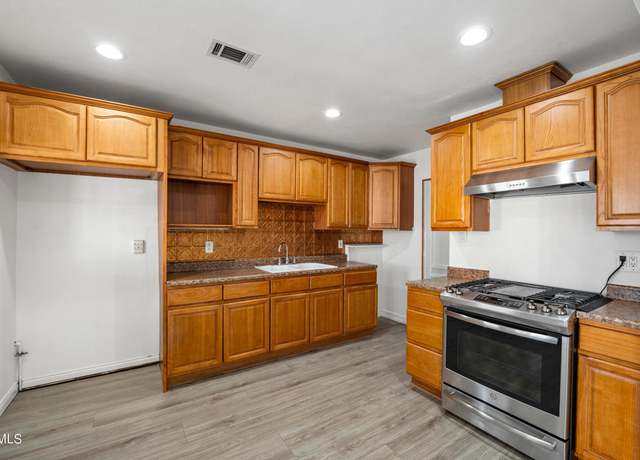
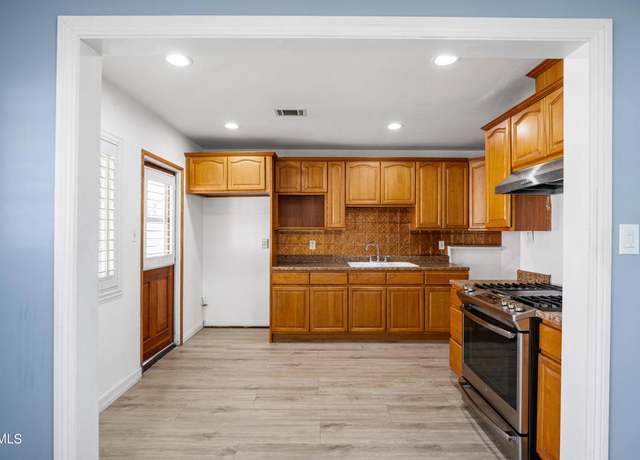
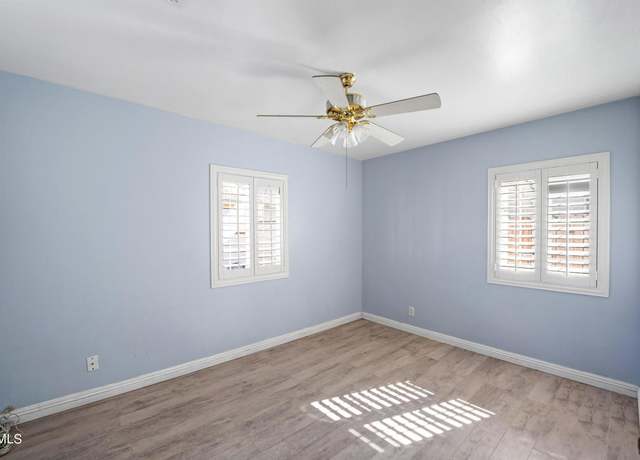
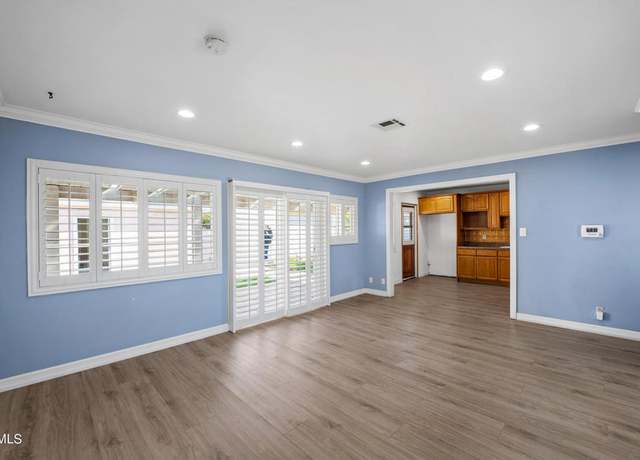
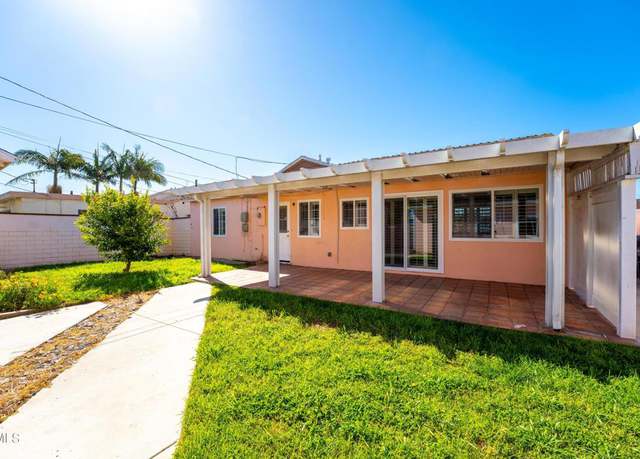
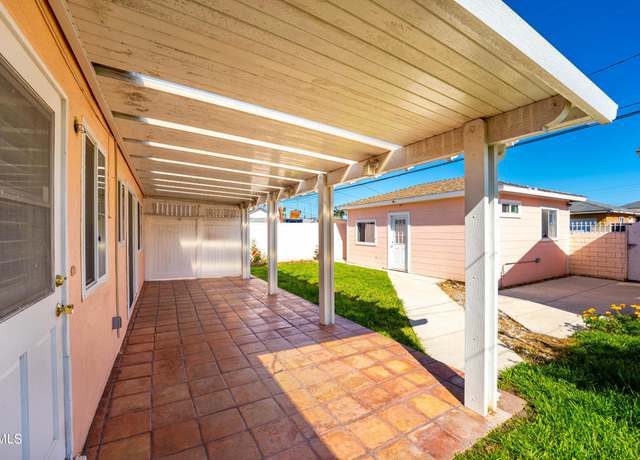
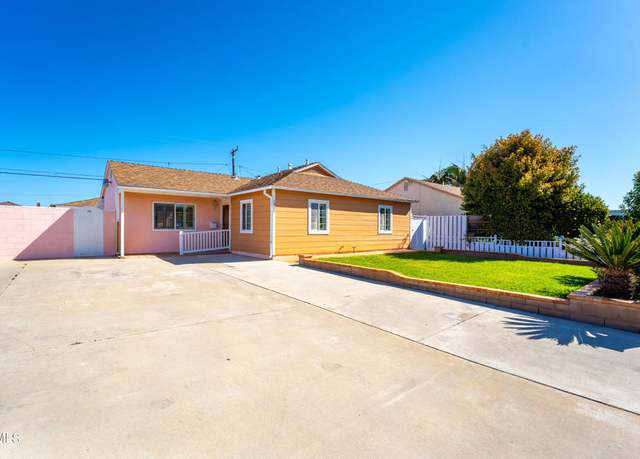
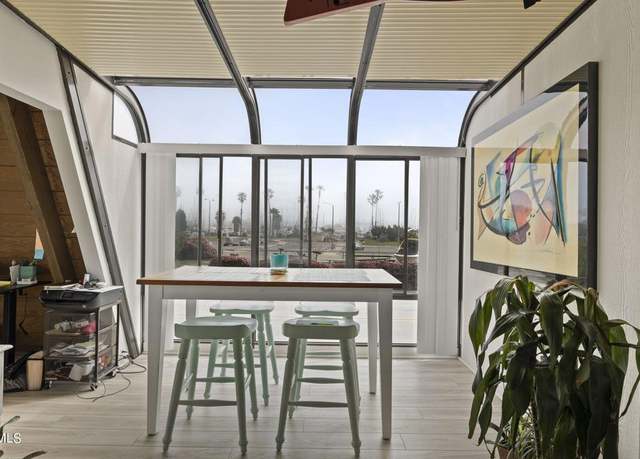
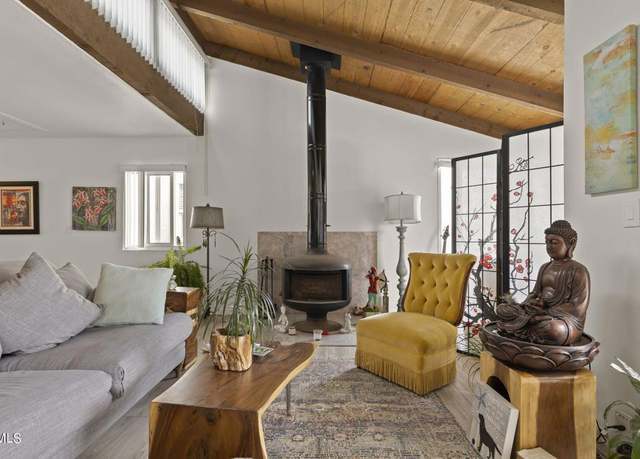
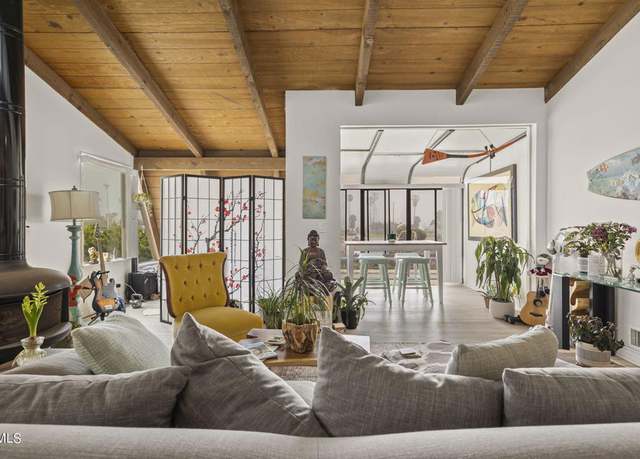
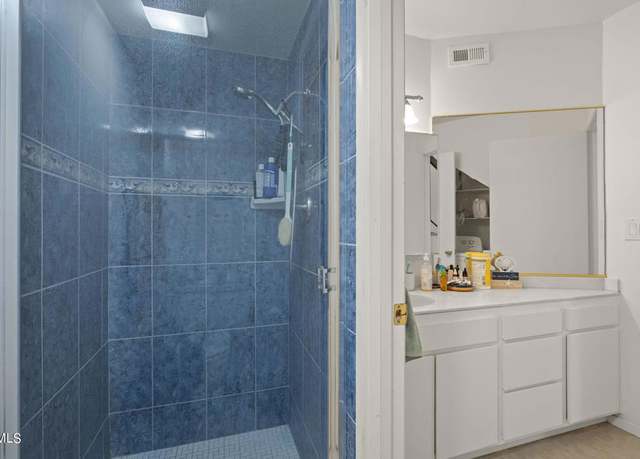
Discover the perfect blend of comfort and convenience at 1841 S F Street, Oxnard, CA. This stunning single-family, single-story home is centrally located in the picturesque seaside town of Oxnard, offering a move-in ready experience with numerous modern updates. Key features include a spacious layout with a bonus family room featuring a cozy freestanding wood stove, and an additional den that can serve as a fourth bedroom or office space. The home boasts modern upgrades like a fully updated kitchen equipped with shaker cabinets, trendy quartz countertops, newer appliances, and dual paned windows for energy efficiency. Freshly installed wood-like and tile flooring flow throughout, complement
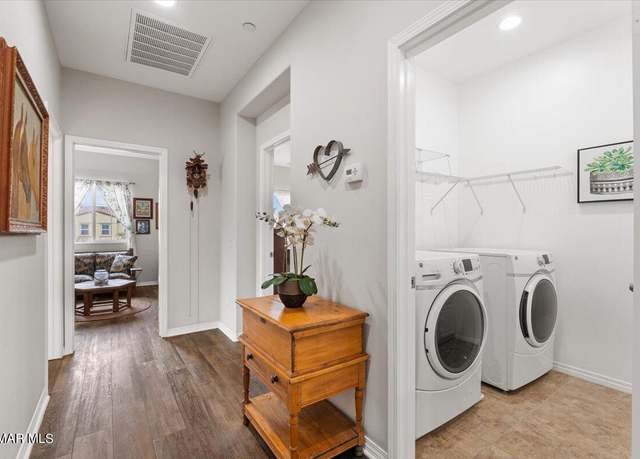
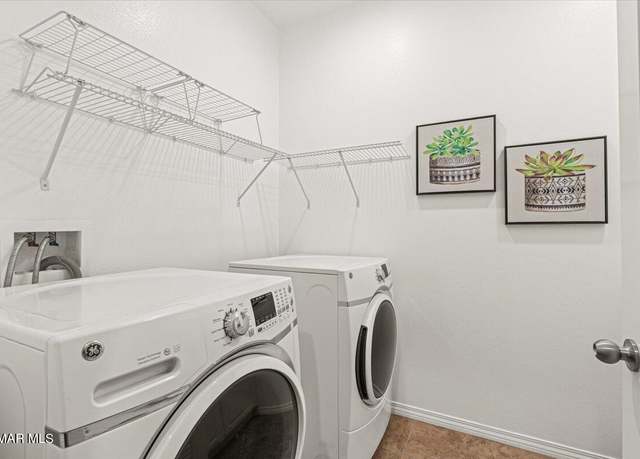
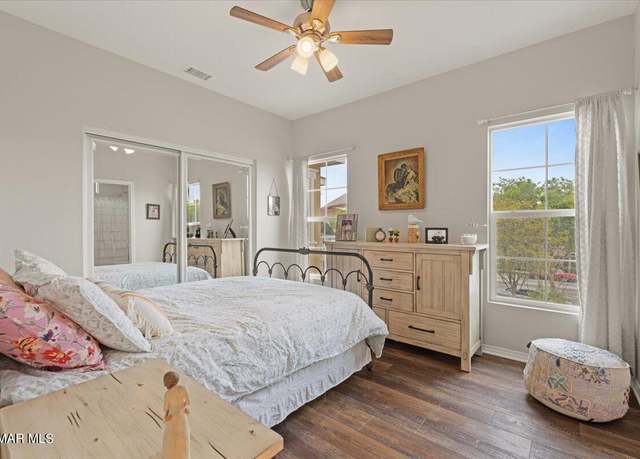
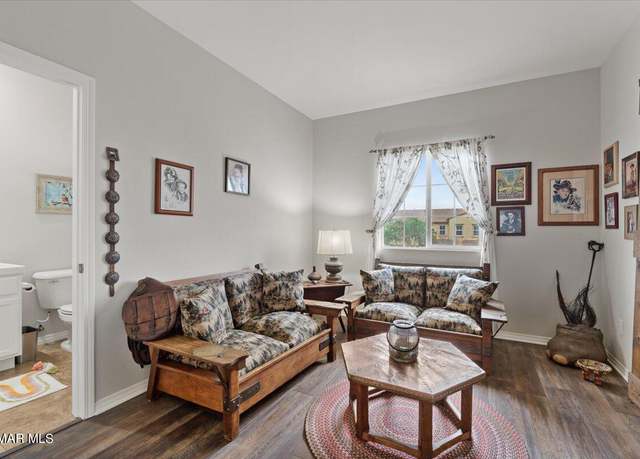
Welcome to 509 Holly Ave, a charming condominium home nestled in the heart of Oxnard, California. This beautifully maintained residence offers 2 bedrooms and 1 bathrooms, providing ample space for comfortable living. This property features upgraded dual pane widows, high ceilings, an inside private laundry area and high end laminate flooring throughout. The spacious living area is perfect for entertaining guests or enjoying cozy family evenings. The kitchen features neutral color cabinetry with soft close doors and drawers, quartz countertops, stainless steel appliances, LED lighting, ample storage, and a dining area for casual dining. Retreat to the master suite, offering a serene oasis af
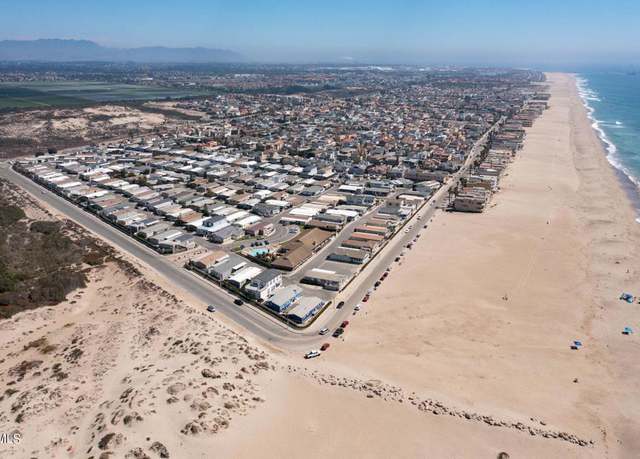
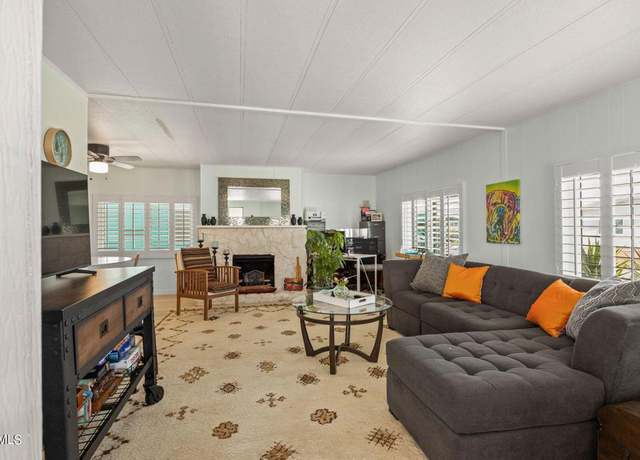
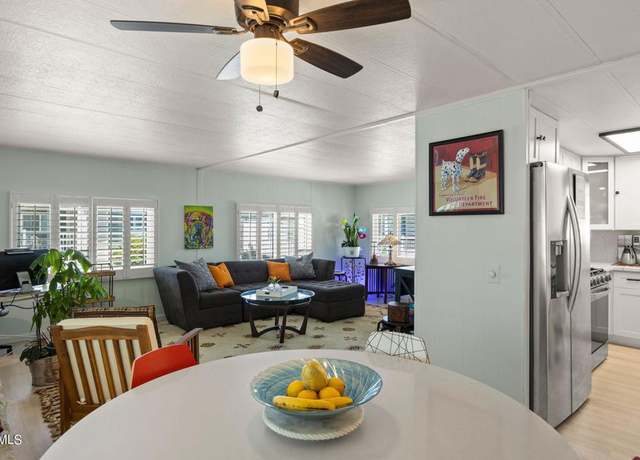
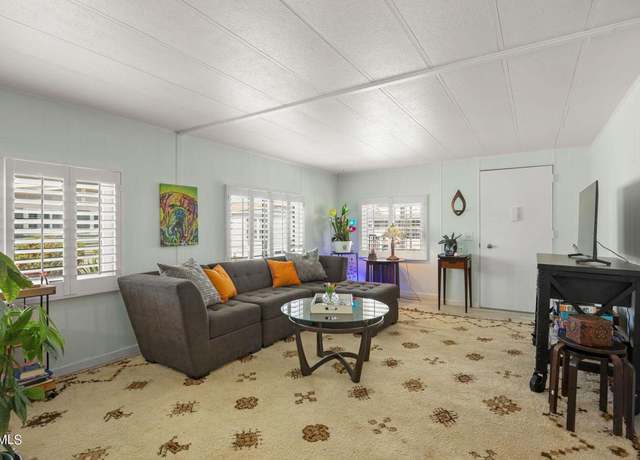
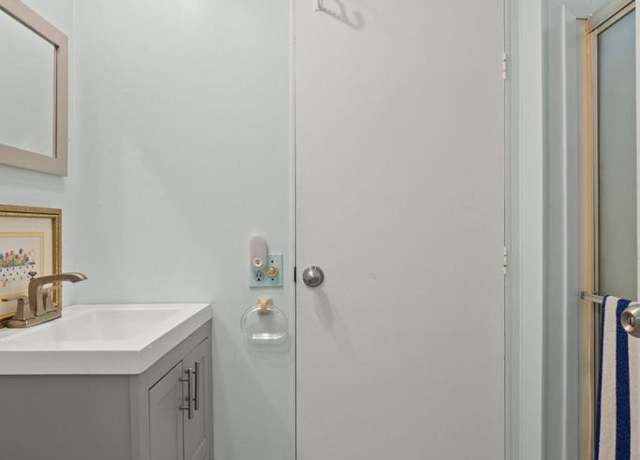
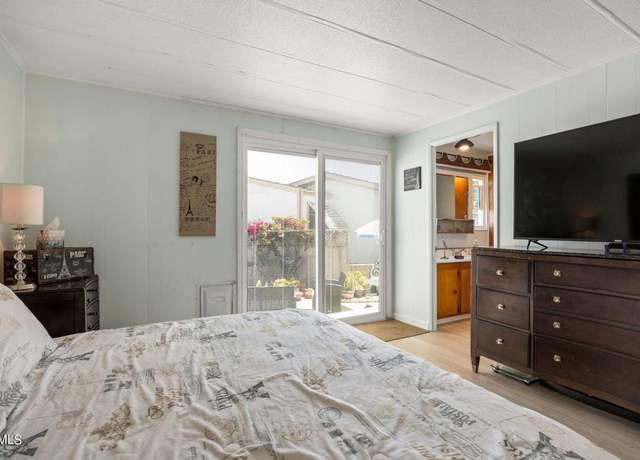
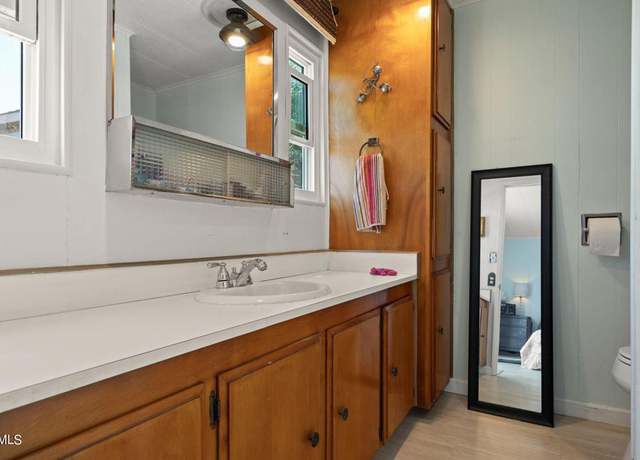
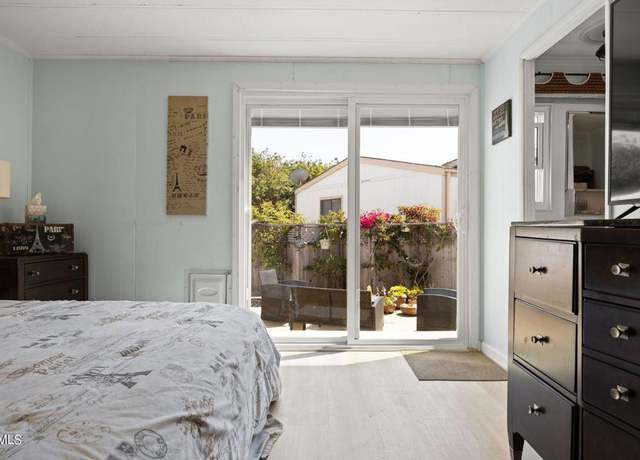
You can have it all by living by the beach and enjoying the Pacific blue ocean everyday here!!! This 2 bedroom 2 bathroom mobil home has an open floor plan, with lots of natural sunlight and many updates including windows and sliding glass door, quartz countertops, kitchen cabinets. plantation shutters or window treatments and the flooring was replaced with a special SPC ( stone plastic composite) which is a very durable, waterproof laminate flooring throughout. Enjoy the LG appliances including fridge, dishwasher, microwave, stove and washer dryer. The seller added stairs out to the newer deck from the master bedroom to the back yard to enjoy your fig tree or planting your own flowers or v
Welcome to this single-story open floor plan home featuring 3 bedrooms, 2 baths, hardwood floors, stainless steel appliances, dual-pane windows, and a private landscaped yard. Conveniently close to shopping, dining, and schools. Don't miss out on this opportunity schedule a viewing before it's gone and make this your new dream home!
Discover Your Dream Home. .. . Nestled in the serene and sought-after neighborhood , this beautiful home offers the perfect blend of comfort and convenience boasts a modern design with all the amenities you need for a comfortable and easy living experience. As you step into the front door you will be walking into a bright, open floor plan featuring large windows that bathe the space in natural light. The living area flows seamlessly into the dining space, perfect for entertaining guests or enjoying quiet family dinners, the modern kitchen Equipped with stainless steel appliances, granite countertops, and ample cabinet space, This home also features 3 generously sized bedrooms, each designe
Attention Investors! Home is a diamond in the rough, just waiting for your touch. TLC required, but the potential is endless. 2 properties on one lot, 150 & 152.150 is original home (tenant occupied), includes 3 bedrooms, 1 bathroom, laundry room and storage room. 152 built in 2004, attached to original homes garage. Two story, 4 bedrooms, 2 baths, 2 car garage access.
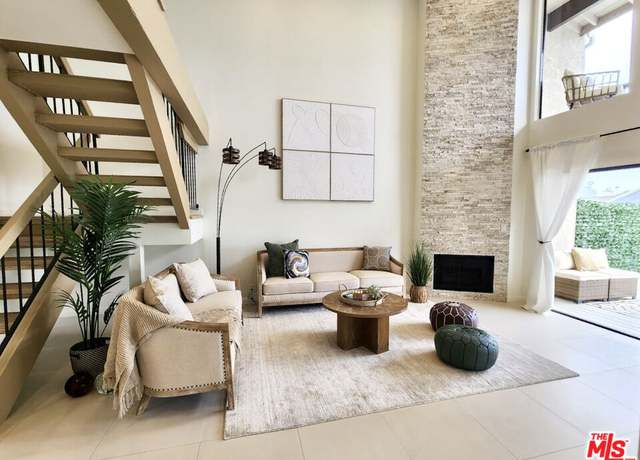
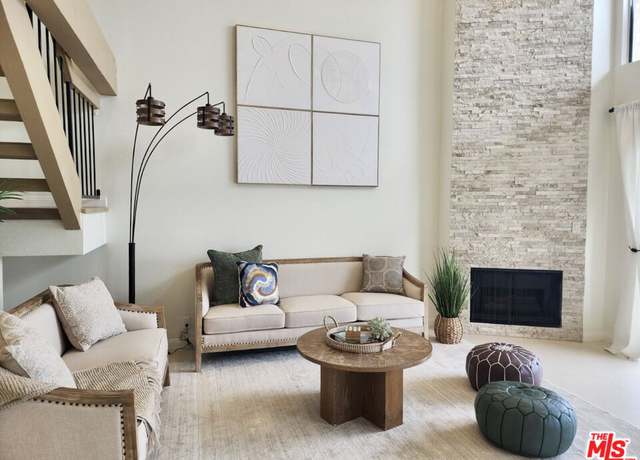
Welcome to paradise at Westport! This exquisite Waterfront Estate offers the pinnacle of coastal living, boasting unparalleled luxury and elegance. Step into a world of refined sophistication where every detail has been meticulously curated for your utmost comfort and pleasure. As you enter, be greeted by stunning wood and marble flooring cascading throughout the expansive first floor. The formal living area beckons with its cozy fireplace, while the adjacent dining room sets the stage for intimate gatherings. Custom French doors usher in natural light, seamlessly blending indoor and outdoor living spaces. Indulge your inner chef in the gourmet kitchen, equipped with top-of-the-line applian
Hard to find 2 Separate Houses on 1 lot, Duplex. (Two) 2bedroom + 1 bathroom detached units. Both with attached 2 car garage and private laundry. New Roof, Newer kitchens with granite counters, One unit has a private front hard and the other unit has a private back yard.
Welcome to your dream home! Step into this stunning home where elegance meets modernity. As you enter, you're greeted by an expansive living and dining area, bathed in natural light streaming through large windows. The open kitchen is a chef's delight, boasting sleek, modern wooden cabinets that perfectly complement the stainless steal appliances. The centerpiece of the kitchen is the inviting island, ideal for casual dining or entertaining guests. This home offers three spacious bedrooms, each offering its own unique charm. Two of the bedrooms feature ample closet space and share a beautifully appointed full bathroom. The master bedroom is a sanctuary unto itself, offering abundant space a
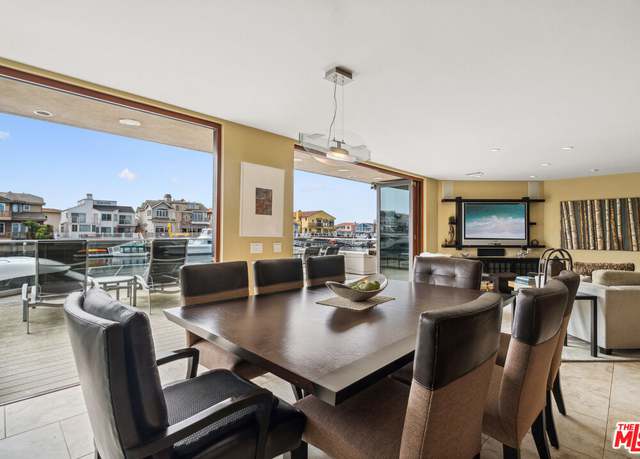
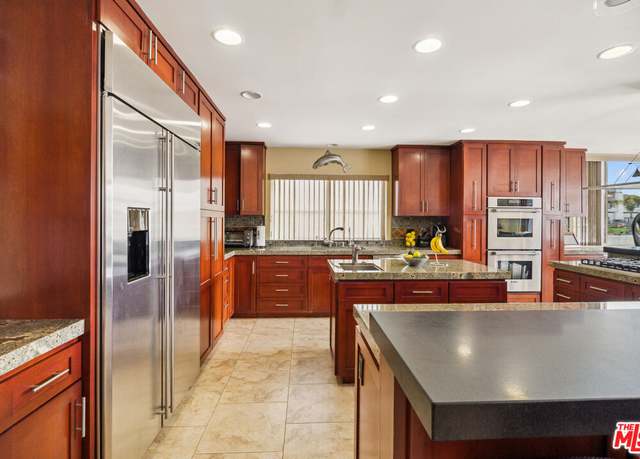
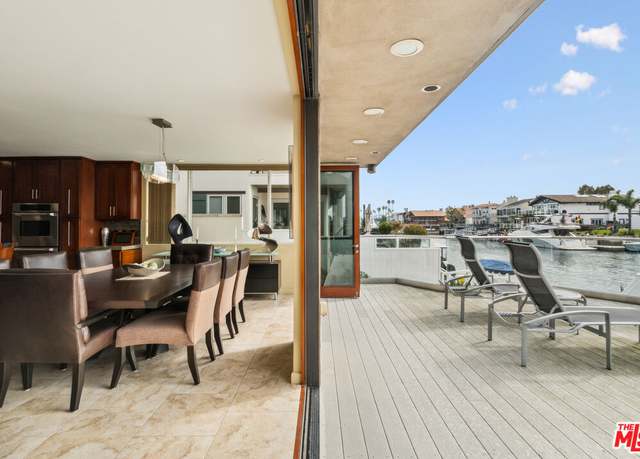
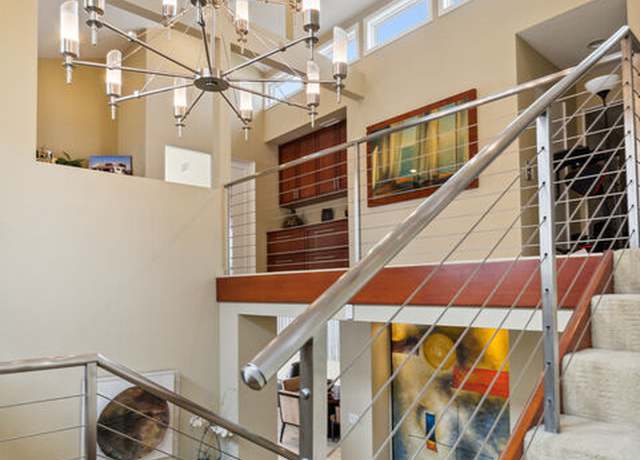
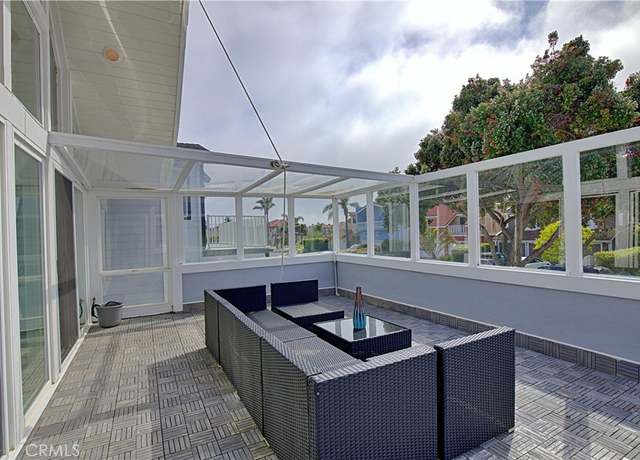
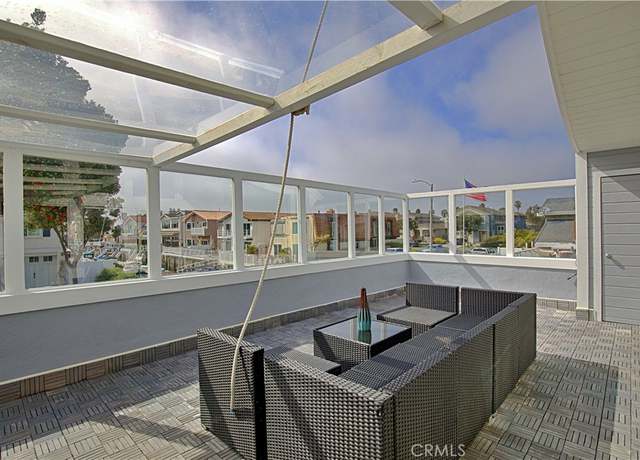
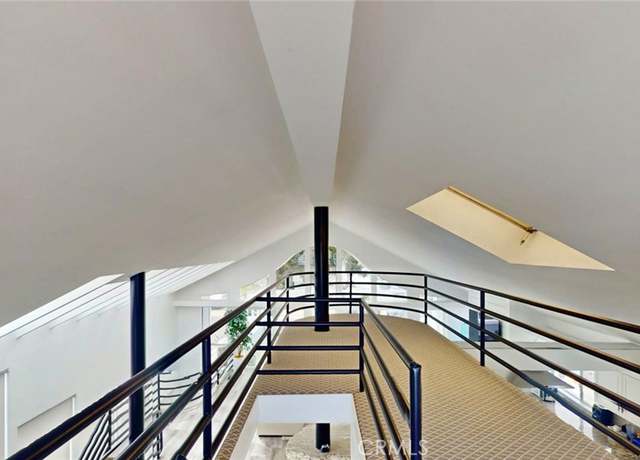
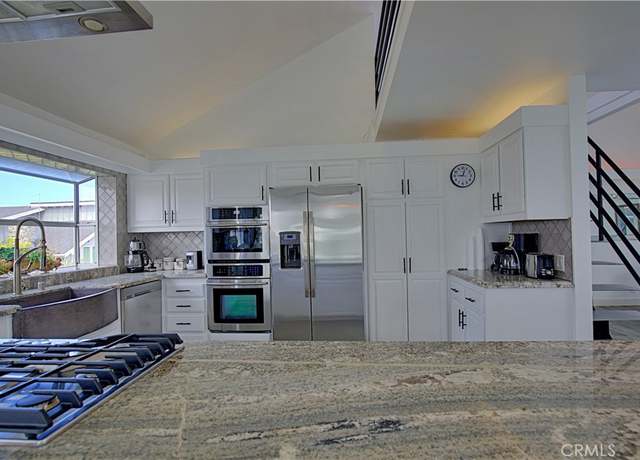
Architectural Water-front home with prime west-facing views in the Channel Islands Harbor. Experience the epitome of luxury ocean living with custom accordion doors, opening up the Harbor and sunset views to your living room. Massive chef's kitchen with imported granite countertops, lounge bar area, and an oversized island featuring a secondary sink invites a perfect entertaining space. Venture upstairs via elevator to two substantial guest bedrooms and a luxurious primary suite, featuring harbor, ocean and mountain views from your private primary balcony. The main deck area provides an additional 400+ sq ft of outdoor living area, perfect for entertaining or al-fresco dining and BBQ. Your
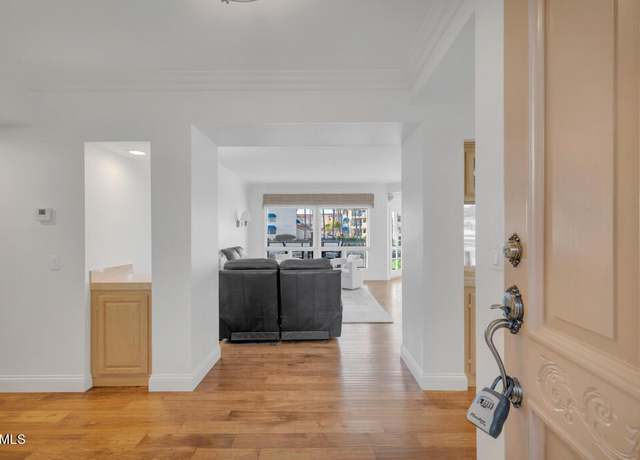
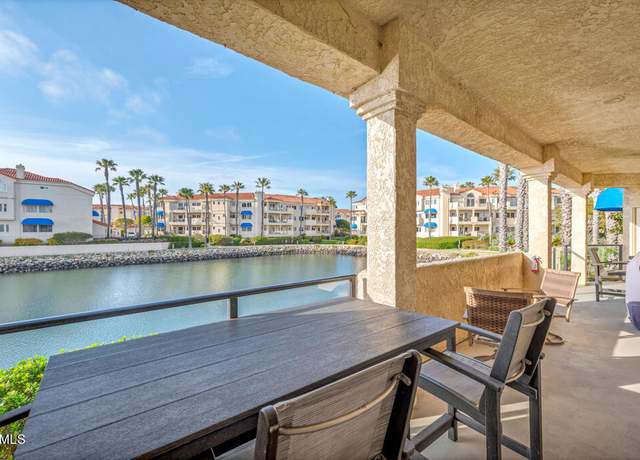
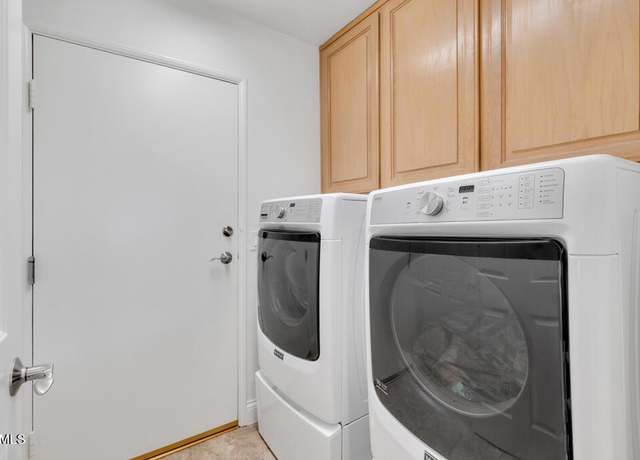
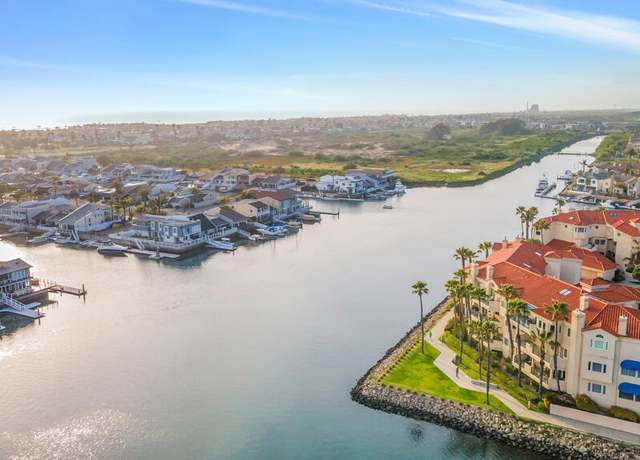
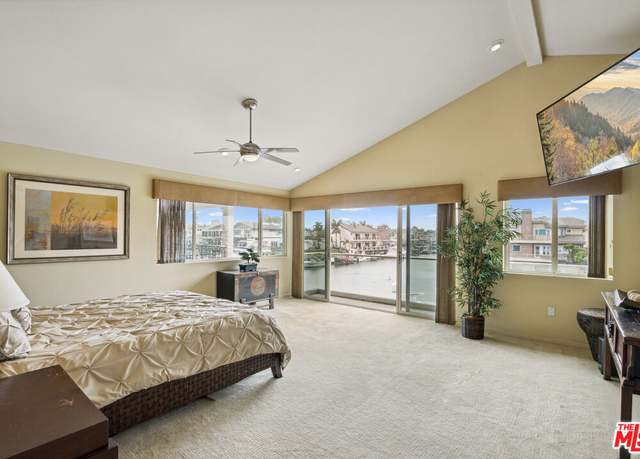
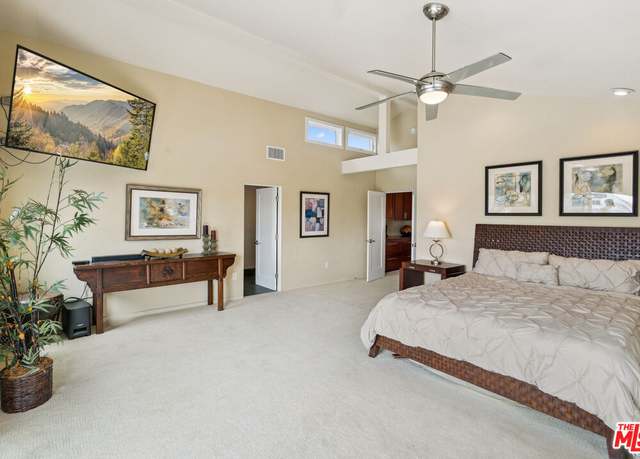
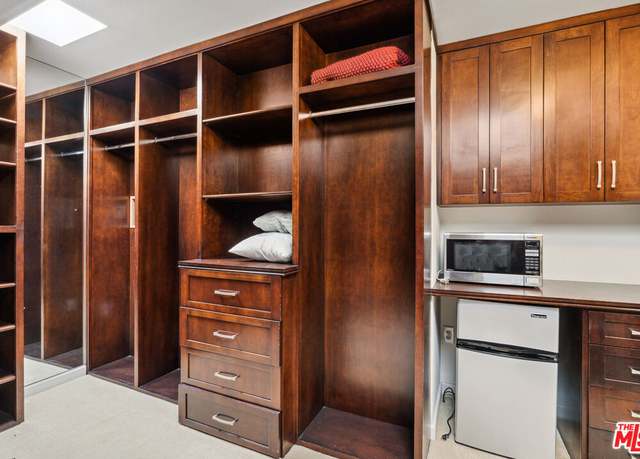
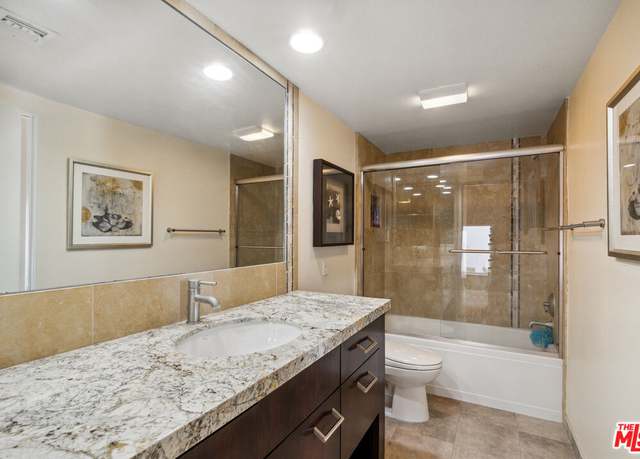
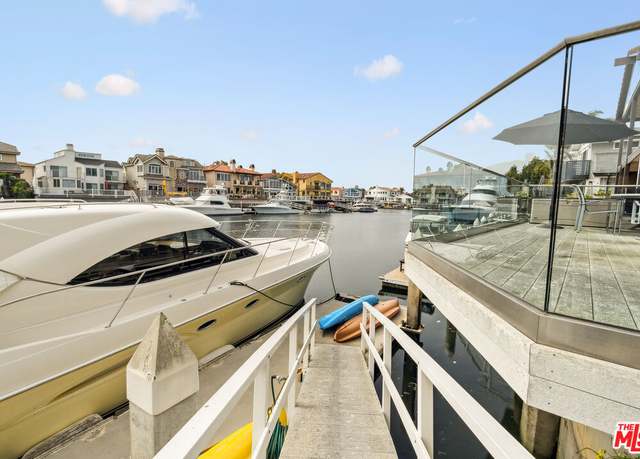
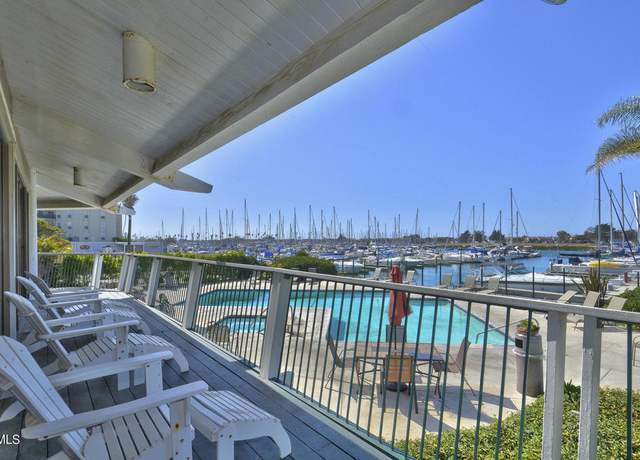
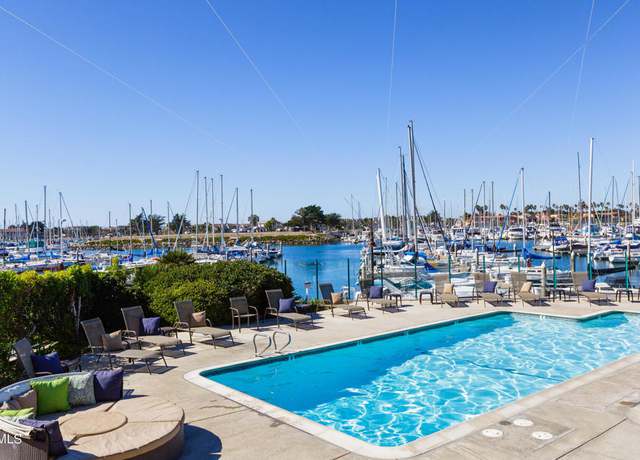
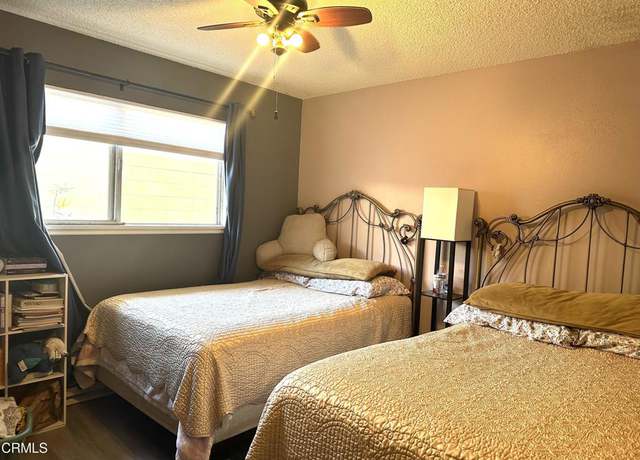
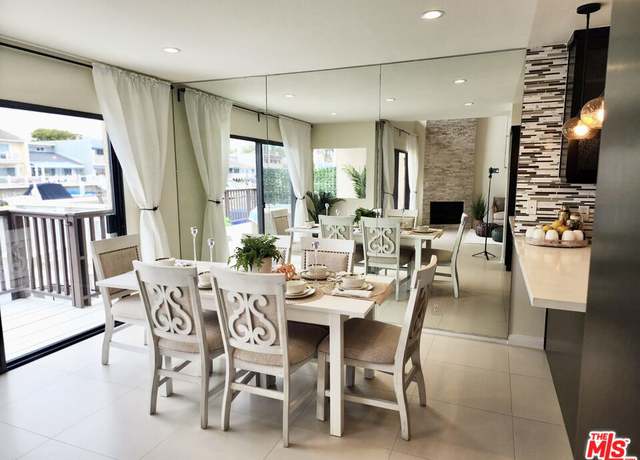
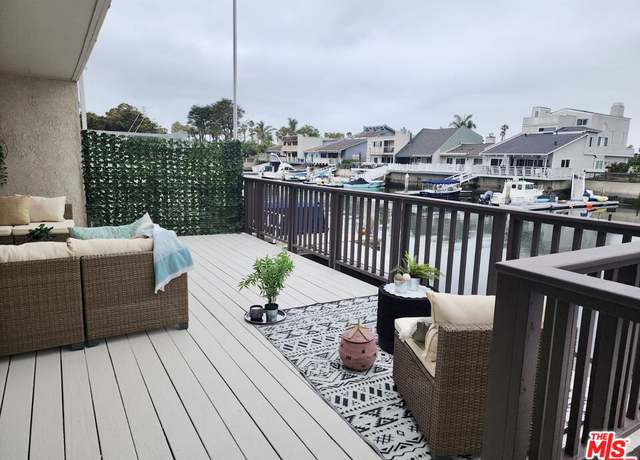
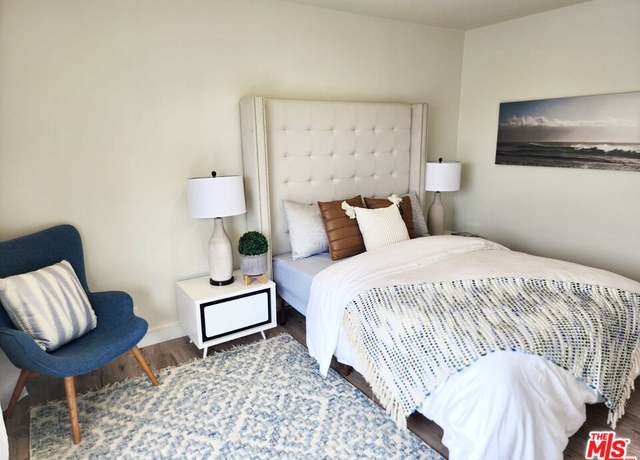
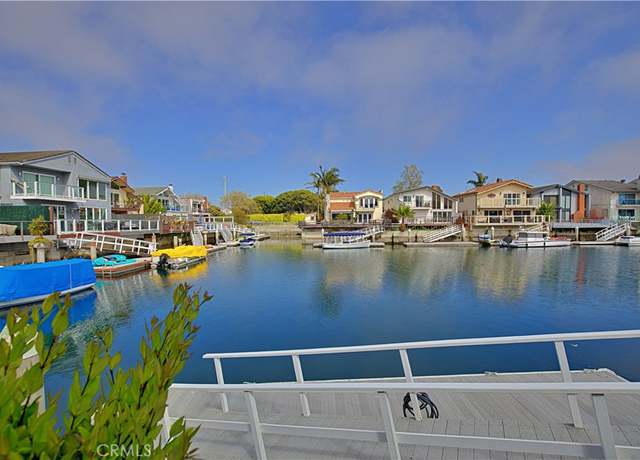
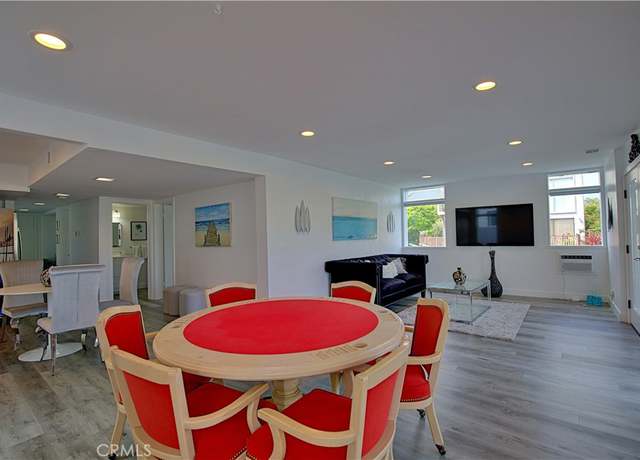
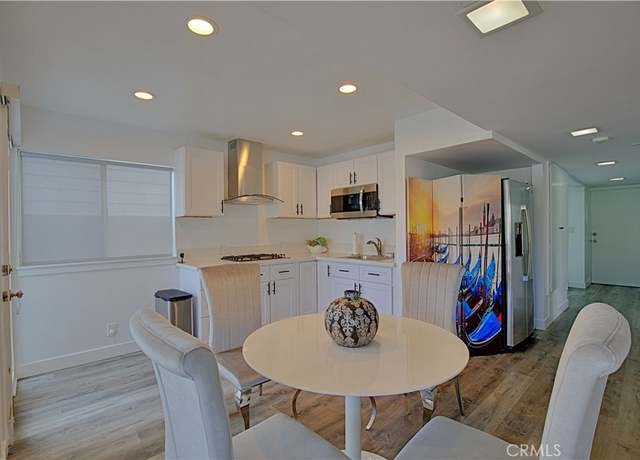
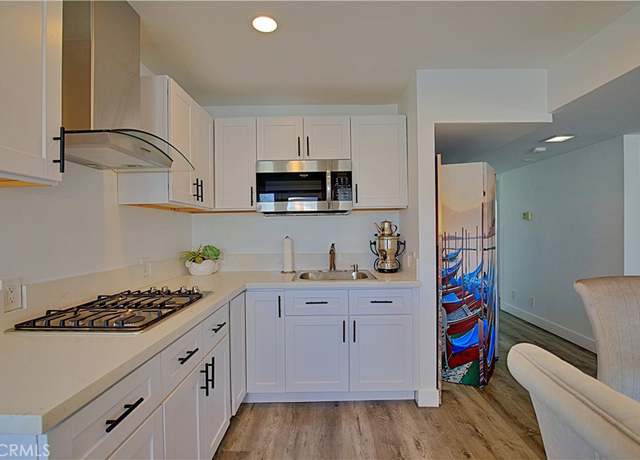
It's the View! If you've been waiting for one of the finest locations in this waterfront community, this is it. Featuring Southwest-facing water views over the garden, a private corner orientation and HIGHLY SOUGHT-AFTER LARGE PATIO that offers more privacy than most. The home has impressive water and sunset views from every room and access to the patio from both living room and bedroom. There is even a peek of the ocean. The high-end upgrades feature custom-built and polished fine wood cabinetry and imported stone countertops. Stainless appliances, floor to ceiling mirrors to bring the boats inside and easy-to-maintain tile and wood-like floors make this property the perfect beach getawa
Wonderful Home in Oxnard: 4 Bedrooms/ 2 Baths. 1246 Sqft and 6000 Sqft Lot! Move in Condition: Updated Kitchent with Built-in Microwave, Quartz Counters, and Stylish Cabinetries. Open Floor Plan Design for added Natural Lights and Comfort. Charming Landscapings with Custom Built Backyard Deck-Patio for Entertainments and Family Gatherings. Detached Garage Connected to back Alley for Easy and Separate Entrance Access. Additional driveway parking in the front. Close to Schools, Parks, Eateries, Shopping Centers. And about 10 mins to the Beach! The home's got characters! Check it out.
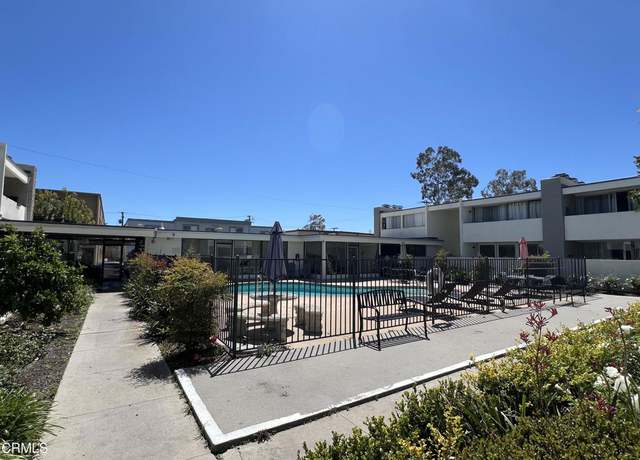
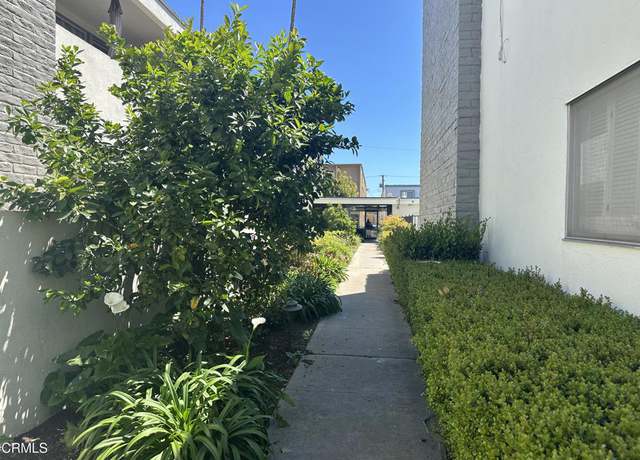
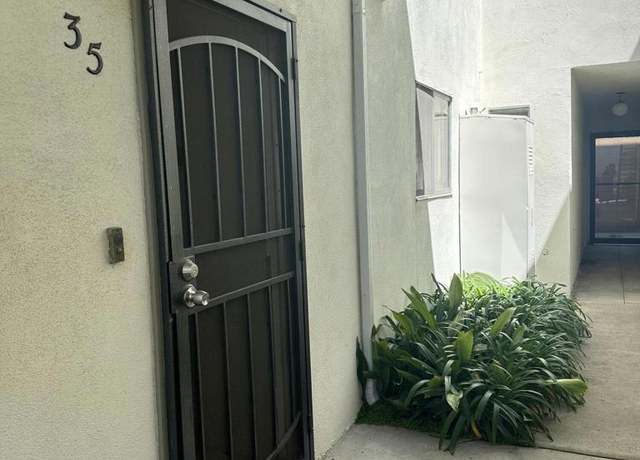
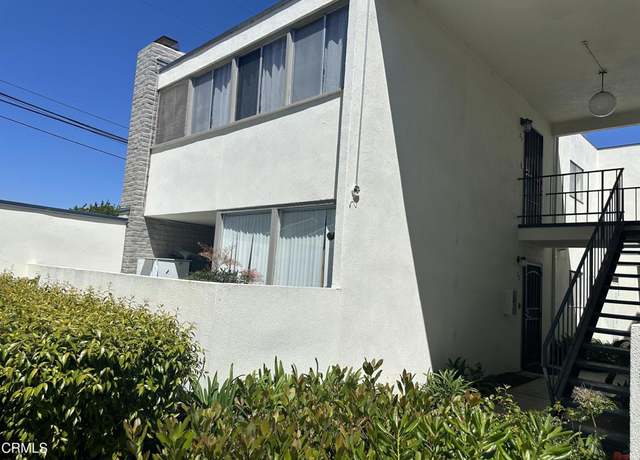
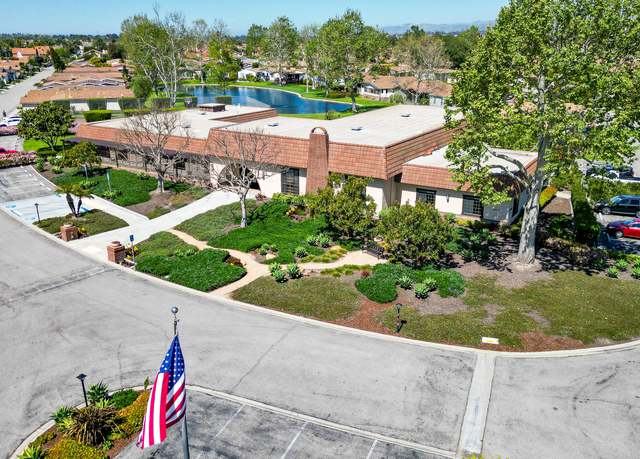
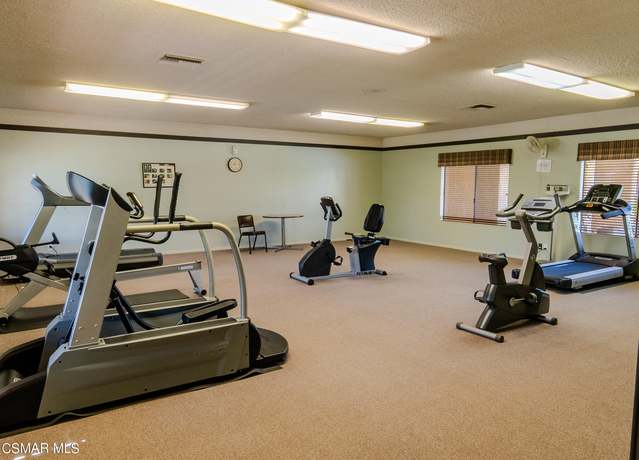
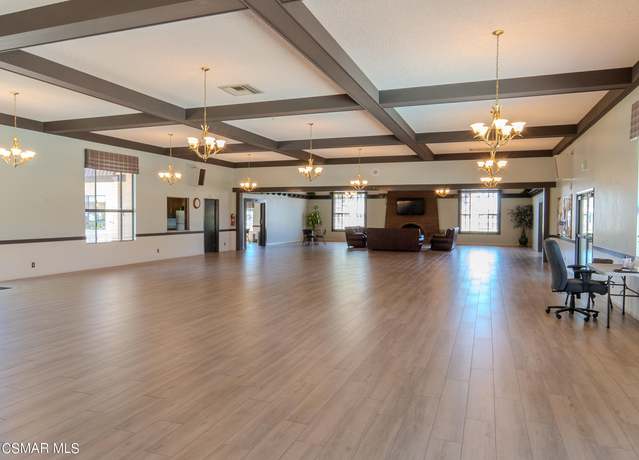
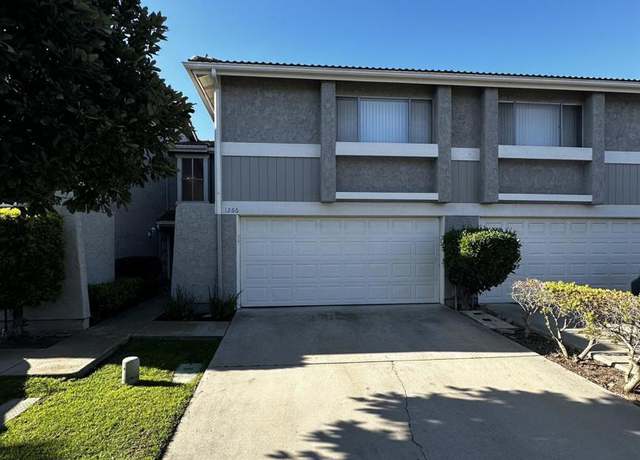
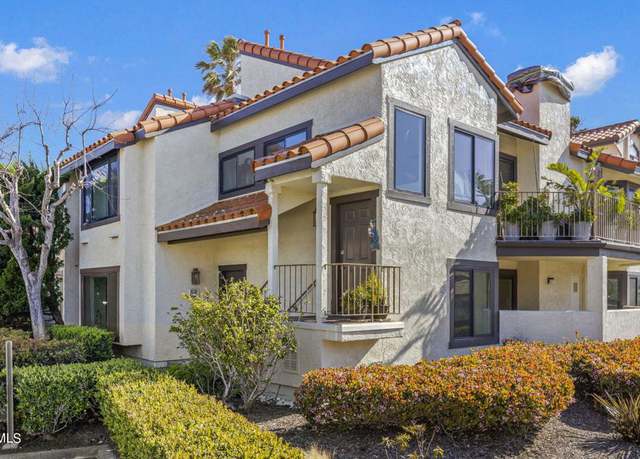
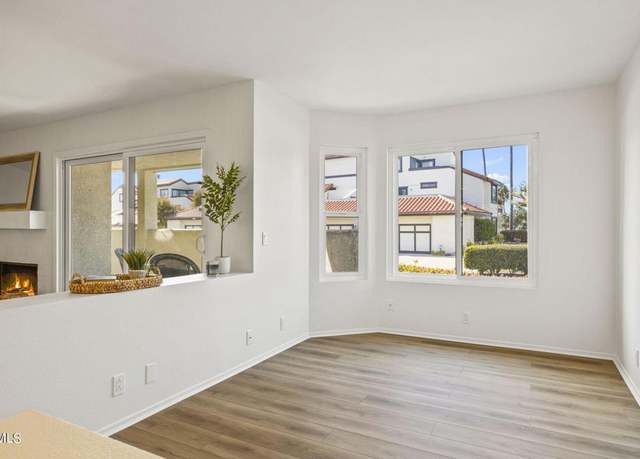
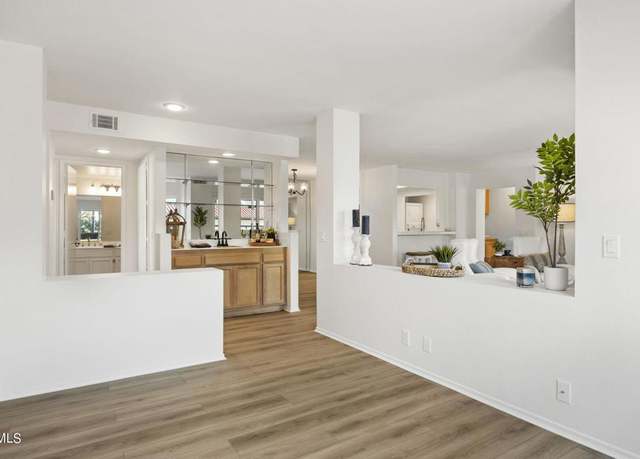
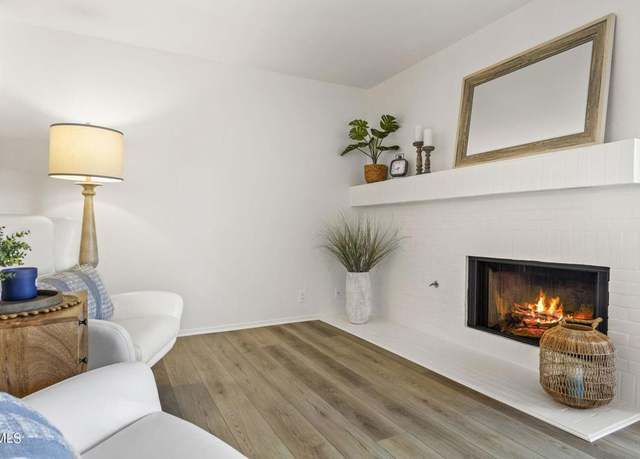
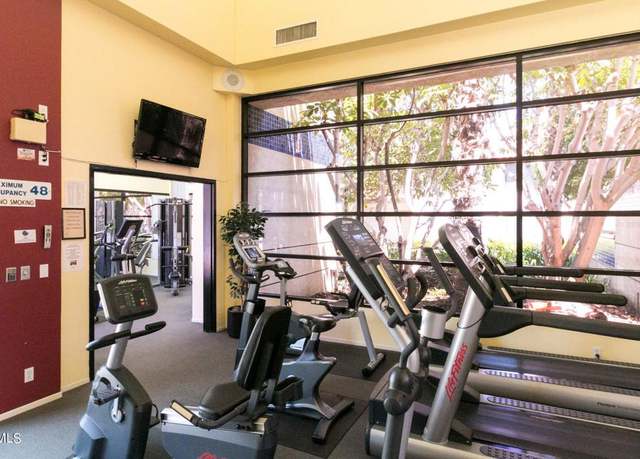
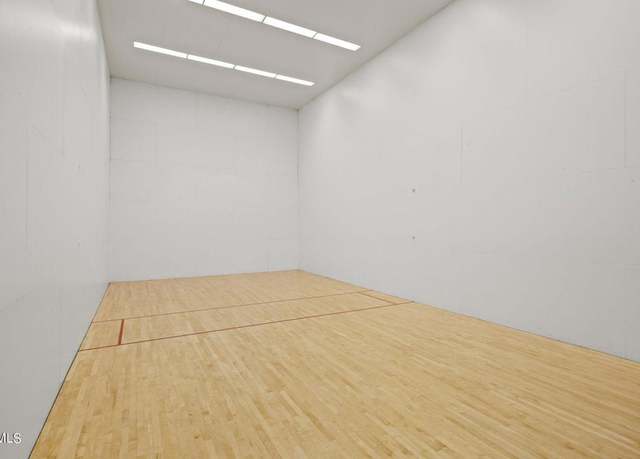
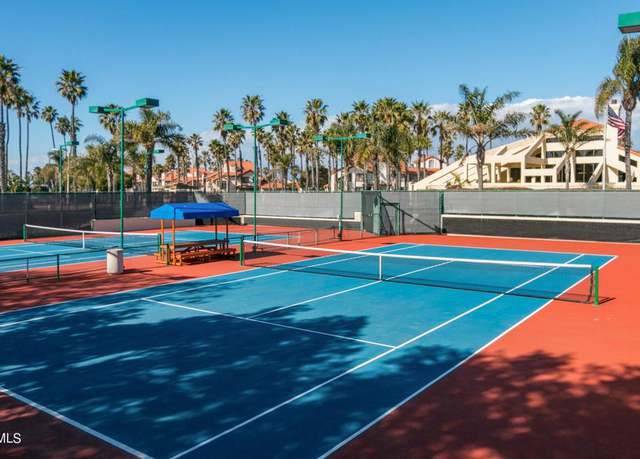
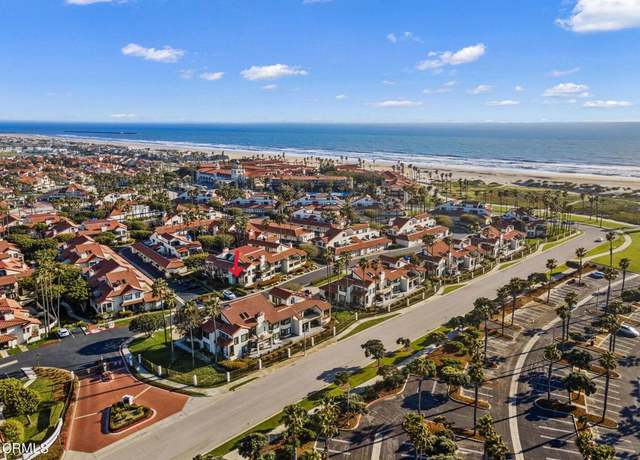
Opportunity knocks to own a starter home or an investment rental. Home has been well maintained and is a fantastic blend of coastal living and city convenience. It is located near beaches, shopping and restaurants. The townhome feels spacious and comfortable for easy living and is in a gated community. First level unit with zero steps. Unit is detached with only an upstairs neighbor. Great open floor layout with two oversized bedrooms and large family room with fireplace, in unit laundry and large outdoor patio. Community pool, gym and clubhouse and detached garage with storage are steps away.
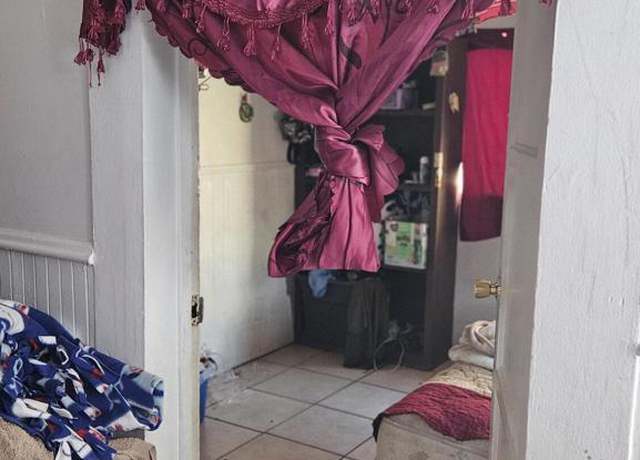
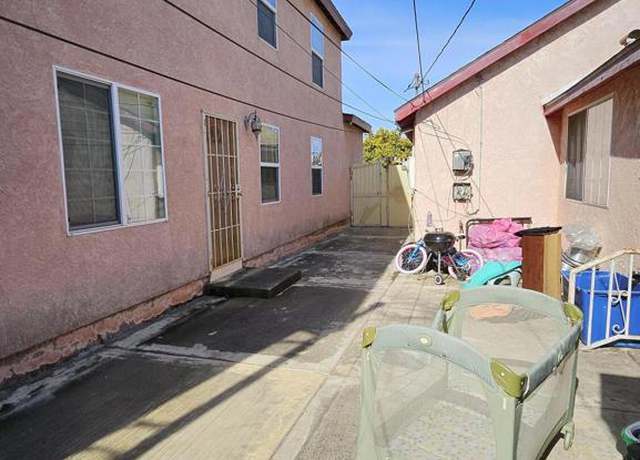
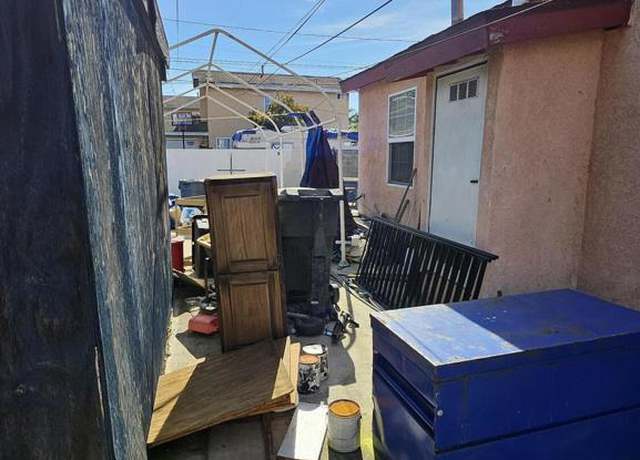
First time on the market after 40+ years this court-confirmation needed probate sale gem is finally on the market seeking a new homeowner. This diamond in the rough is more than just a house; it's a future home that awaits your creative touch to unlock its full potential. With some tender love and care, this property can be transformed into a stunning home that reflects your personal style and meets your modern needs. Whether you're a first-time homeowner looking to make your mark or an experienced renovator ready for your next project, this property is an excellent opportunity to craft the home of your dreams. Don't miss the chance to revive this diamond in the rough into a shining jewel o
Are you ready to indulge in the ultimate coastal retreat at Mandalay Bay on the Channels? This remarkable abode has been completely revamped, nestled conveniently between Malibu and Santa Barbara. Settle into your new sanctuary with a private marina at your doorstep boasting breathtaking Channel Island Harbor views and mesmerizing sunsets above the water. Three master bedrooms are strategically positioned in separate wings of the residence while the ground-floor master suite comes complete with its own entrance and bath, offering a private retreat perfect for guests or family members seeking privacy. The spacious living area is accentuated by Cathedral ceilings, architectural stairway and c
Very nicely remodeled (2019) single story residence in the Sandpiper Village II complex of Port Hueneme. From the entry, you are welcomed into the living room and dining room with their beautiful wood floors. Then view the kitchen which features newer custom wood cabinets and granite/quartz counters tops, oven/range and dishwasher plus built in washer and dryer in the laundry area. Both baths have been upgraded and updated to look better than new. Dual pane windows in the bedrooms with blinds, newer patio fencing too. And more. Two car detached garage is just steps away and it is only a stroll to the city park and playground. And it is just a short bicycle ride to several beaches and the Ch
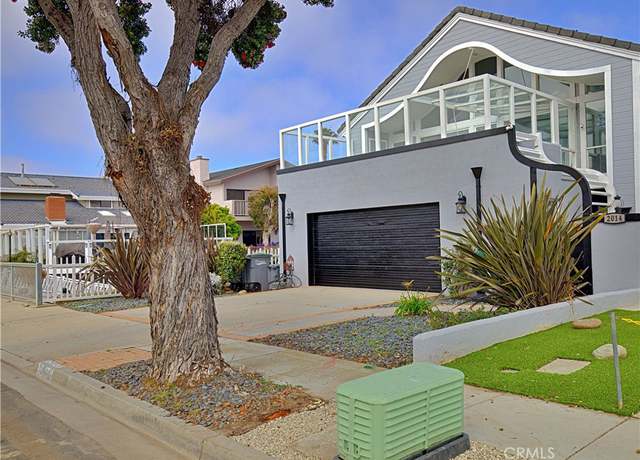
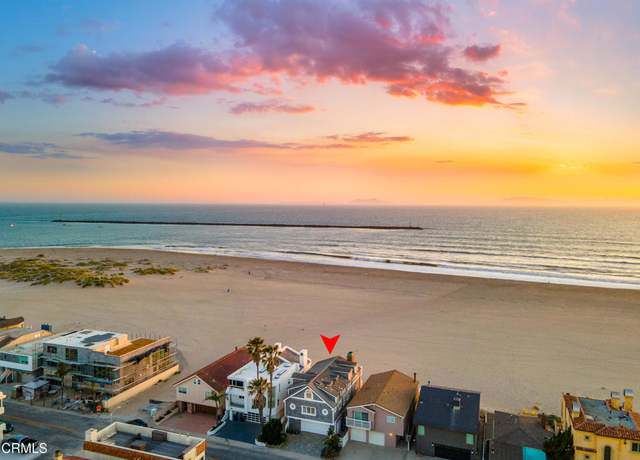
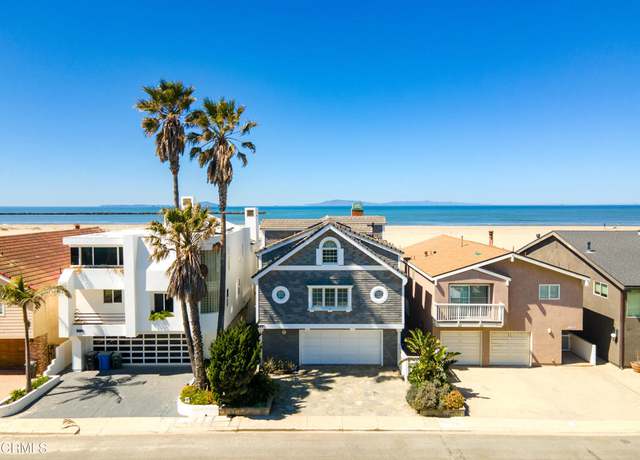
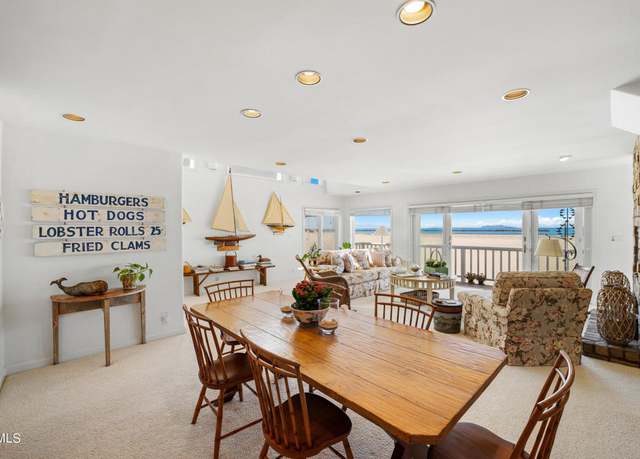
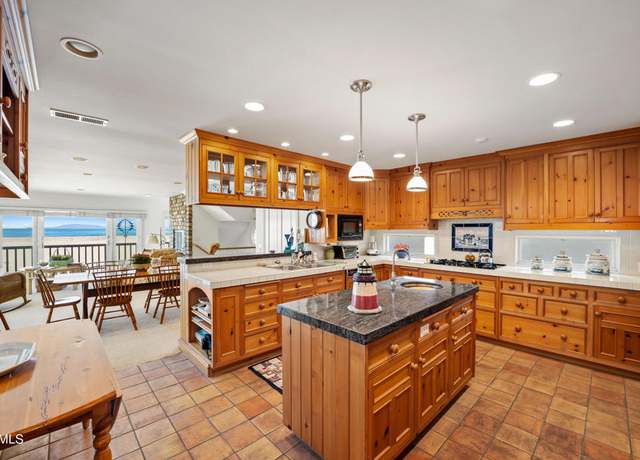
In the Southern California real estate world, it’s incredibly rare for the words “beach house” and “opportunity” to appear in the same sentence. Living steps from the sand in the glitzy enclaves of Malibu, Venice or Manhattan Beach can only be achieved with multiples of millions of dollars, so the value represented by 4920 Island View Street –situated just houses away from the beach – is truly a once-in-a-lifetime one. But an enviable location is just the beginning of what this home has to offer. Exceptionally large and filled with natural light. Discover the perfect blend of luxury and leisure in this spacious 4-bedroom, 4-bathroom 3020-sqft home,
Beautiful Cypress Point home with a park like backyard. Open kitchen and family room with a fireplace. Formal living room with a fireplace. There is a full bathroom and bedroom downstairs. Family room has high ceilings, a fireplace and lots of natural light. There is a loft or office area and a formal dining room. The primary suite is larget with a soaking tub, seperate shower and dual vanities. The extra bedrooms are spacious. There is a larger 3 car garage with storage. The seperate laundry room has a sink. The community features a pool and walk trailing. This is an ideal location in North Oxnard close to shopping, freeways and schoosls. Call today to view.
Desirable River Park Community. You; ll love this bright and open three bedroom townhome with a gated yard and wonderful location. Open living room, dining room, bathroom and kitchen on the first floor. Three bedrooms upstairs, two full bathrooms and laundry room. The kitchen is open to the dining area and living room and features granite countertops, warm cabinetry and and appliances. This home has a two car attached garage. Riverpark is a planned development with schools, parks, walking trails, dog park. Walking distance to the Collection with restaurants, movie theatre, shopping and more.
Beautiful condo in a great location! Close to The Collection where you can enjoy shopping, restaurants and much more! It's also near the bus, schools, and parks. A must see! This residence is designed for comfort and style. The condo offers a bright open space, 2 bedrooms, 2 full bathrooms, open kitchen with granite counter tops, 2 car garage, a patio, and a balcony. Schedule your private showing today.
This house is located in the heart of the city, near to everything, Naval Base, shopping areas, highway 1 and the beach. The house has 4 bedrooms and two bathrooms. The room four has an addition with access to the patio. It has permits. It has a detached garage with alley access. Great potential to build a Jr ADU and an ADU. The property needs cosmetic work. This property won't last.
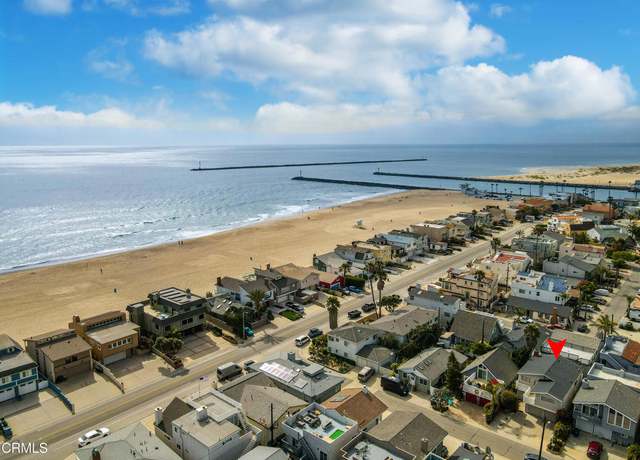
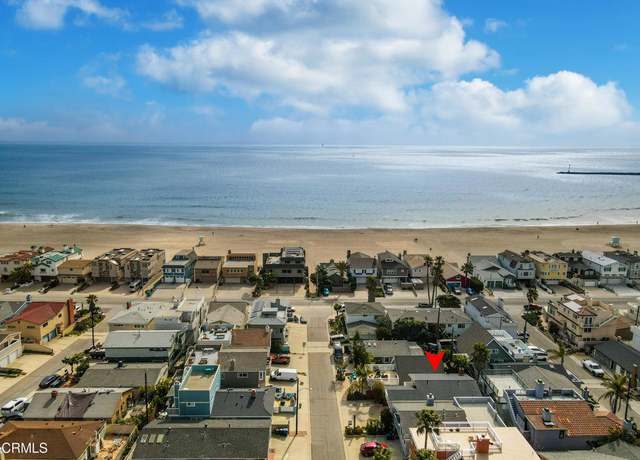
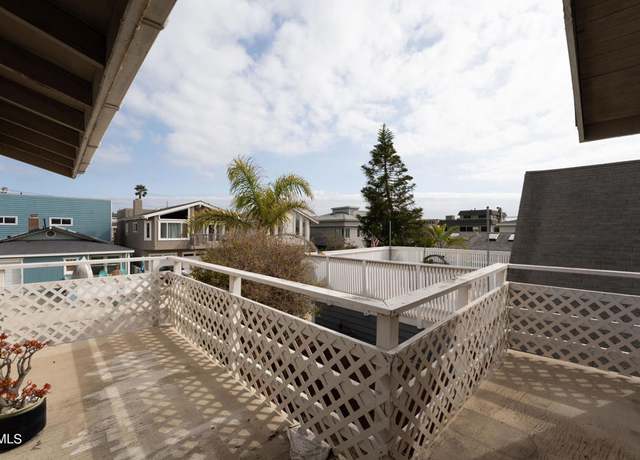
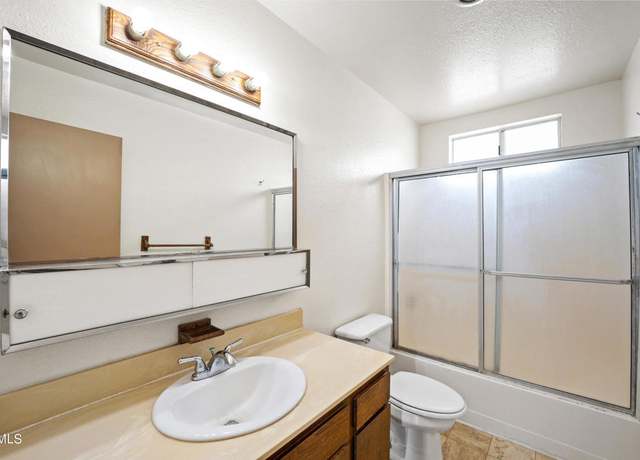
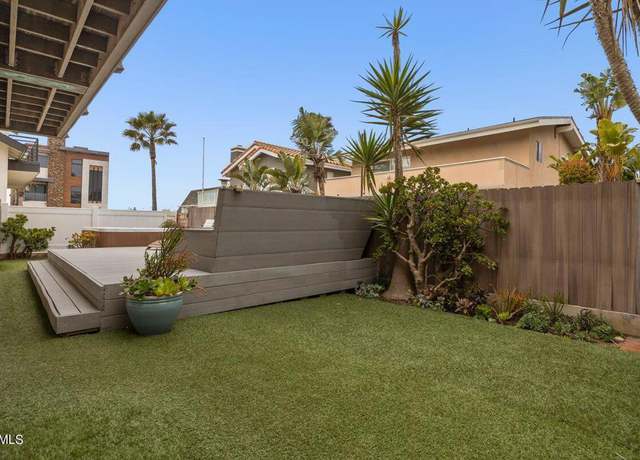
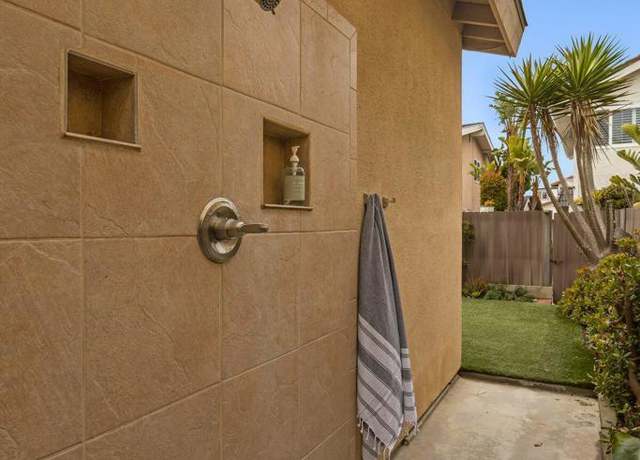
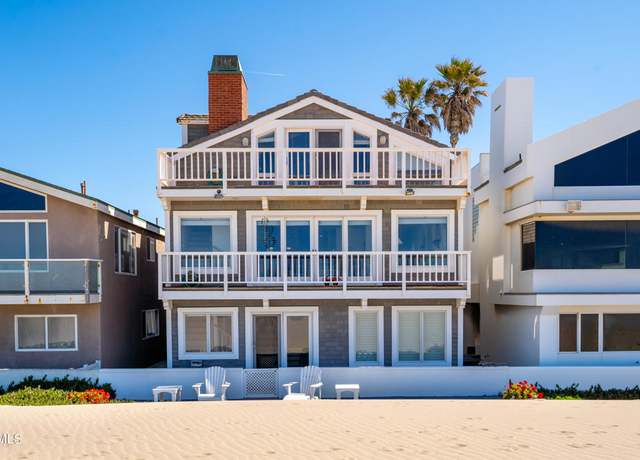
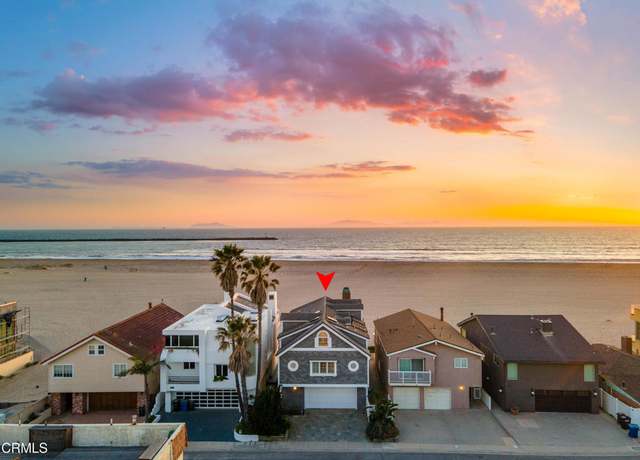
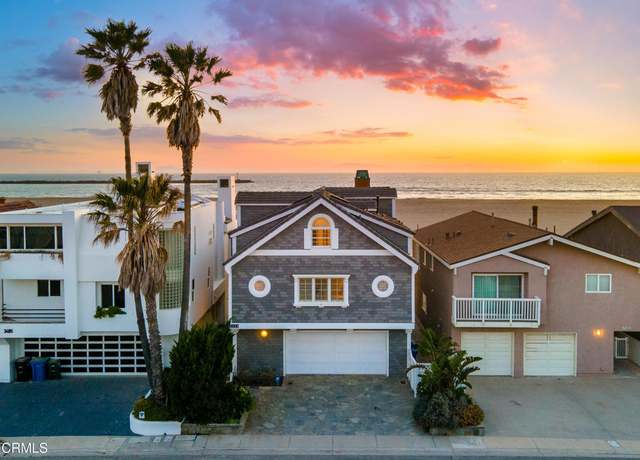
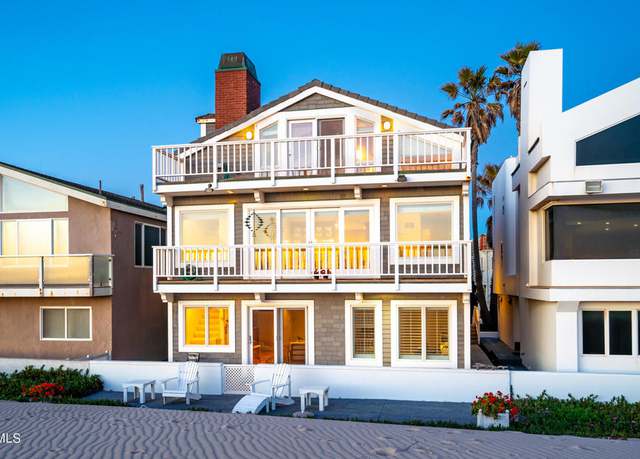
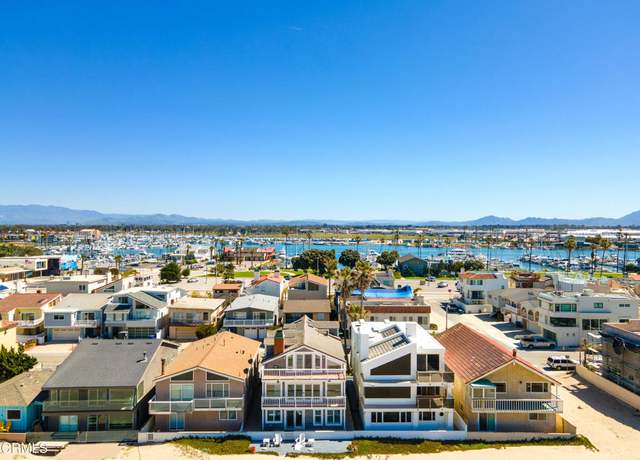
Silver Strand Beach home, just a stone's throw away from the glistening sand. Nestled on a picturesque street, this home exudes original charm and boasts an exceptional layout designed for both relaxation and entertainment. Step through the door and be greeted by the invigorating ocean breeze, beckoning you to unwind and embrace coastal living. The ground floor presents a cozy retreat, featuring one bedroom, one bath, and a welcoming family room perfect for quiet moments or lively gatherings. A quaint kitchenette and a brick fireplace add to the allure, creating a space where cherished memories are effortlessly crafted. The second level, discover two additional bedrooms, another bathroom, a
Introducing a luxurious townhouse in the heart of Oxnard, California, at 523 Garonne. This corner unit offers unparalleled elegance and comfort, featuring over 1,900 square feet of modernized living space. Step into a beautifully appointed interior with upgraded flooring throughout, creating a seamless flow from room to room. The master bedroom suite provides a private retreat, while the second and third bedroom have direct access to a Jack and Jill restroom for maximum convenience. Outside, the drought-tolerant front yard is a picturesque oasis, showcasing beautiful roses and a charming white picket fence. The front yard has been completely redone with new sod, with new valves, plants on d
Coastal living at its finest. .. stunning beach house just steps from the sand in the exclusive Mandalay Beach community in Oxnard, California. This beautifully renovated residence offers 2,944 square feet of living space, including 5 bedrooms, office and 2.5 baths with additional indoor and outdoor surf showers, providing exceptional space for relaxation and entertainment. Step inside to find a FIRST FLOOR, light-filled open living space with hardwood floors, and custom contemporary finishes. Livingroom features a sleek gas fireplace, creating a cozy atmosphere for gatherings. The adjacent kitchen has stainless steel appliances, barn door pantry, sparkling quartz countertops, extended buff
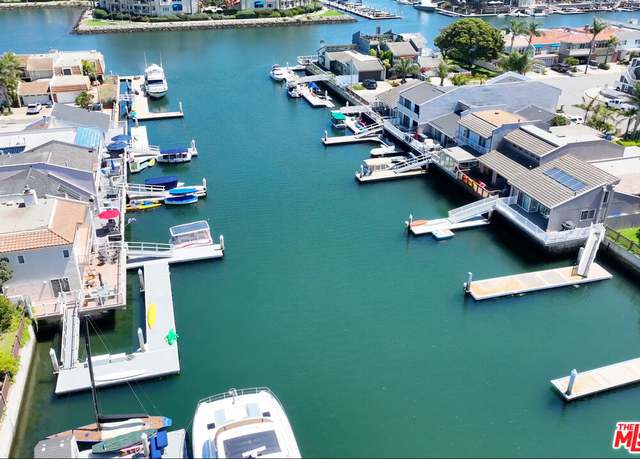
Waterfront Furnished Unique Gem in the channel Islands Harbor. Location!!Location!! Live the vacation lifestyle, Boat to restaurants, cruise the harbor, or a quick trip to the Channel Islands. Walk out the back door to your private dock that can easily accommodate a 40+ ft boat. Income Producing Potential. This special home has been extensively renovated and beautifully updated. The upper level features an open concept , large open kitchen and a main living area , fire place and a deck with the harbor views . A luxurious master suit, featuring harbor views from your private primary balcony. A bonus loft above kitchen/Dinning area functions as additional bedroom or office. A Beautiful Roof
Welcome to 740 E. Dollie St. This turnkey home is waiting for you! Some of the many features & upgrades this remodeled home offers include: 4 bedrooms, 2 bathrooms, a living room, and a family room with fireplace! Fresh interior/exterior paint, wood flooring throughout, tile flooring in kitchen & restrooms. The remodeled kitchen has granite countertops with New Stainless steel appliances. Master bedroom with spacious walk-in closet! Large concrete patio area in the backyard. Attached garage with direct access. Metal side gate doors. Block fence wall. Multiple mature fruit trees. Located across from the park. Just minutes from Oxnard College.
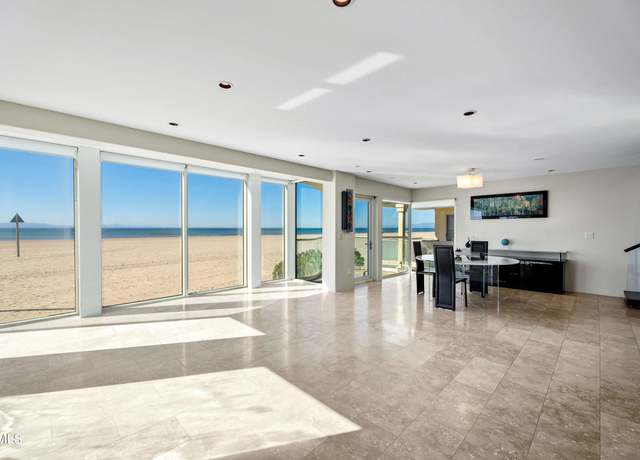
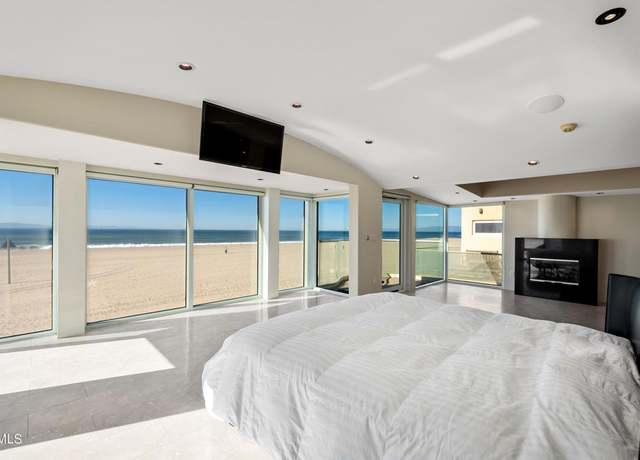
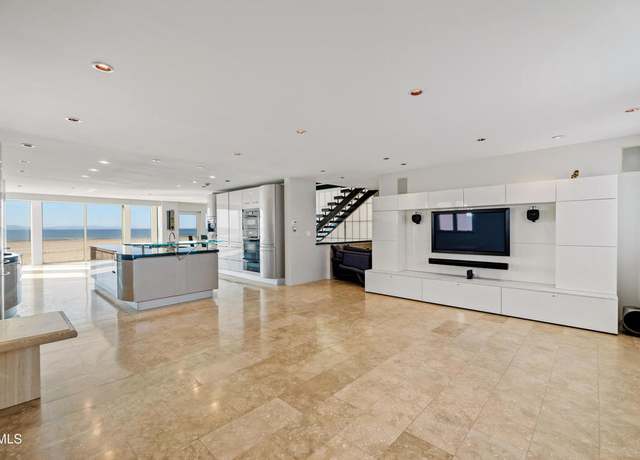
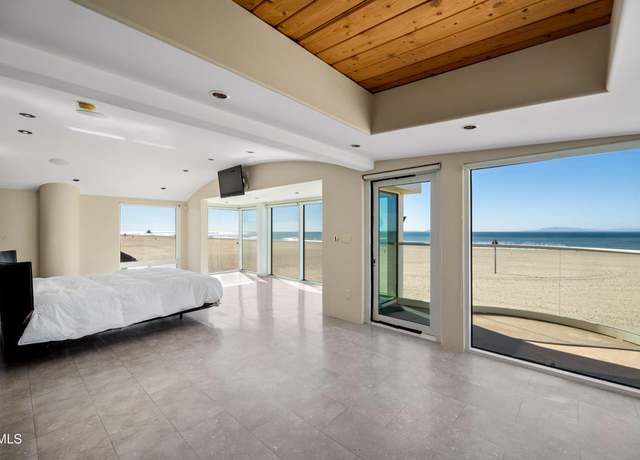
Welcome to Hollywood Beach, where the sun-kissed shores of California's golden coastline await just north of Malibu and south of Santa Barbara. Nestled in this idyllic setting lies a stunning beachfront home, perfectly positioned to capture the essence of seaside living. Built in 1991 and impeccably maintained, this residence offers a prime beachfront location & ELEVATOR with uninterrupted views of the majestic Pacific Ocean and the harbor entrance. From the moment you step inside, you're greeted by the soothing sounds of the ocean and the gentle sea breeze that whispers through Anderson windows, inviting you to relax and unwind in this coastal haven. Spread across three levels, this
Introducing a luxurious 4-bedroom, 3-bathroom retreat in the sought-after Mandalay Bay Village complex in the Via Marina neighborhood. just moments away from Seabridge Marina, pristine beaches and harbors. Recently renovated from top to bottom, this residence boasts modern upgrades including remodeled bathrooms, kitchen, flooring, and fresh paint throughout. The expansive master suite features a generous walk-in closet and a lavish en-suite bath with a soaking tub and shower. Upstairs, a spacious secondary upstairs bedroom offers a private balcony overlooking the tranquil pool and grounds. Convenience meets versatility with a first-floor bedroom/den and full bath, perfect for guests or adap
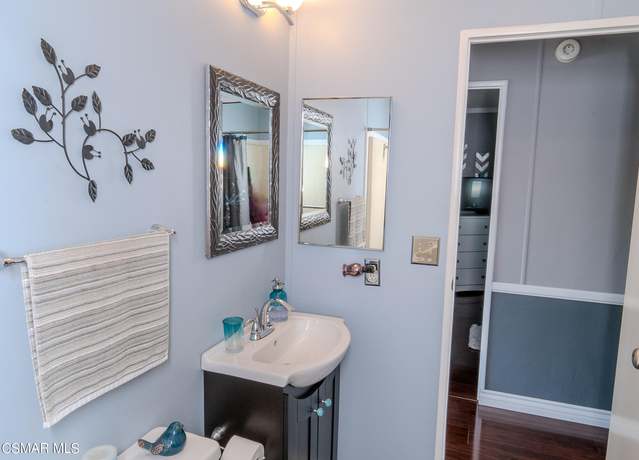
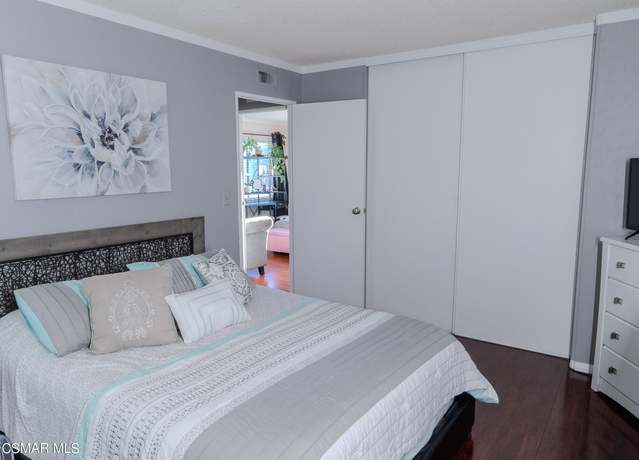
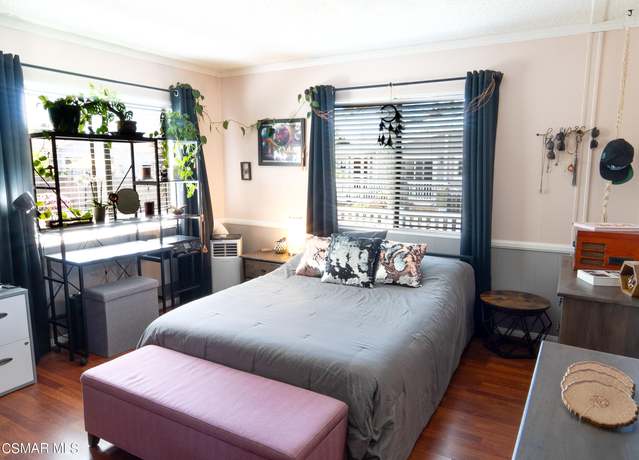
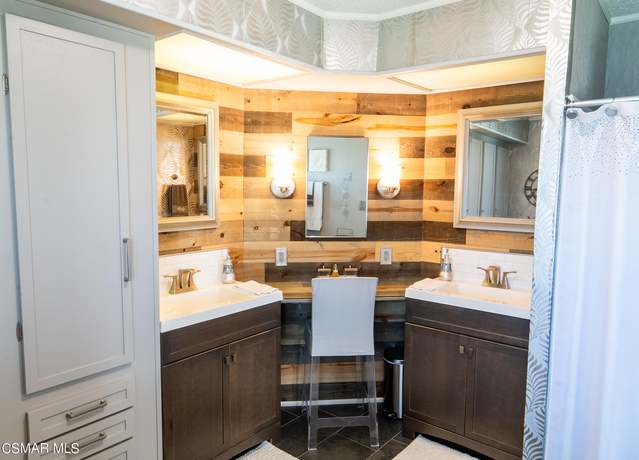
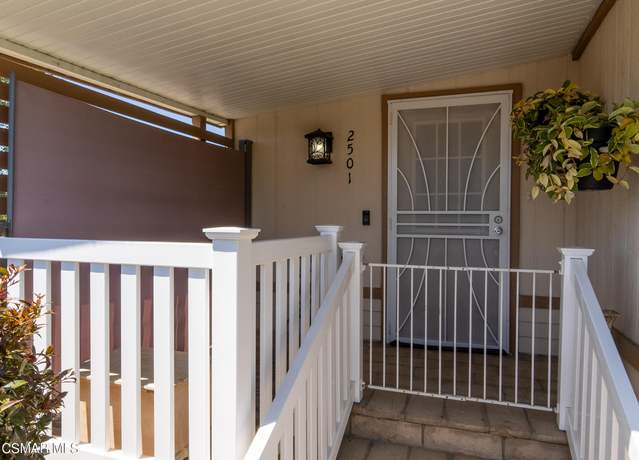
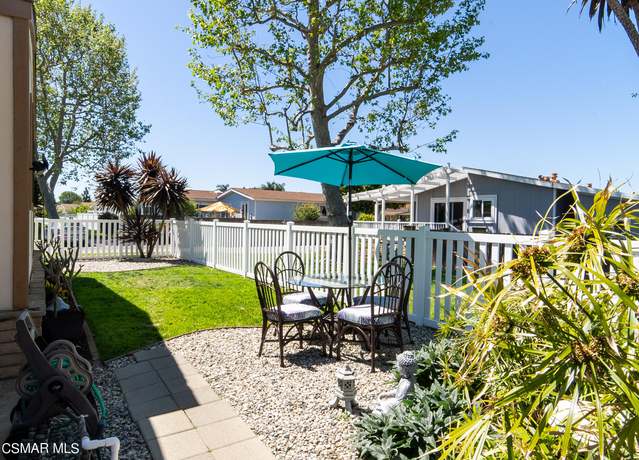
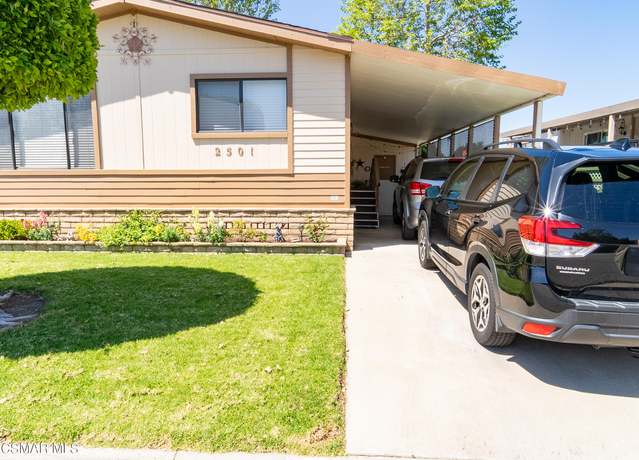
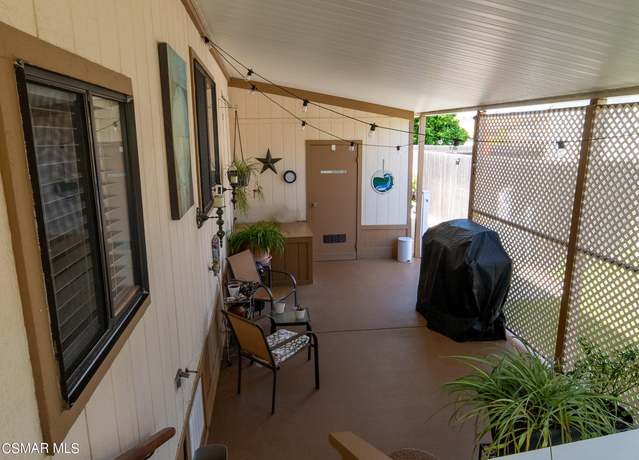
Nestled in the tranquil community of Meadow Lake, 2501 Dogwood Drive in North Oxnard offers a serene lifestyle with a year round ocean breeze and a sense of calm. This prime location provides easy access to the 101 freeway, as well as fine dining and shopping at The Collection at Riverpark and The Esplanade. Oxnard and state beaches are also just a short drive away. This triple-wide mobile home boasts an upgraded primary bathroom and fine wood-like flooring throughout, adding a touch of luxury to everyday living. The charming picket backyard fence adds to the quaintness of the home, while the interior decorative crown molding enhances its elegance. Situated as a single-story home with a lo
Welcome to this fantastic home with a great floor plan. Downstairs features an open living area with a gorgeous stone fireplace, Dinning area, kitchen, laundry area, 2 car garage, re-done patio and Upper1/2 bathroom. Upper-level features, 3 great bedrooms, one of the bedrooms has custom made closet, main bedroom has a walking closet and a wall-to-wall closet, 2 full bathrooms and a spacious family room/office. New carpet was put on about a year ago, custom-made railing, newer cabinet handles throughout, re-done patio flooring. Pool & jacuzzi (community). Located close to shopping, schools, freeway and 5 mins to the beach.
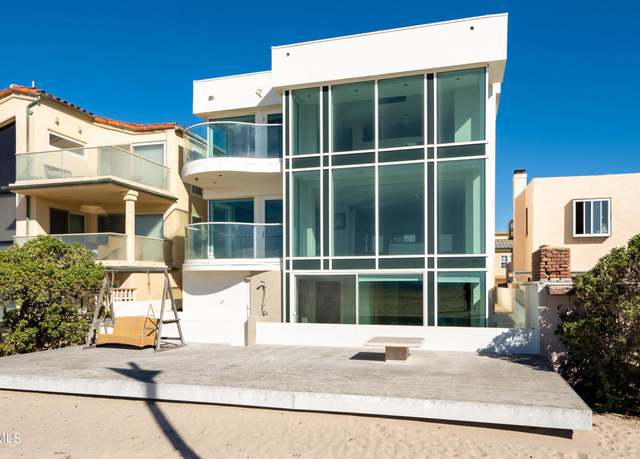
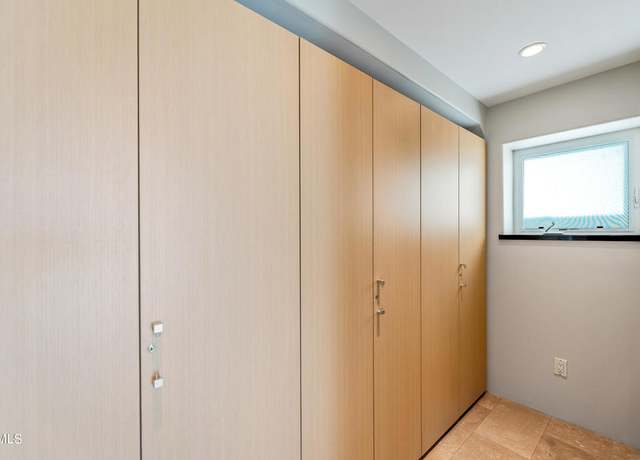
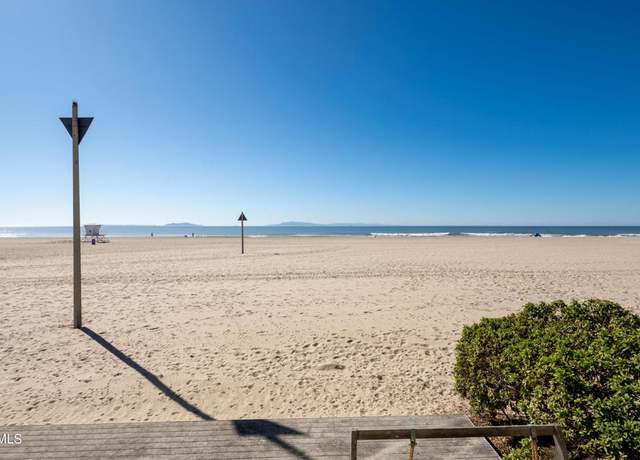
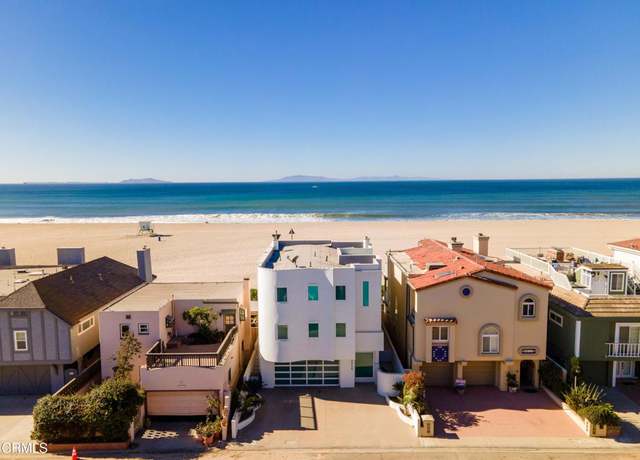
Hollywood beach oceanfront Modern masterpiece. Stunning open concept custom built home, with Italian cabinetry, radiant heated floors & floating glass staircase. Owner built this home with lots of love and attention to detail!!! Your chef will love this open kitchen with Snaidero kitchen cabinetry, Meile appliances, center island and stone countertops. Ocean and Island views from almost every room in the home. Master bedroom encompasses the 3rd level, you feel as if you're on a tropical vacation. Wake up to the ocean views, waves crashing, passing boaters and sea life. Hollywood beach is a sweet beach North of Malibu and South of Carpentaria. This sweet town offers restaurants, pubs,
Located between Malibu and Santa Barbara, walking distance to the sandy shores of a pristine beach, there stands a charming single-story condo, a haven of relaxation and recreation for those seeking the perfect coastal getaway as an exclusive primary residence or a second home. With its prime location and abundance of amenities, it's a paradise waiting to be discovered. This single-story, end unit condo, boasts a spacious open floor plan seamlessly blending the living room, dining and kitchen areas. As you step through the front door, you're greeted by a bright and airy living space with fresh paint and new wood-like flooring. Features include a wet bar, den, large living room with fireplac
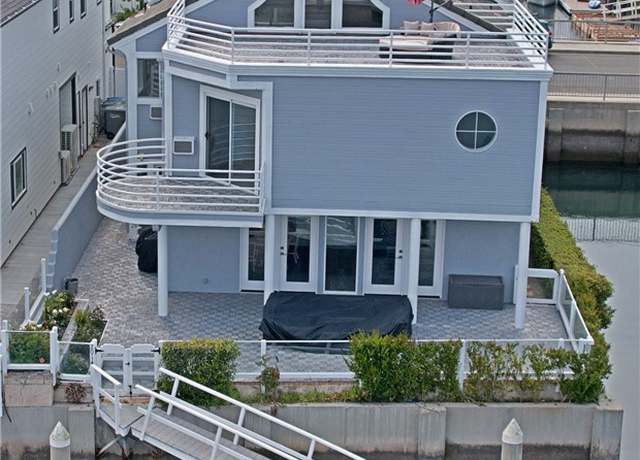
Beach Duplex with Ocean and Marina VIEWS! Your beach vacation is calling! Vacation in one unit and rent the other unit. Perfectly located a block to the beautiful and quiet Hollywood Beach and across the Channel Islands Harbor. This duplex features 3 beds and 2 baths EACH unit with 2 beds and 1 bath downstairs. Upstairs is the kitchen, living room, dining area, and primary suite. One unit has OCEAN VIEWS from the primary suite. The large windows in the dining area bring in an abundance of natural light while having an amazing marina view. The rooftop deck is perfect for your evening cocktails or morning coffee to take in the coastal, marina, and mountain views. Enjoy the California sunshine
Welcome to a slice of paradise! Delivered vacant and nestled on the pristine sands of Hollywood Beach, this stunning property boasts breathtaking ocean and island views, offering a unique opportunity for beach living at its finest. Whether you're seeking a spacious retreat, an income-generating investment, or the chance to realize the visionary architectural and approved plans of the current owner, this is your chance to own a piece of Hollywood Beach's coveted real estate. Hollywood Beach is renowned for its natural beauty, offering a serene and idyllic coastal lifestyle that allows you to escape the hustle and bustle of everyday life. Situated on a peninsula between Hollywood Beach and Ch
School data is provided by GreatSchools, a nonprofit organization. Redfin recommends buyers and renters use GreatSchools information and ratings as a first step, and conduct their own investigation to determine their desired schools or school districts, including by contacting and visiting the schools themselves.Redfin does not endorse or guarantee this information. School service boundaries are intended to be used as a reference only; they may change and are not guaranteed to be accurate. To verify school enrollment eligibility, contact the school district directly.
Buy the right home at the right price near Oxnard with a local Redfin real estate agent.
Homes for sale in Oxnard have a median listing price of $769K. Some of these homes are Hot Homes, meaning they're likely to sell quickly.
What are some of the most popular neighborhoods in Oxnard?
Popular neighborhoods include Channel Islands, Hollywood Beach, Wagon Wheel, Oxnard Shores, Silver Strand, Silverstrand, Madeira Beach Yacht Club Adult Condominiums, Northwest Oxnard, Colony at Mandalay Beach, and Riverpark.
How often does Redfin update their new listings?
Most of our new listings in Oxnard are updated every 5 minutes so you can see new homes as soon as they come on the market. Learn more
What is transportation like in Oxnard?
Oxnard, California boasts a well-structured transportation system with a variety of options for residents. The city experiences moderate traffic levels, making commuting by car a common choice for many. Public transportation is available, with Oxnard Transit Center serving as a major hub for bus and rail services. Additionally, Oxnard is conveniently located near several major highways, including U.S. Route 101 and State Route 1, providing easy access for car travel to nearby cities. Learn more on our Oxnard city guide.
What types of properties are available in Oxnard?
Oxnard, California offers a variety of single-family home types, including ranch-style homes, contemporary homes, and Mediterranean-style homes, among others. These homes can be found throughout the city, with some located in desirable neighborhoods like Silver Strand and Hollywood Beach. Most properties feature 2-4 bedrooms and were built within the past 20 years. To explore different property types for sale in Oxnard, California, use the 'Home type' filter located above the active listings. Customize your search by selecting options like single-family homes, condos, townhomes, and more.
What is life like in Oxnard?
Living in Oxnard, California offers a unique experience with its diverse range of landscapes, from stunning coastline to picturesque farmlands. The weather is characterized by mild winters and warm summers, providing ample opportunities to enjoy outdoor activities year-round. The city boasts a thriving job market, with a range of industries such as agriculture, manufacturing, and healthcare. Residents can engage in various recreational pursuits, including water sports, hiking, and exploring local parks. Oxnard also offers a vibrant cultural scene, with numerous festivals, art galleries, and community events throughout the year.
What are the schools and amenities like in Oxnard?
Oxnard, California, is a city rich in public amenities that cater to the diverse needs of its residents. It boasts a plethora of restaurants, offering a wide range of cuisines to satisfy all types of food enthusiasts. The city is also home to numerous parks, providing serene environments for relaxation and leisure. A variety of grocery stores are spread throughout the city, ensuring convenient access to daily essentials for all residents. Additionally, Oxnard offers other amenities such as fitness centers, libraries, and shopping centers, enhancing the overall quality of life in the city.
In the past month, 54 homes have been sold in Oxnard. In addition to houses in Oxnard, there were also 56 condos, 22 townhouses, and 6 multi-family units for sale in Oxnard last month. Oxnard is a moderately walkable city in California with a Walk Score of 57. Oxnard is home to approximately 196,160 people and 52,486 jobs. Find your dream home in Oxnard using the tools above. Use filters to narrow your search by price, square feet, beds, and baths to find homes that fit your criteria. Our top-rated real estate agents in Oxnard are local experts and are ready to answer your questions about properties, neighborhoods, schools, and the newest listings for sale in Oxnard. Our Oxnard real estate stats and trends will give you more information about home buying and selling trends in Oxnard. If you're looking to sell your home in the Oxnard area, our listing agents can help you get the best price. Redfin is redefining real estate and the home buying process in Oxnard with industry-leading technology, full-service agents, and lower fees that provide a better value for Redfin buyers and sellers.


 REDFIN IS COMMITTED TO AND ABIDES BY THE FAIR HOUSING ACT AND EQUAL OPPORTUNITY ACT. READ REDFIN'S FAIR HOUSING POLICY AND THE NEW YORK STATE FAIR HOUSING NOTICE.
 United States
 Canada