Welcome to 223 Minerva Avenue, a meticulously maintained single-level charmer nestled in the serene surroundings of the sought after Vallemar neighborhood in Pacifica. This elegant residence boasts 3 bedrooms and 3 full bathrooms, a dining room, living room and family room offering a comfortable and inviting ambiance for discerning homeowners. Upon entering, you are greeted by a thoughtfully designed floor plan that seamlessly integrates the living spaces. The interior is adorned with an abundance of natural light, creating a warm and inviting atmosphere throughout. The kitchen is a culinary delight, featuring modern appliances and ample storage, perfect for creating gourmet meals and enter
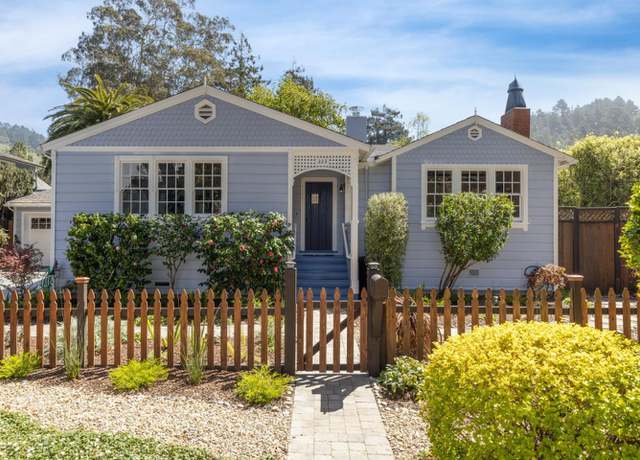
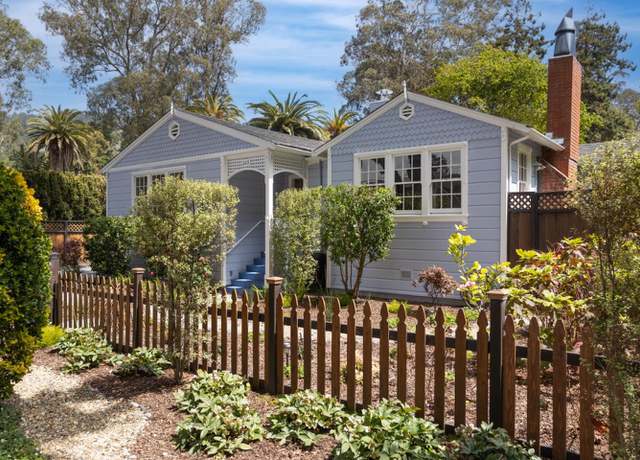
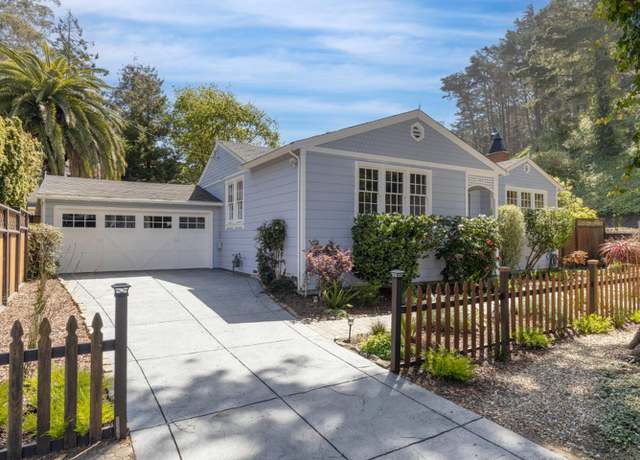
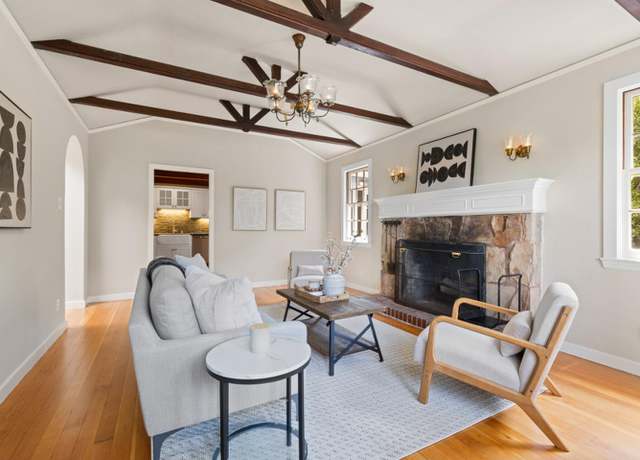
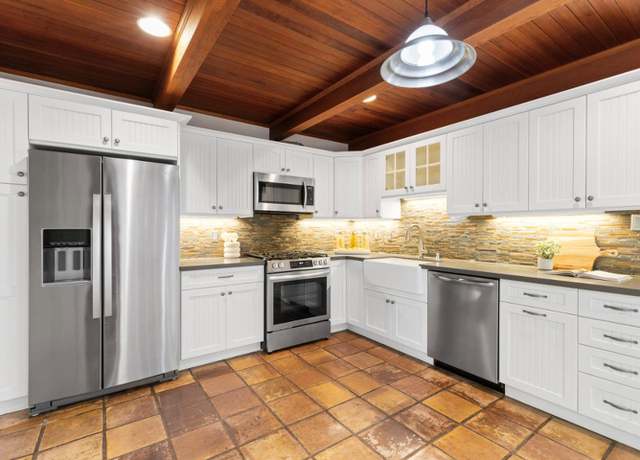
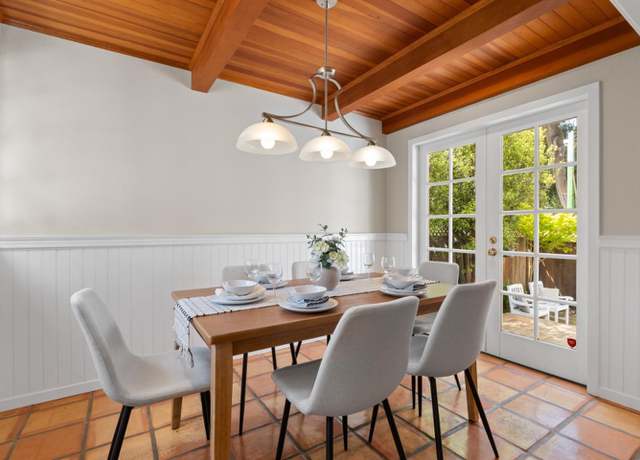
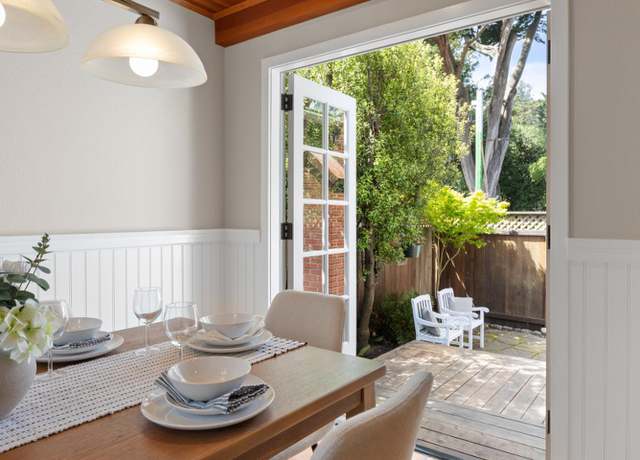
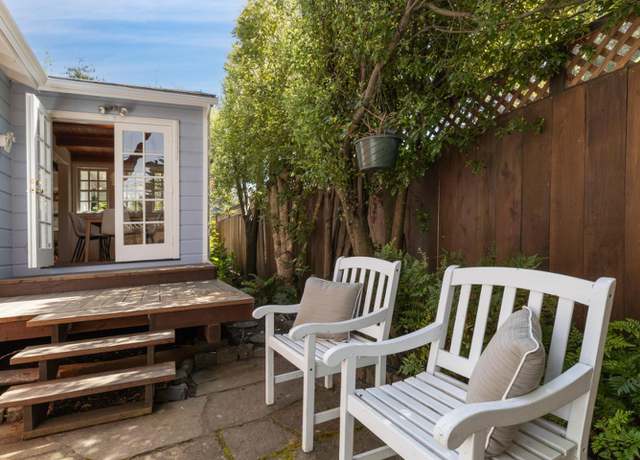
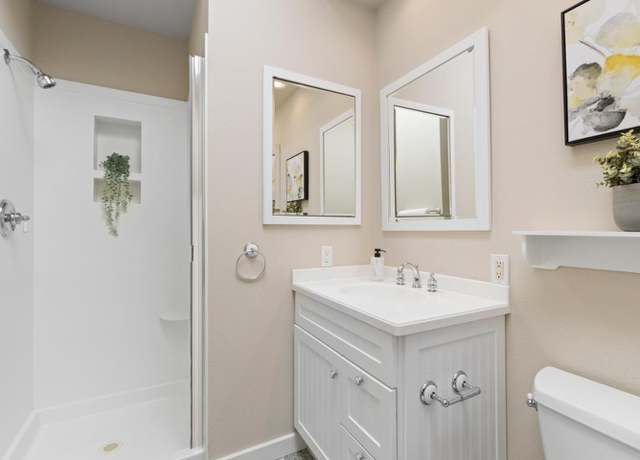
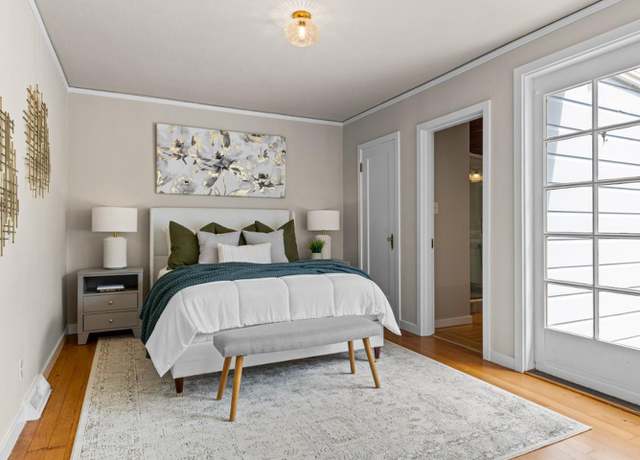
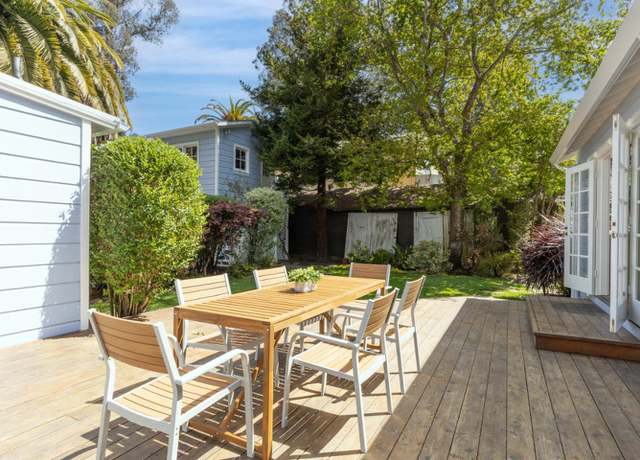
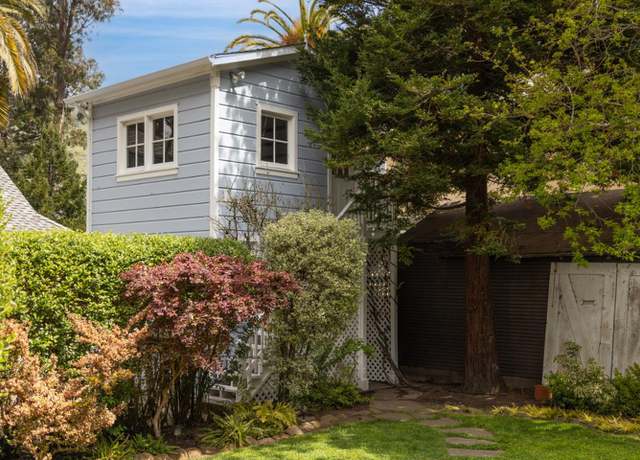
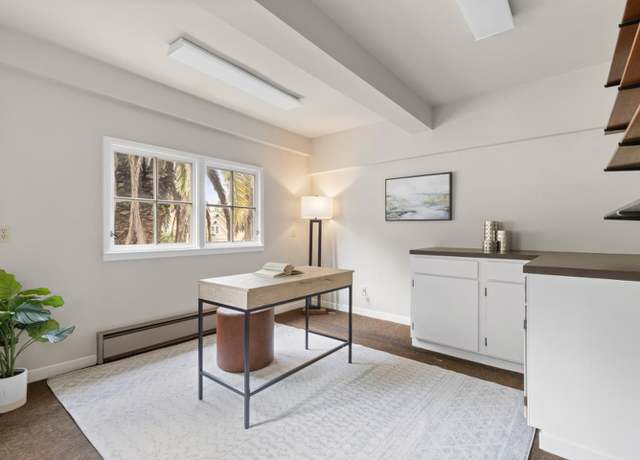
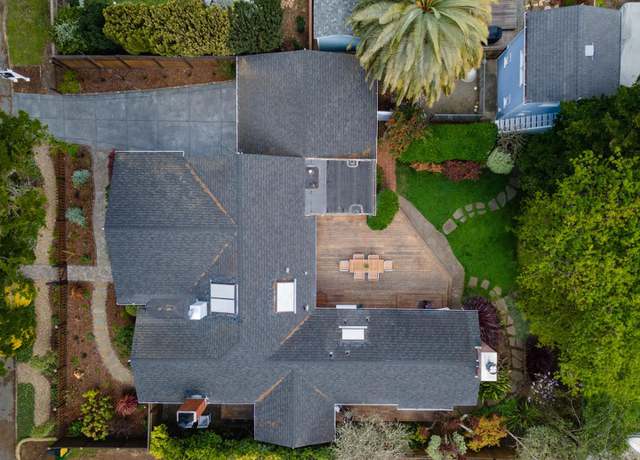
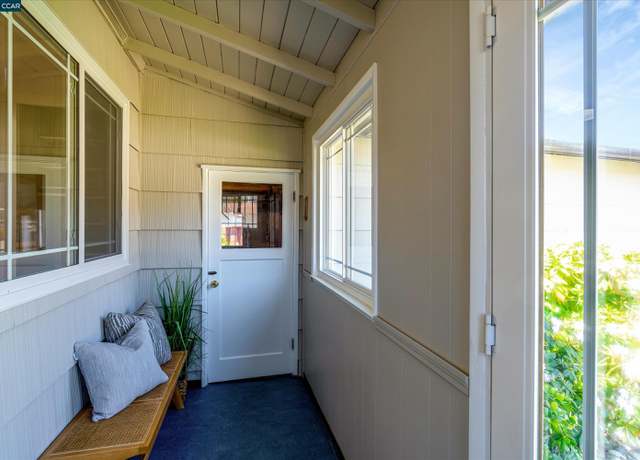
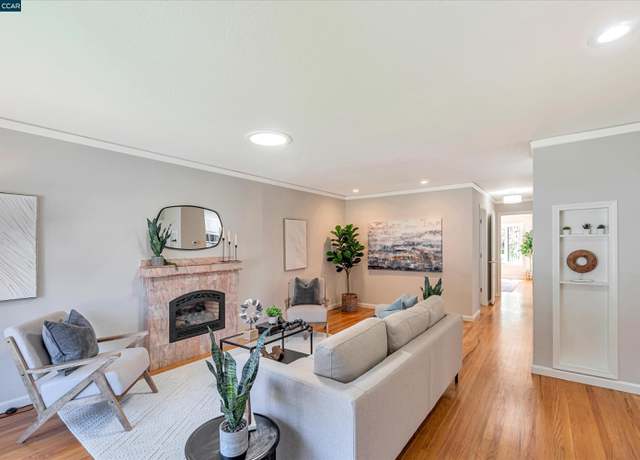
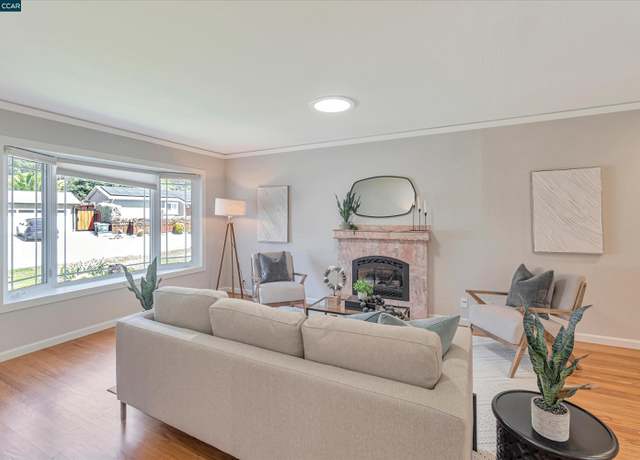
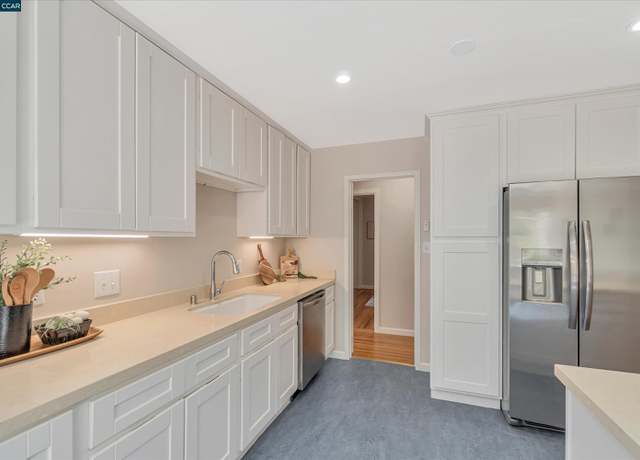
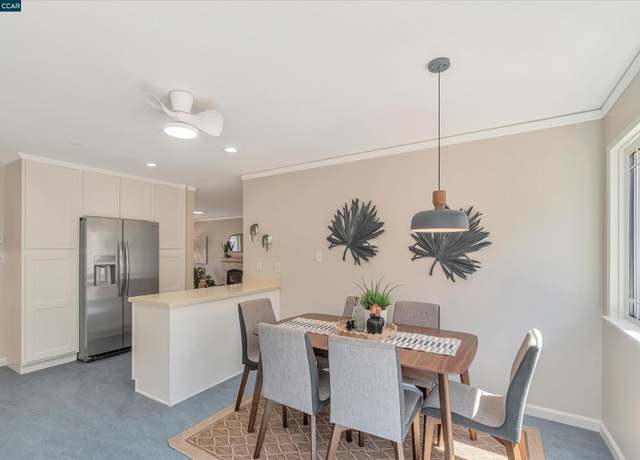
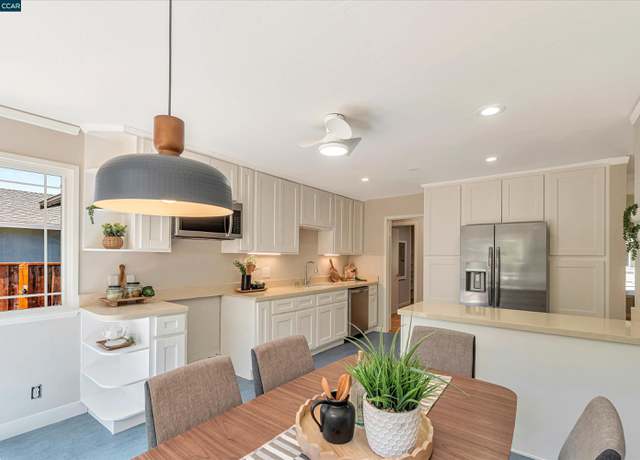
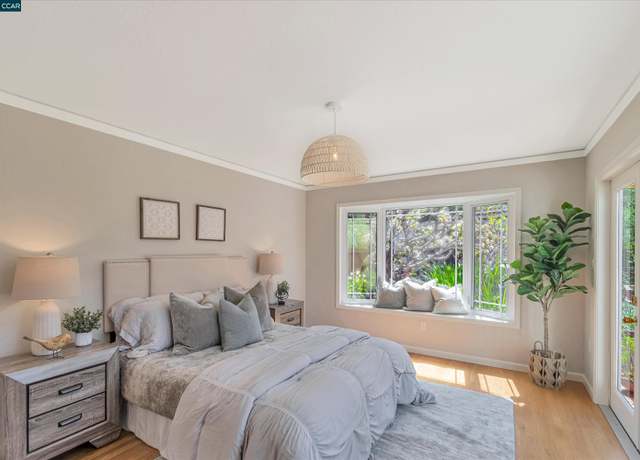
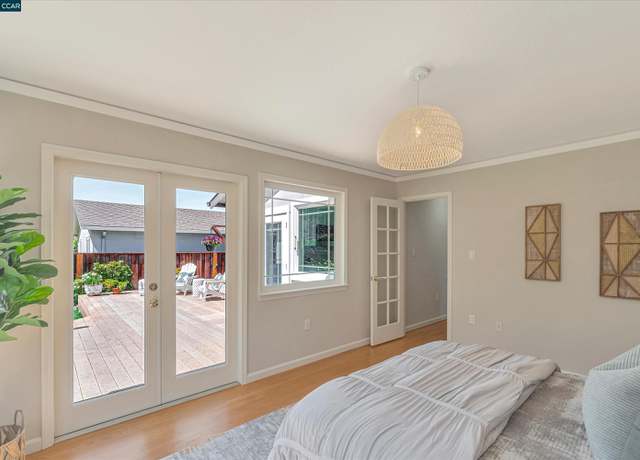
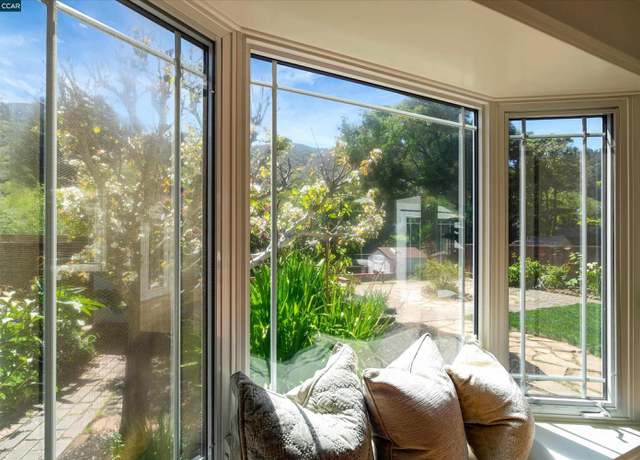
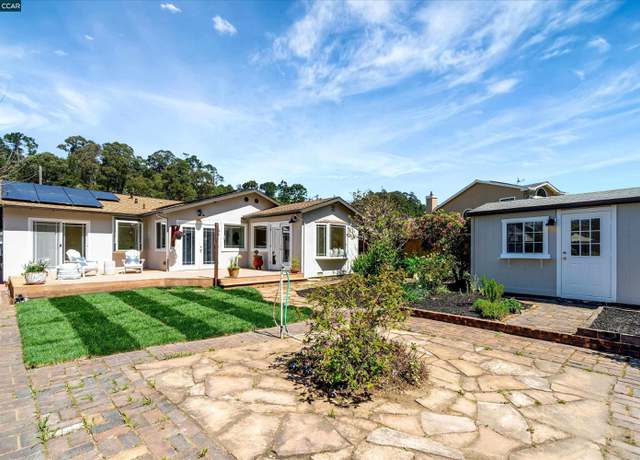
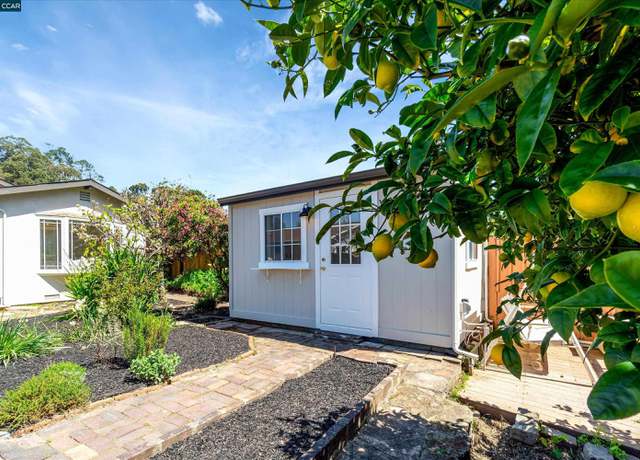
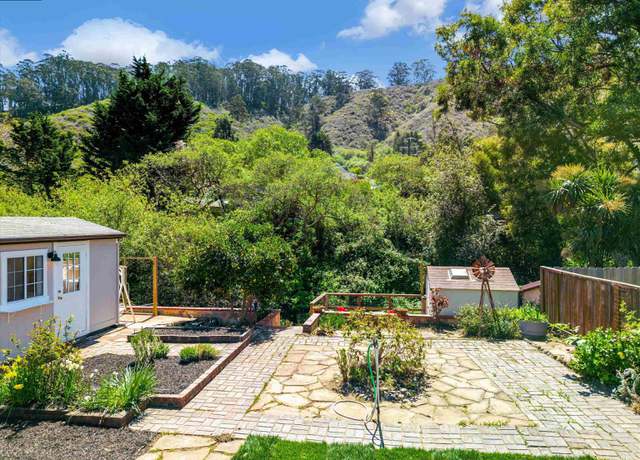
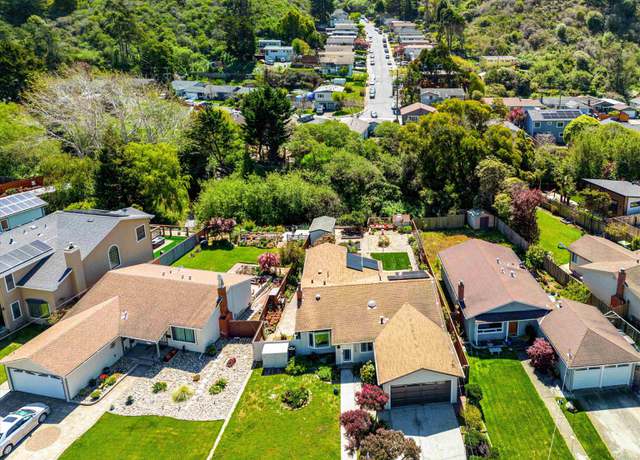
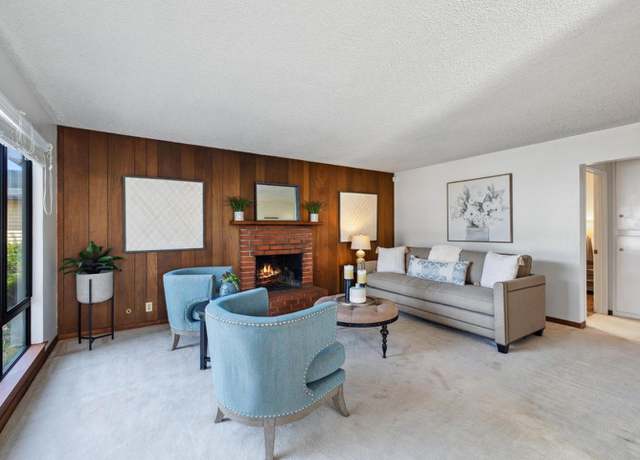
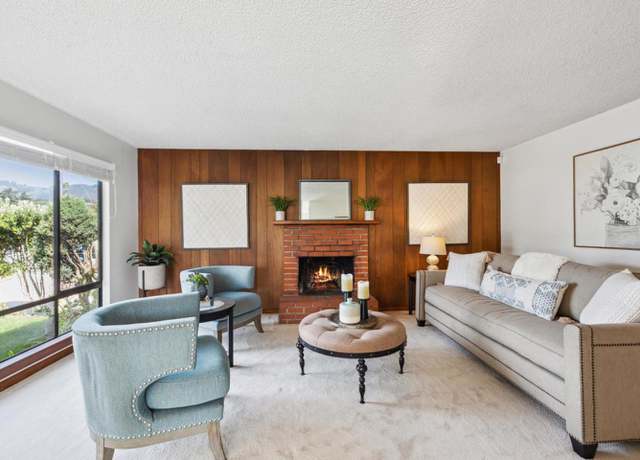
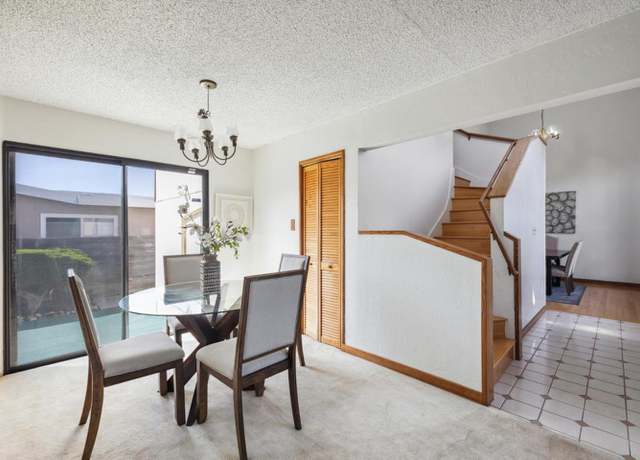
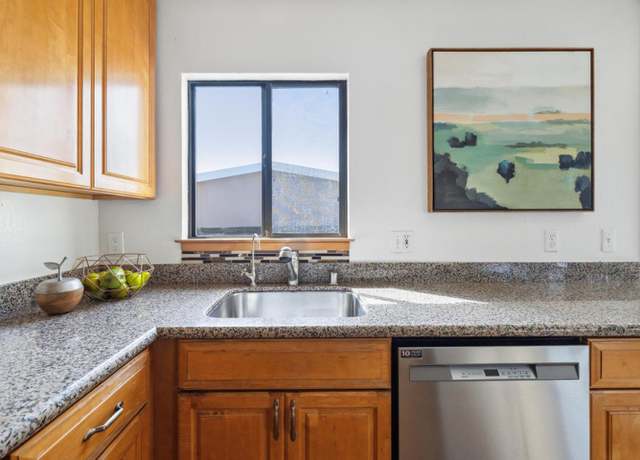
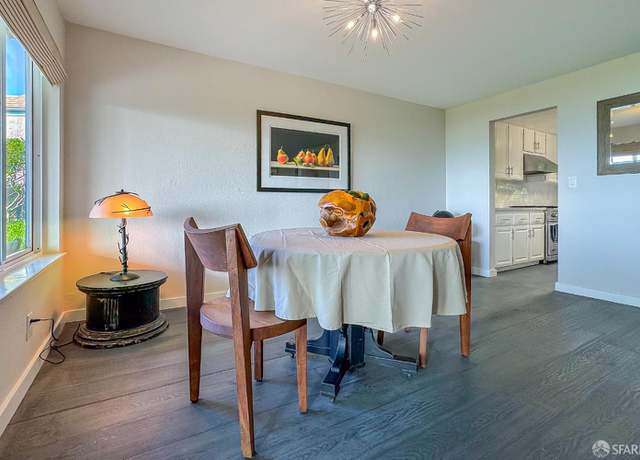
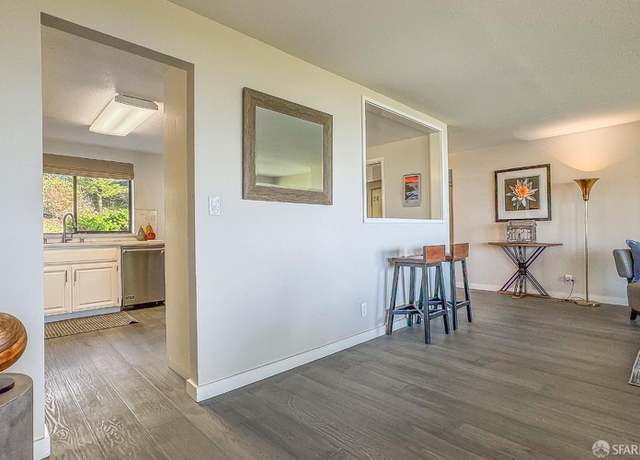
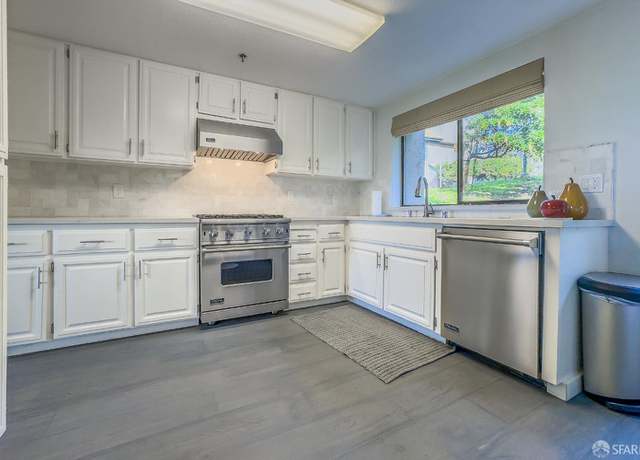
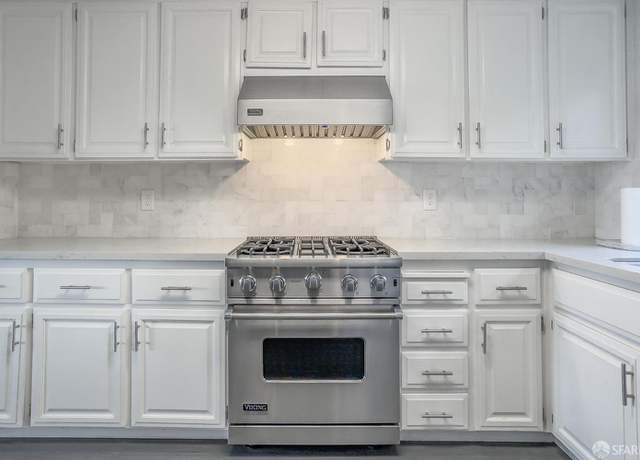
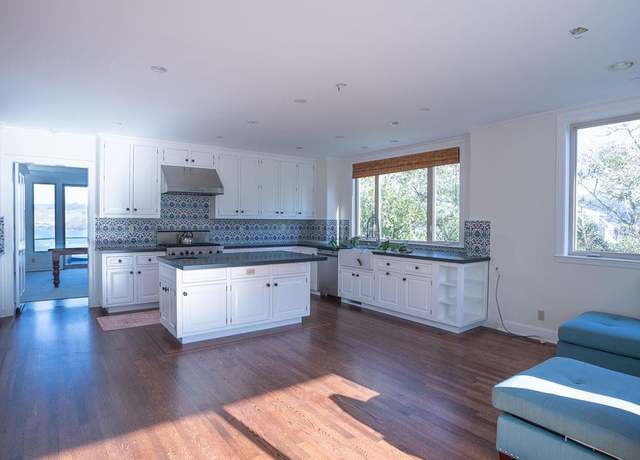
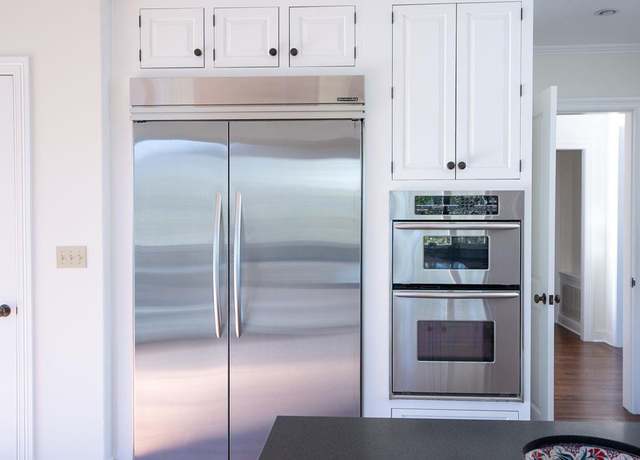
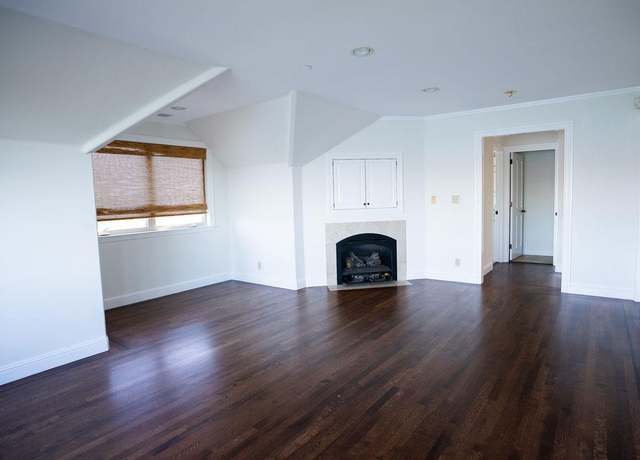
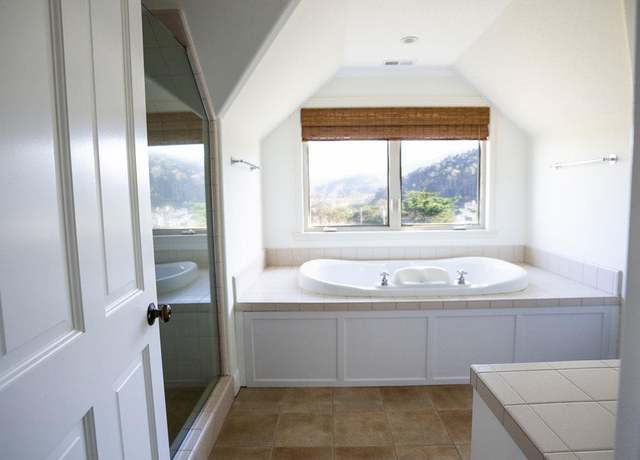
This cute storybook home is tucked away in the back of sunny Linda Mar. Sitting on a large lot and backing to a babbling creek this homes’ yard is an oasis you will not want to leave! A private deck overlooking the creek area creates a tranquil space to relax & recharge in, all while taking in the beautiful mountain views. Inviting living room features large picture window, cozy gas fireplace & hardwood floors! Renovated kitchen is complete with upgraded white cabinets, slab counters, new stainless steel appliances, partial heated floors & a peninsula with added storage. Sunny dining area overlooking rear deck, yard & garden. Spacious primary bedroom w/ large w
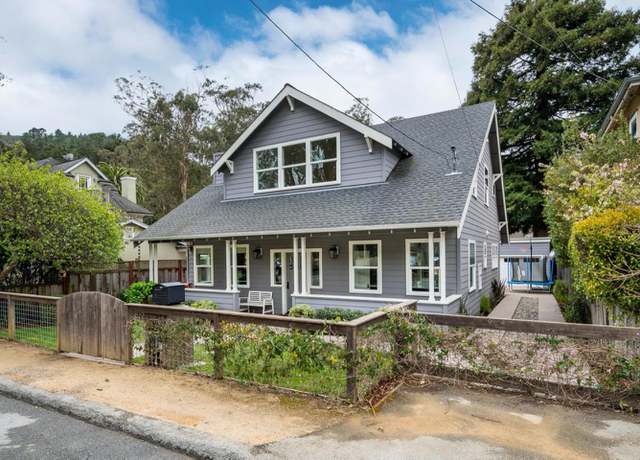
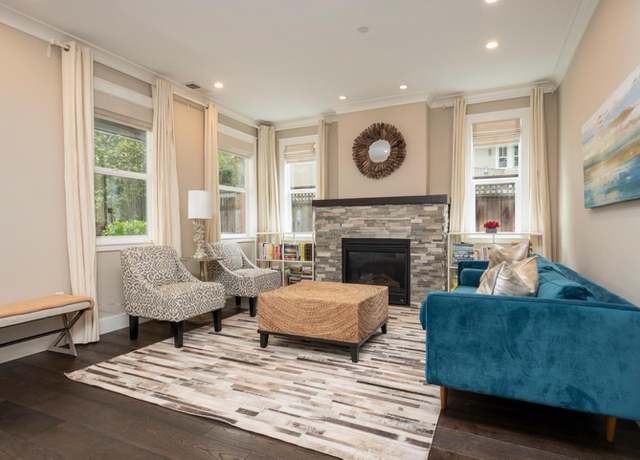
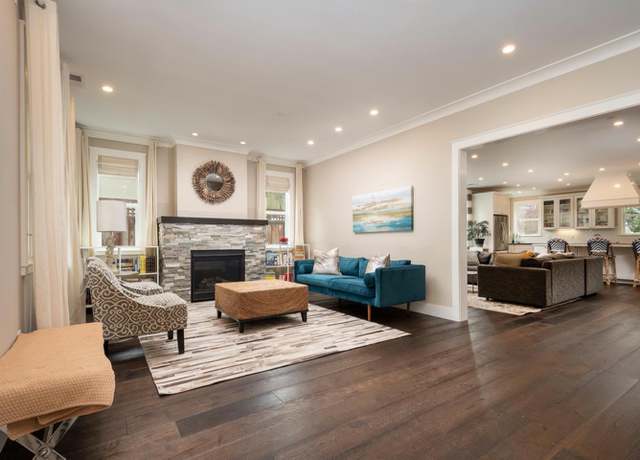
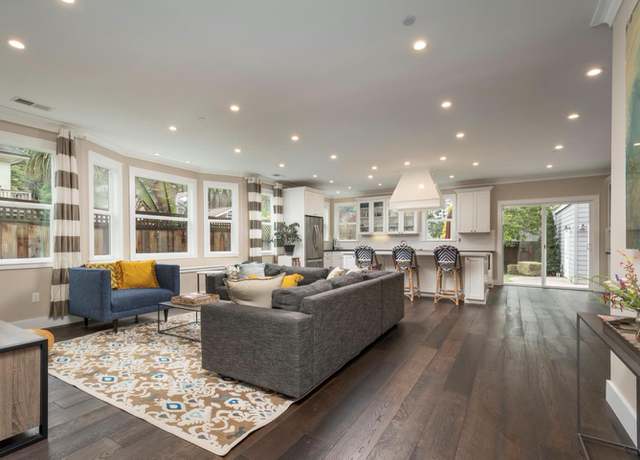
Immerse yourself in luxury living at this stunning 4-bedroom plus 2-office haven in sought-after Vallemar! Built in 2015, this expansive home offers the perfect blend of functionality and modern design. Imagine cozy evenings curled up by the gas fireplace in the formal living room. The open floor plan seamlessly flows into a grand space, featuring a large family room, a dream kitchen with high-quality quartz countertops and stainless steel appliances, and a spacious dining area perfect for entertaining. The conveniently located first-floor bedroom with a full bathroom provides a private space for visitors. Upstairs, the luxurious primary suite awaits featuring a beautiful marble bathroom,
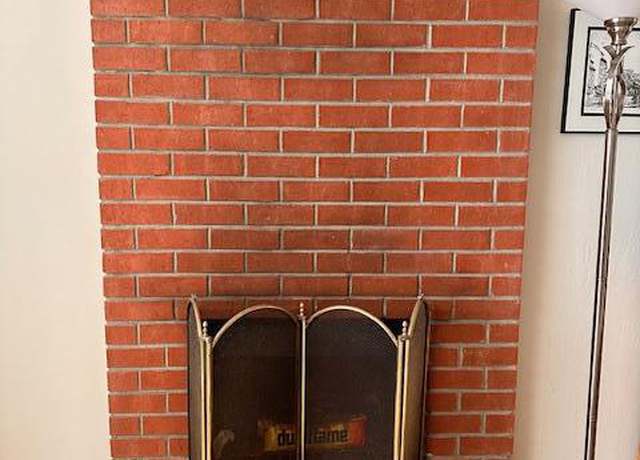
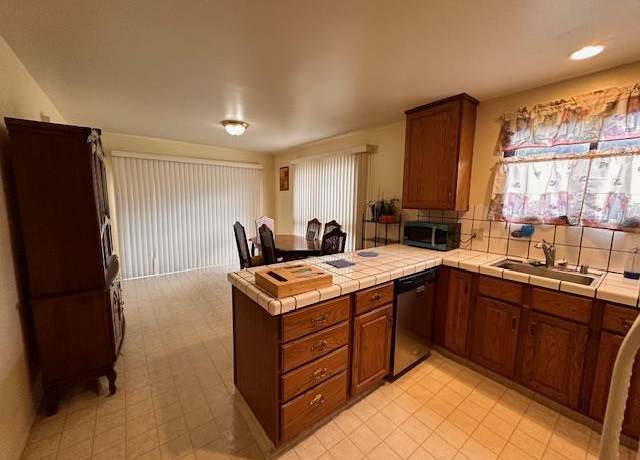
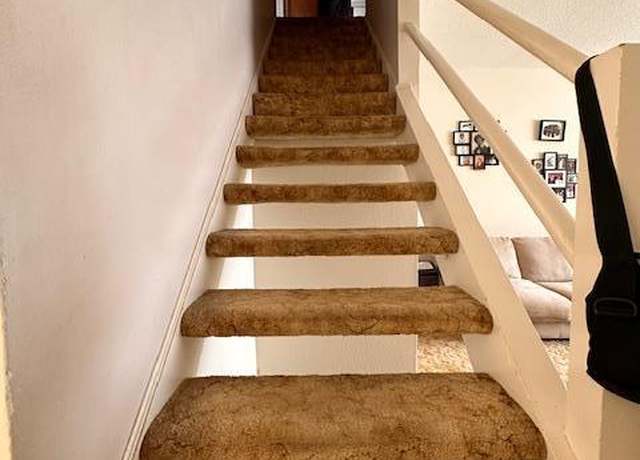
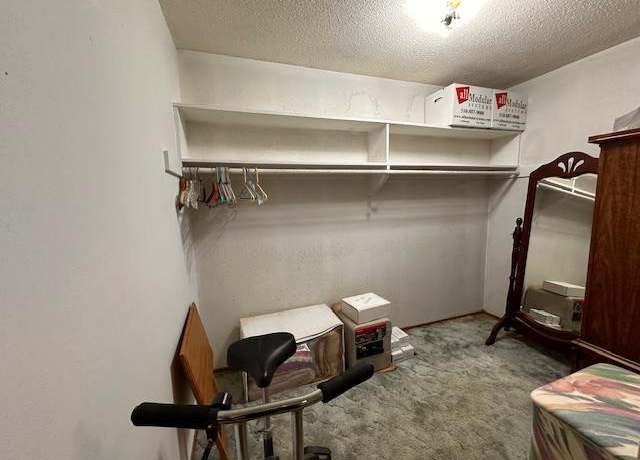
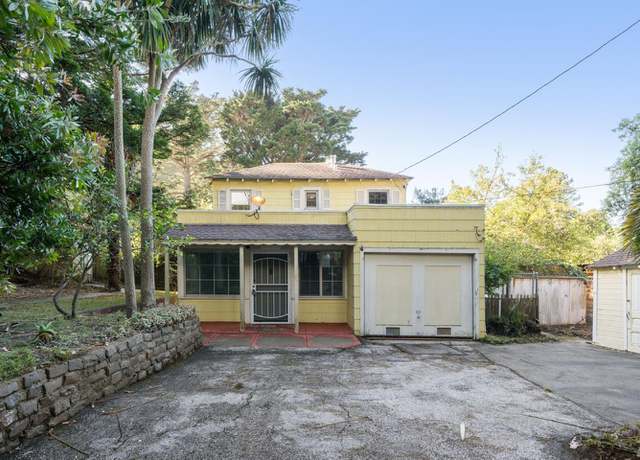
Welcome to this one-of-a-kind gem, hitting the market for the first time since 1969! This four-bedroom, two-and-a-half-bathroom home has been preserved in its delightful original condition, presenting a unique canvas just bursting with potential. Property Highlights: Vintage Vibe: those carpets to the acoustic ceiling, this home is a nostalgic nod to the past. It's the perfect backdrop for those with an eye for design and a penchant for projects. Spacious Layout: Featuring a generous kitchen area w/ eat-in kitchen, and living room with a cozy fireplace to reimagine and renovate. Sleeping Quarters: The primary suite includes walk in closet, vanity area and full bath just waiting for your eye
This lovely property in Pacifica's highly desirable Fairway Park is now available! The path to the 2-door entry follows a well-manicured lawn and garden. Open Cathedral-ceilinged entry and formal dining room welcome you with vivid light from 2-storied windows. This 6-bedroom, 3-bathroom home features an open living room, dinette, kitchen and large walk-in pantry. A sliding-glass door leads from the dinette to a patio and well-established yard and garden. The remodeled kitchen features new stainless-steel appliances. The living room with wood burning fireplace and large picture windows allow natural light into the home. 3 of the 6 bedrooms are located on the 1st floor including a spacious ma
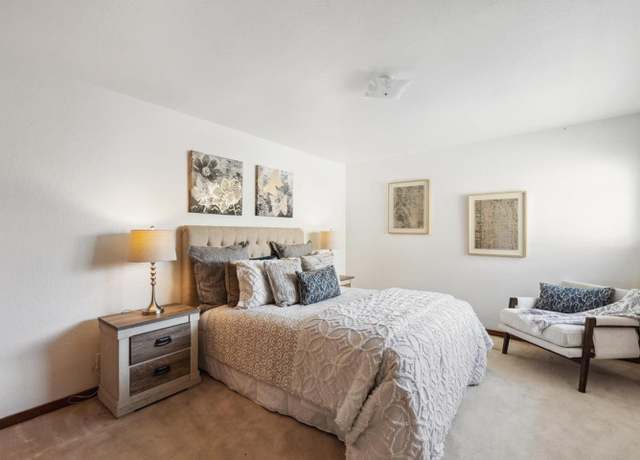
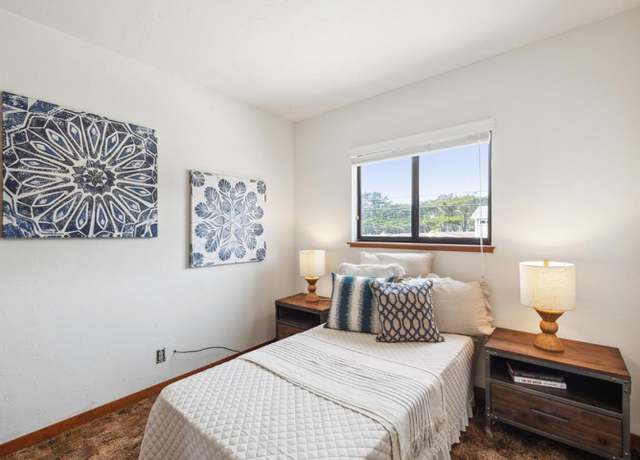
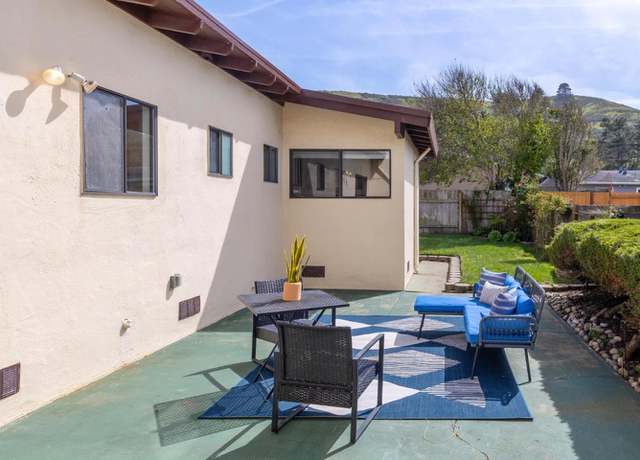
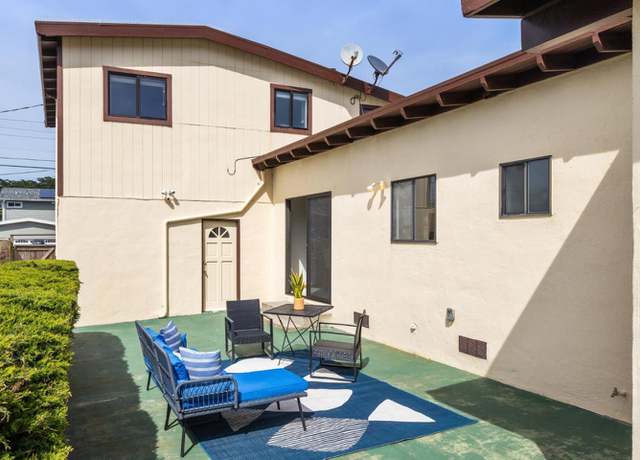
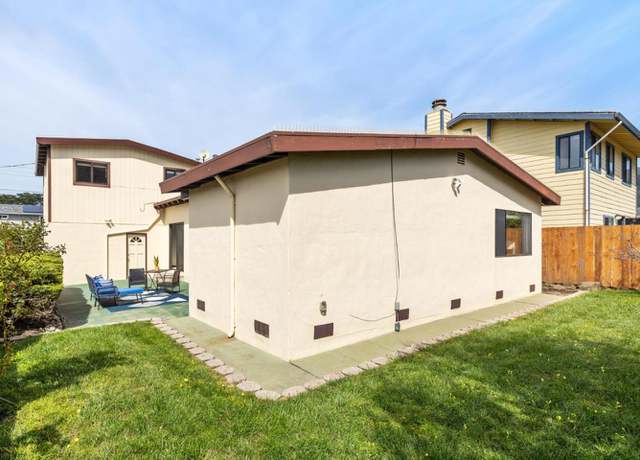
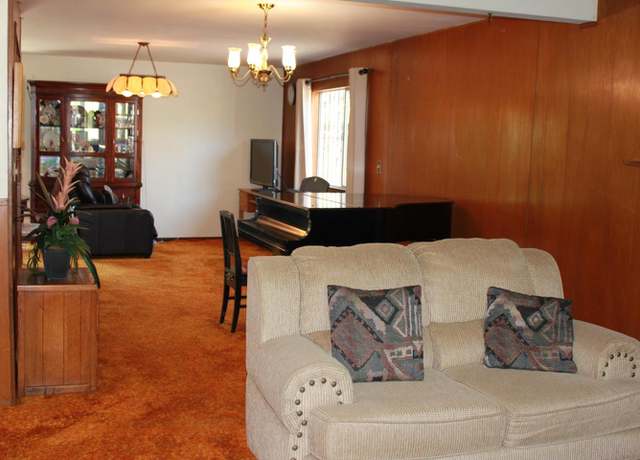
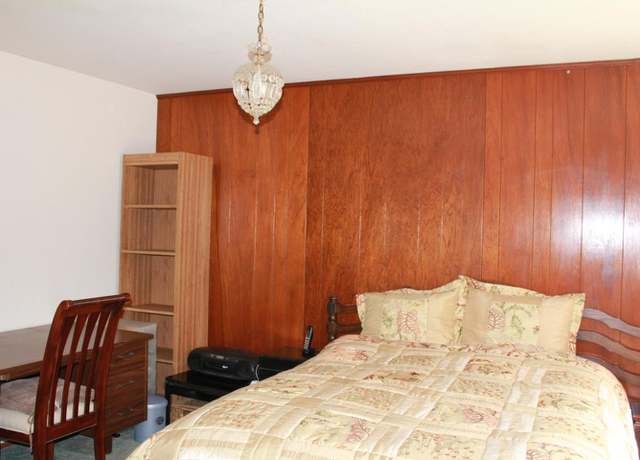
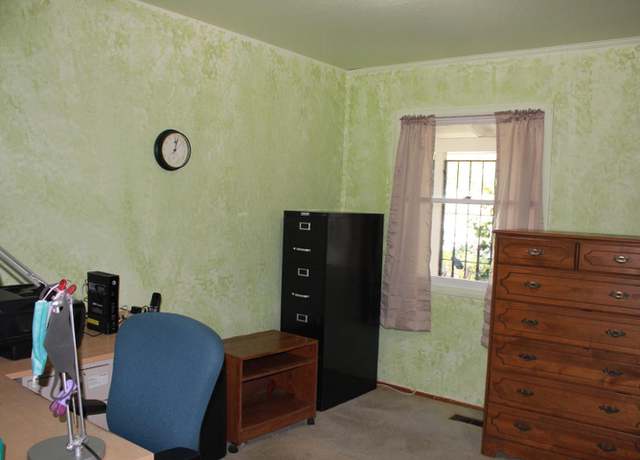
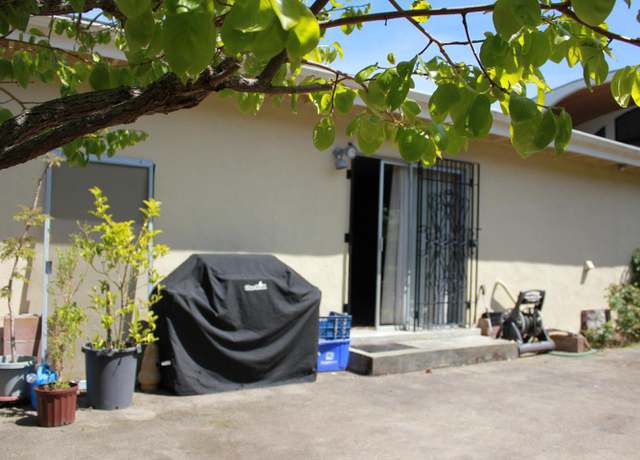
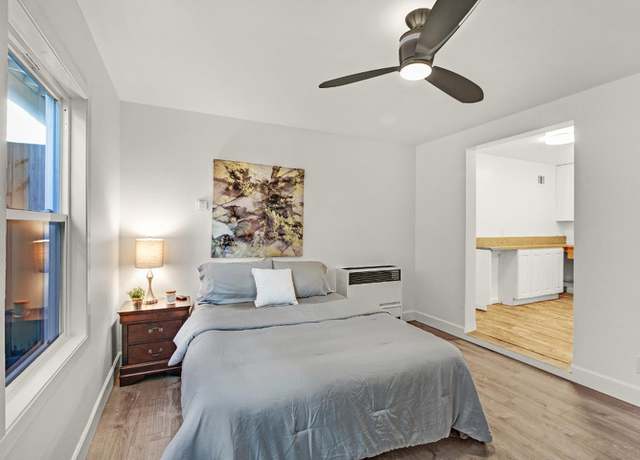
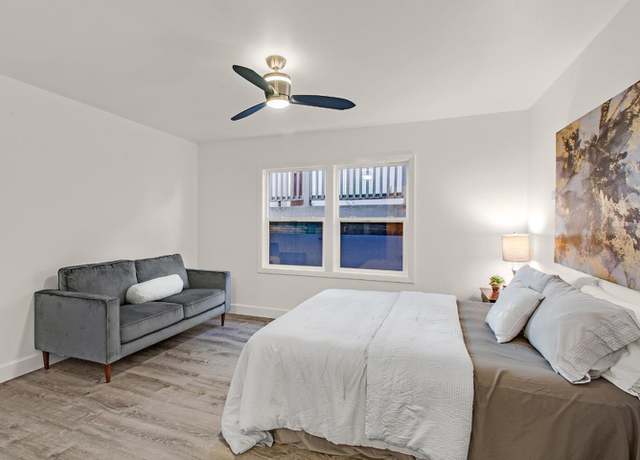
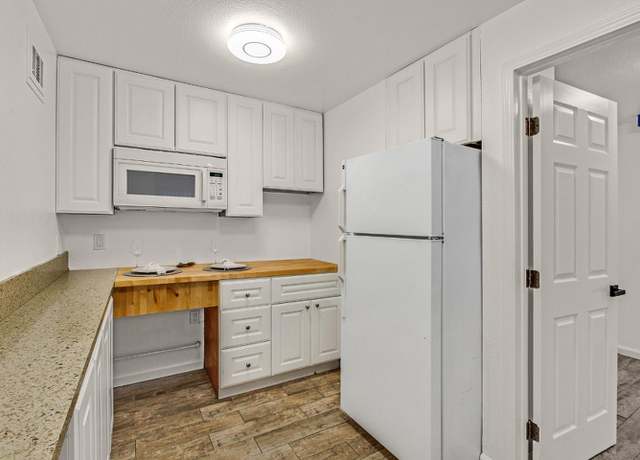
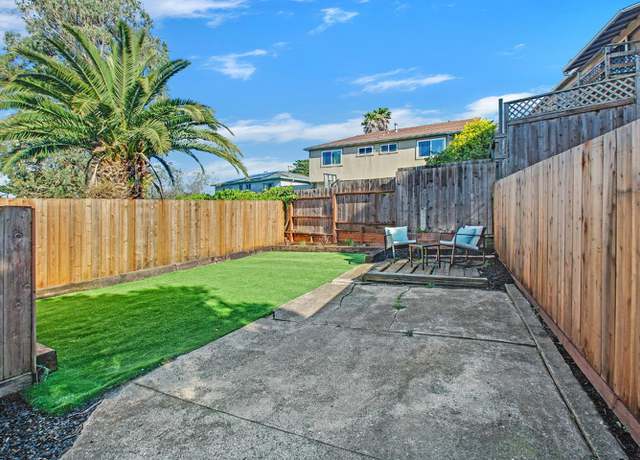
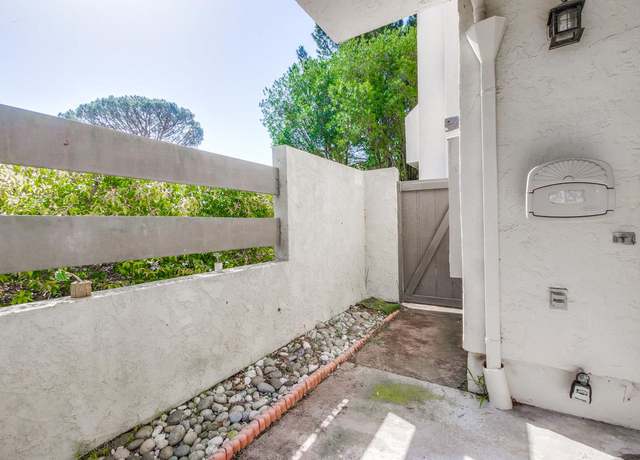
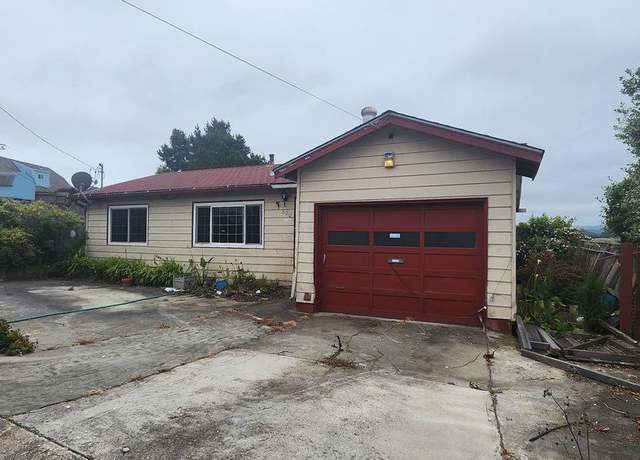
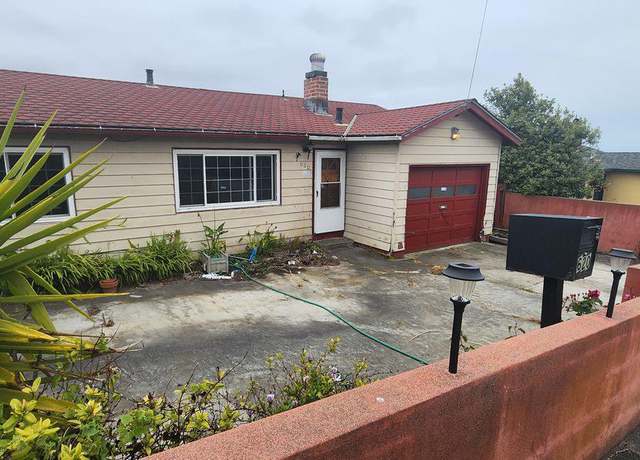
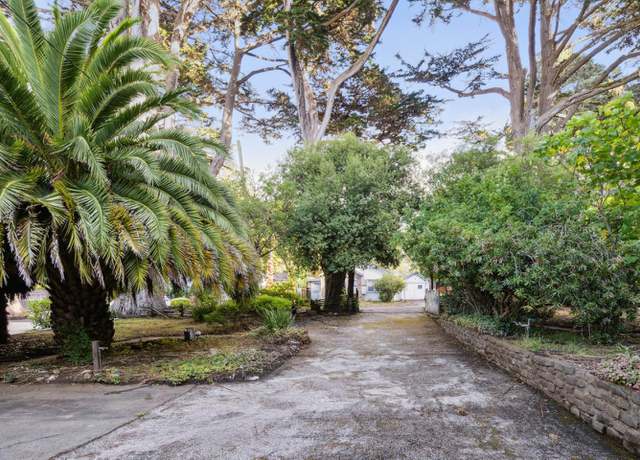
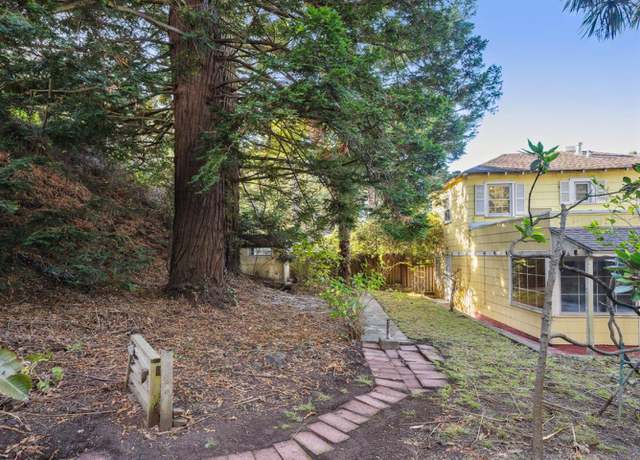
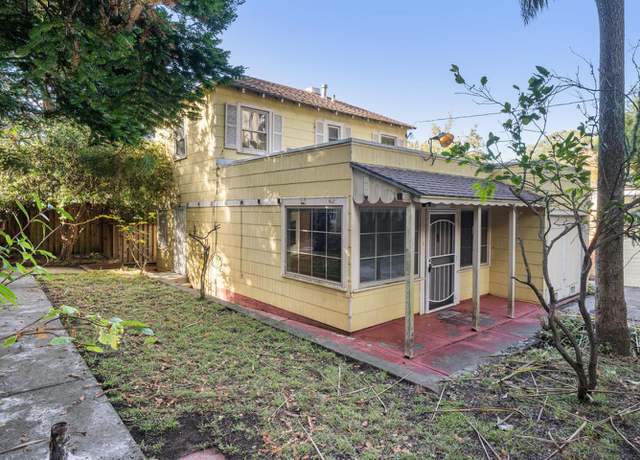
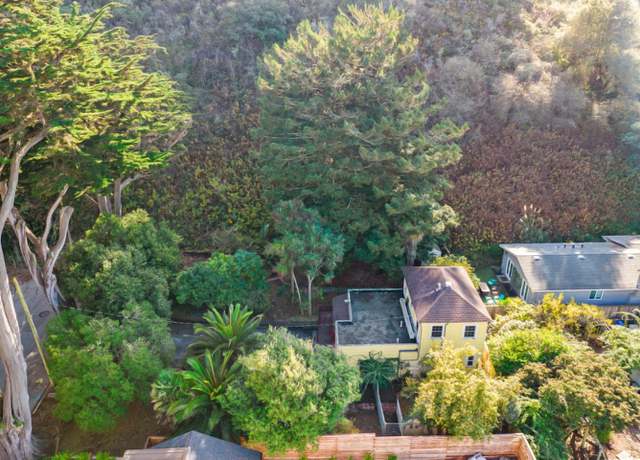
A "Diamond in the Rough" awaits your vision in this coastal home in Pacifica. This 3-bedroom home is primed for your personal touches. While some TLC is needed to bring it back to its shining potential, the possibilities are endless. Nestled in a nice neighborhood on a spacious 5,989 sq. ft. lot this 1520 sq. ft. home is conveniently located near schools, Linda Mar shopping center. and restaurants. Coastal living at its best with nearby hiking trails and Linda Mar beach for toes-in-the-sand moments. Easy access to Highway 1 and a short commute to downtown San Francisco and SFO airport. Seize the opportunity to transform this hidden gem into a radiant masterpiece. Schedule a showin
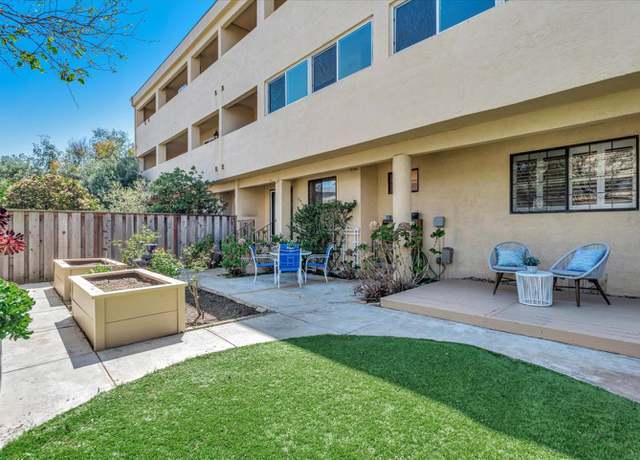
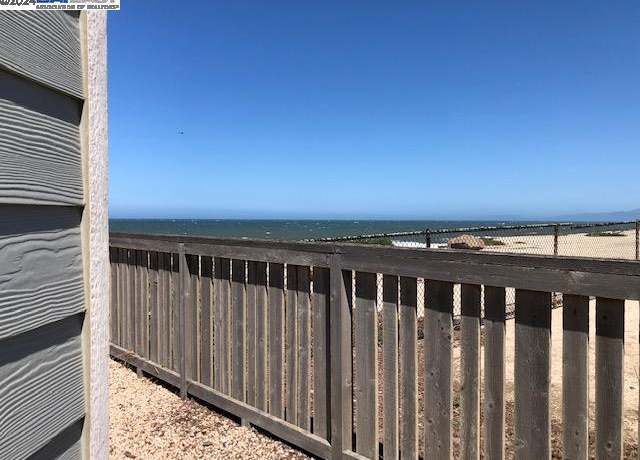
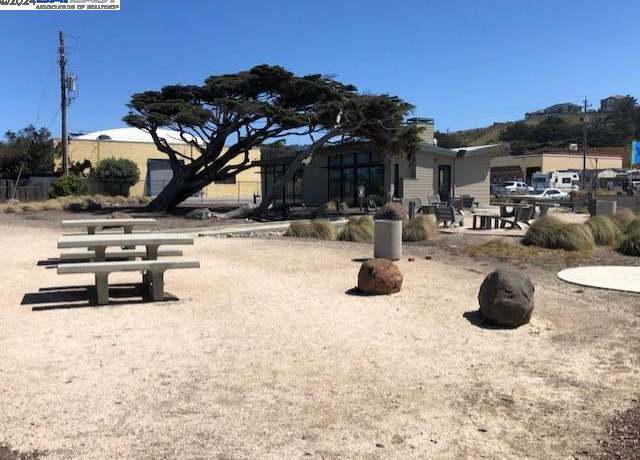
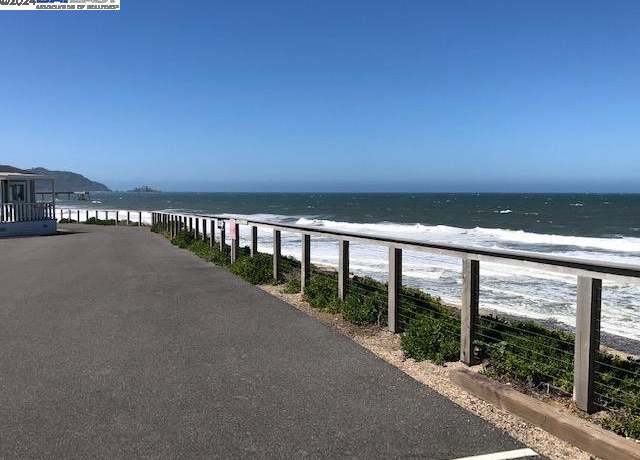
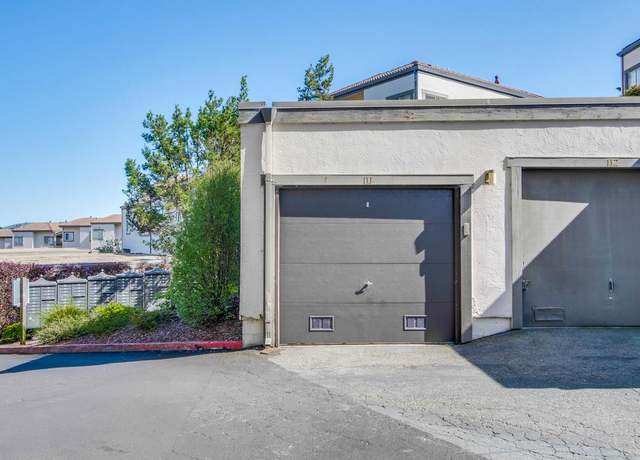
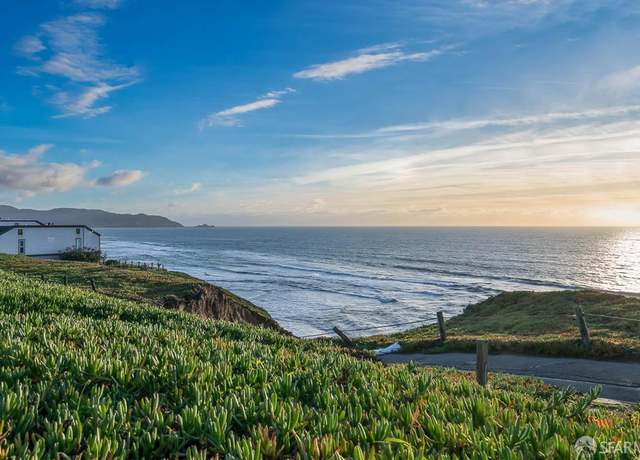
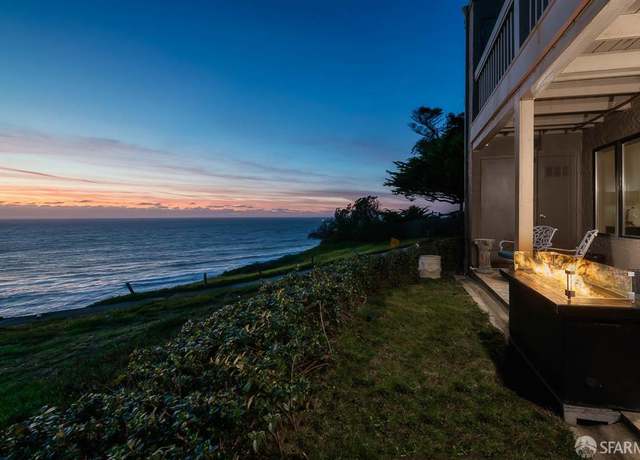
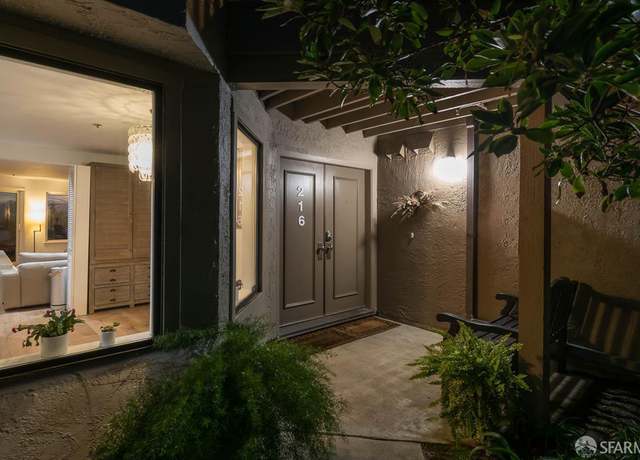
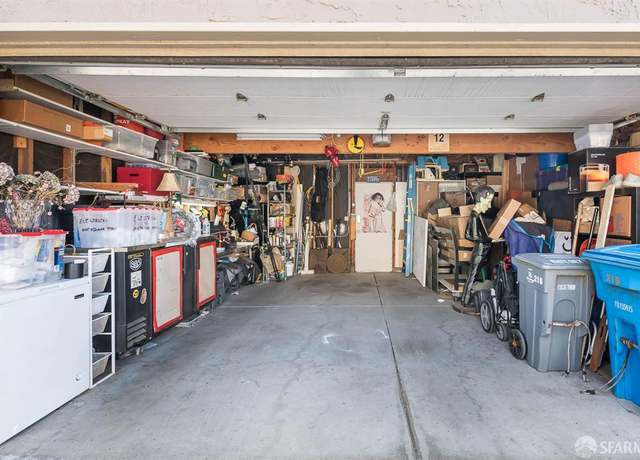
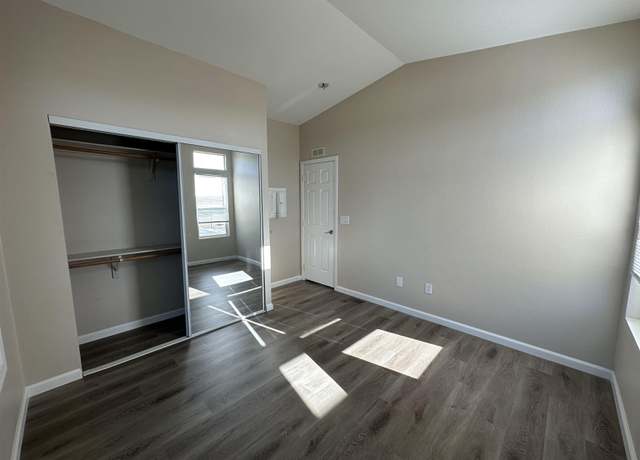
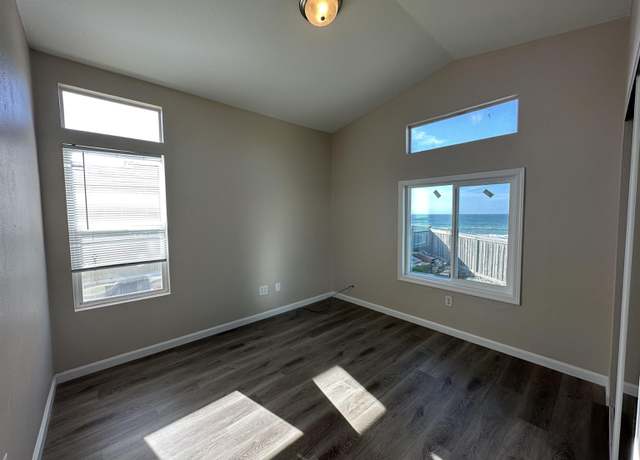
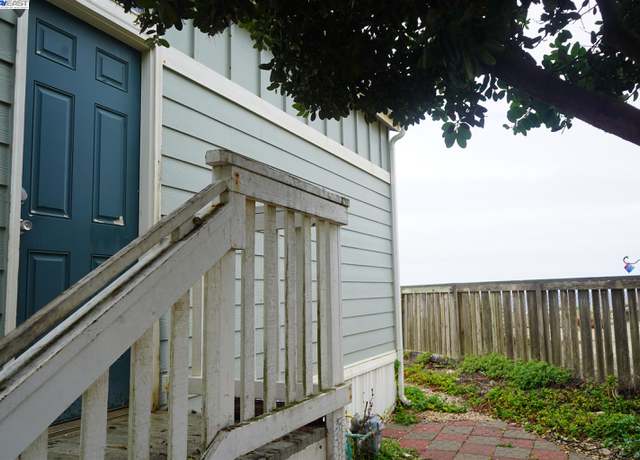
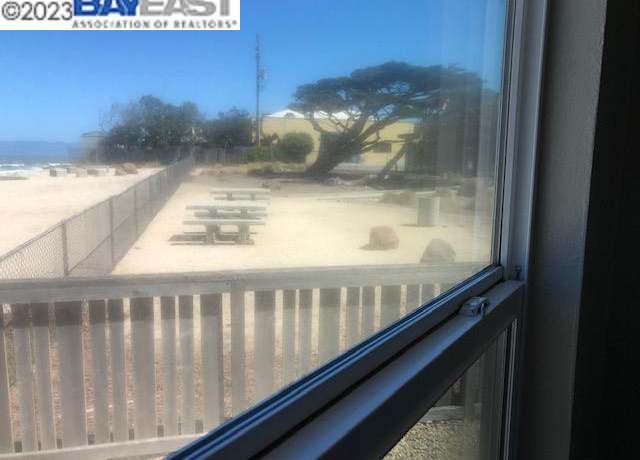
Spacious two full bedrooms, two full baths just across the street from the ocean. Walk to barbecue area and picnic grounds with ocean views. Freshly painted interior, wood like flooring and gas fireplace. One of the largest backyards you will ever find in a condo with patios, artificial turf and raised flower beds. Large storage closet and separate enclosed one car garage (pictures of both included). All appliances including refrigerator, gas range, dishwasher, washer and dryer included. Just a short walk to the Pacifica Pier, Sharp Park Golf Course and miles of walking trails. Located in the highly desirable West Sharp Park neighborhood with interesting restaurants, coffee shops, quaint sh
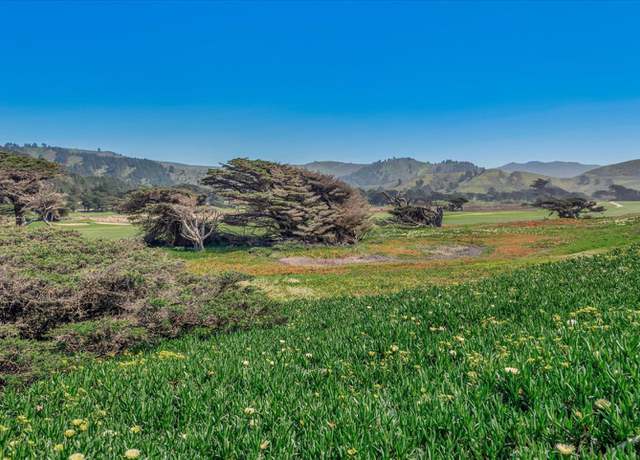
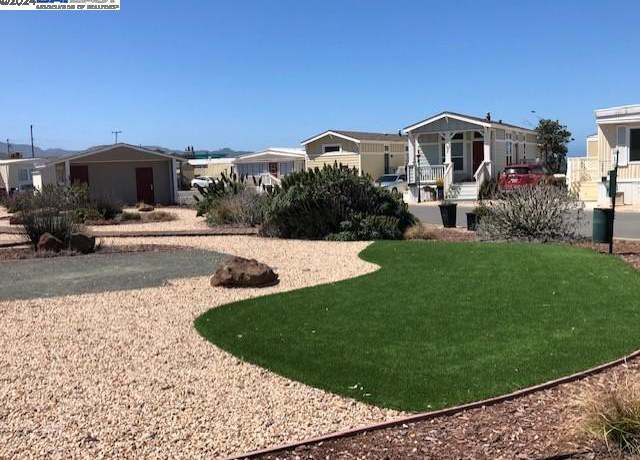
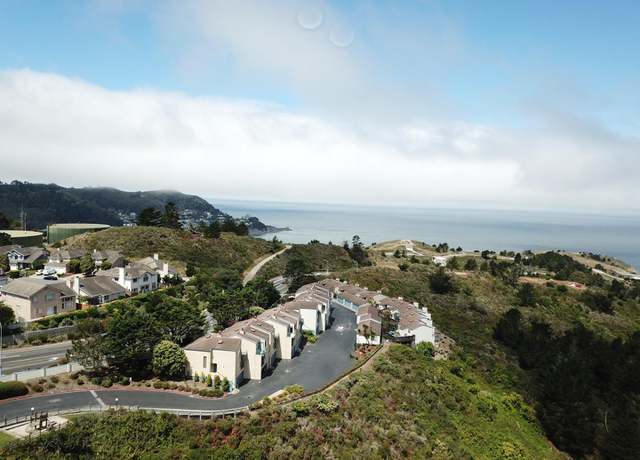
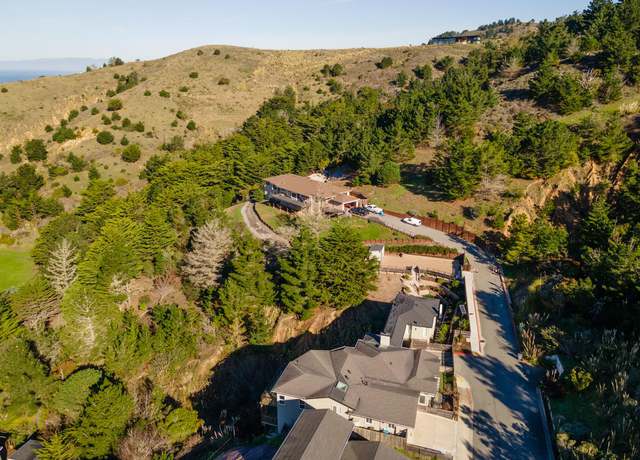
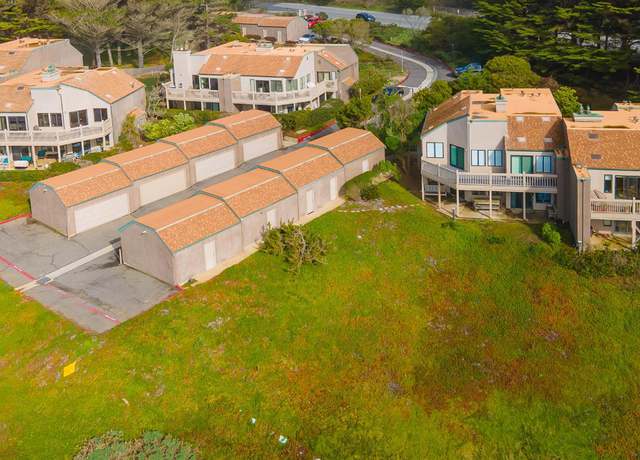
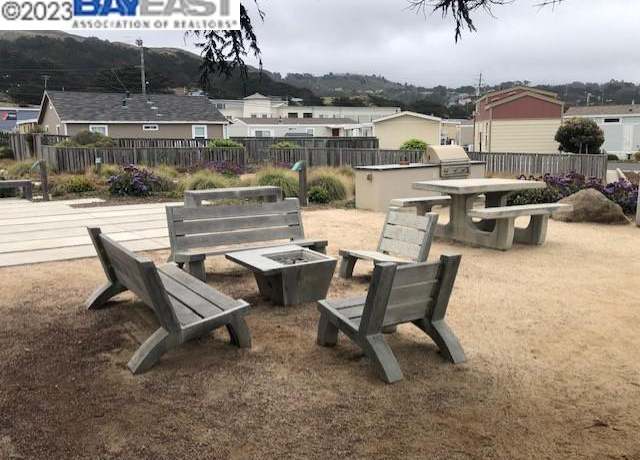
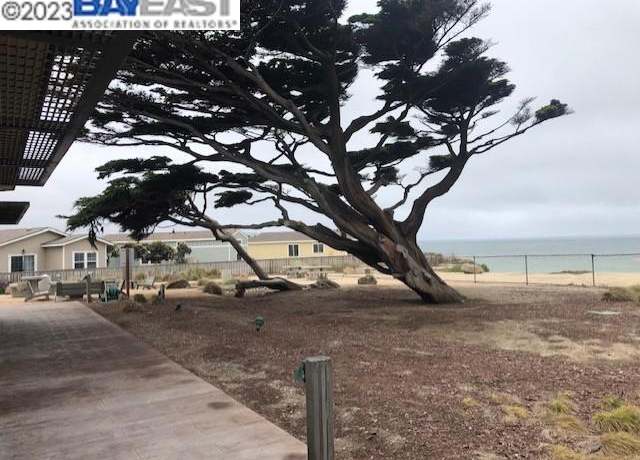
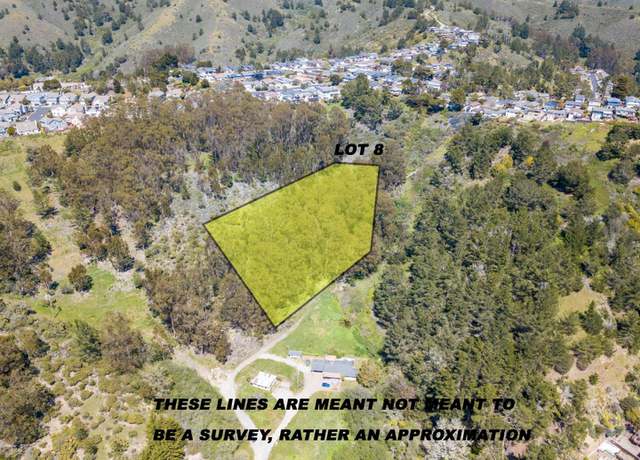
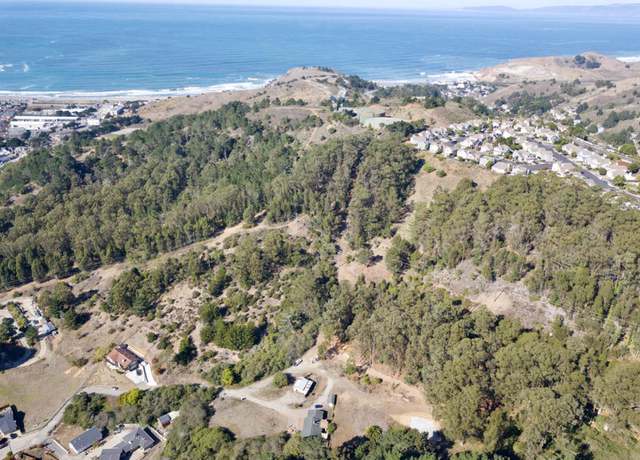
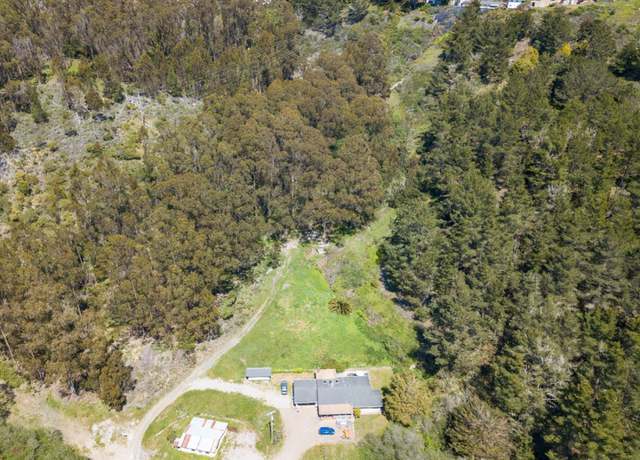
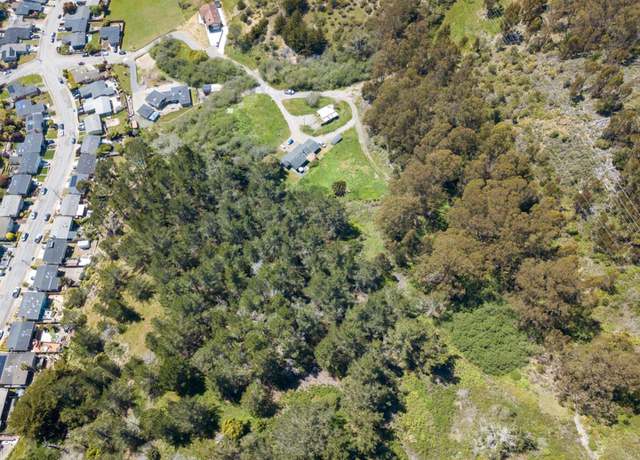
Ohlone Point represents the culmination of many years of working with local authorities and interest groups to get the necessary permissions to create this unique development. Ranging from 1.2 to over 2 acres, each property avails of breathtaking, unobstructed ocean views for miles up and down the California Coast. A haven with the most stunning Ocean views, backing onto hundreds of acres of open space, yet only a short drive to downtown San Francisco, SFO Airport, Sand Hill Road, Stanford and the Peninsula. Each lot is already set up with paved, beautifully lit streets, driveway entrances, public city sewer, city water and PG & E. Minutes away from the sands of Rockaway Beach and local
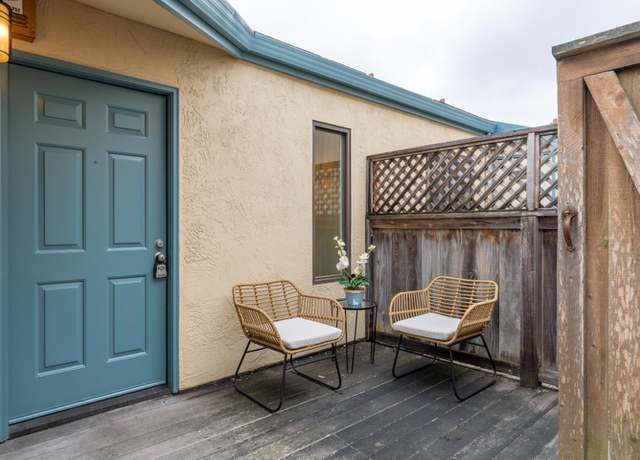
Come enjoy the largest floor plan also known as the F plan, while the iron is hot. This home has an enclosed loft giving the option of a 3rd bedroom on the second floor. New vinyl plank flooring and interior paint. Enclosed one car garage with additional storage. Private rear patio with laundry and storage closet. Come and get a piece of Pacifica's sunniest microclimate. Get this F plan on your to do list.
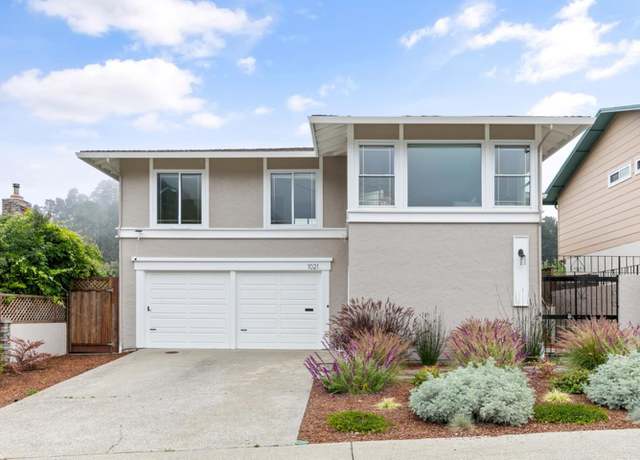
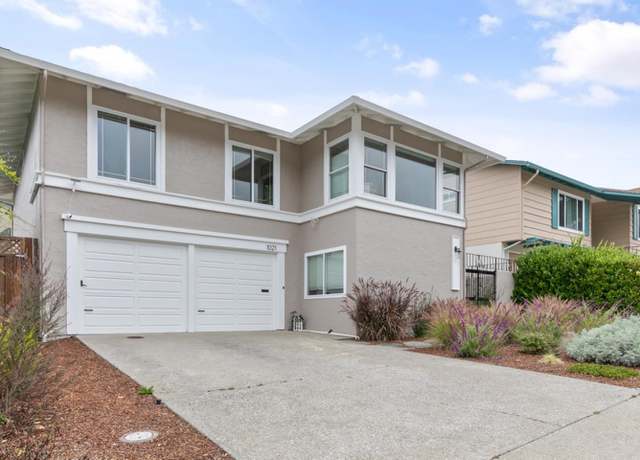
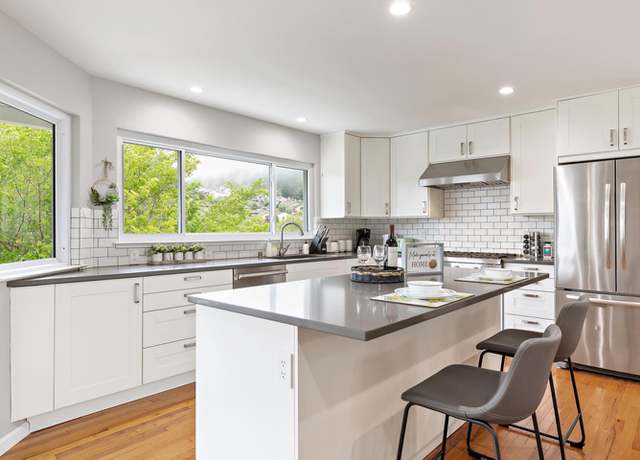
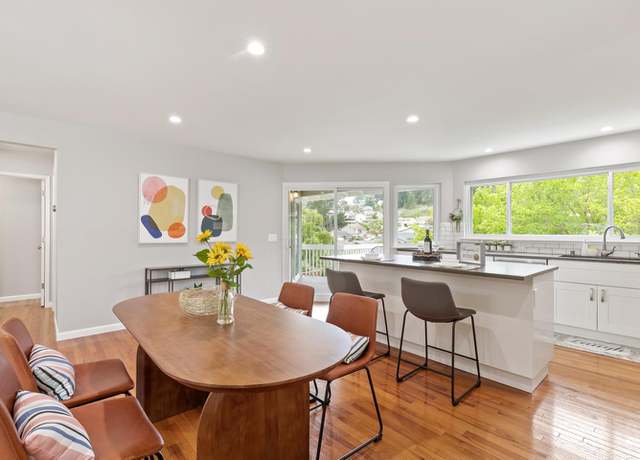
Beautifully updated elevated home with sunset ocean views. The open floor plan features a remodeled kitchen, with French Gray shaker cabinets, Quartz countertops, large eat in island, with stainless appliances. This beauty has two bedrooms one bath upstairs, with one bedroom and bathroom downstairs. The floor plan offers an opportunist for a future ADU or additional unit. Home features new interior and exterior paint, new lighting, new flooring, and much more. Too many updates to list, even down to the new low maintenance turf and landscaping. Come make this home yours!
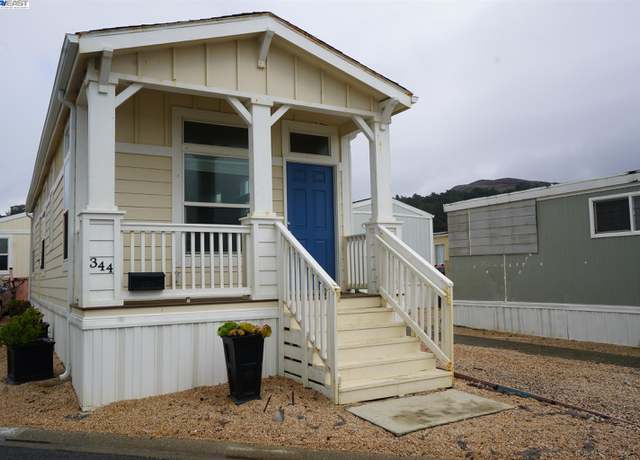
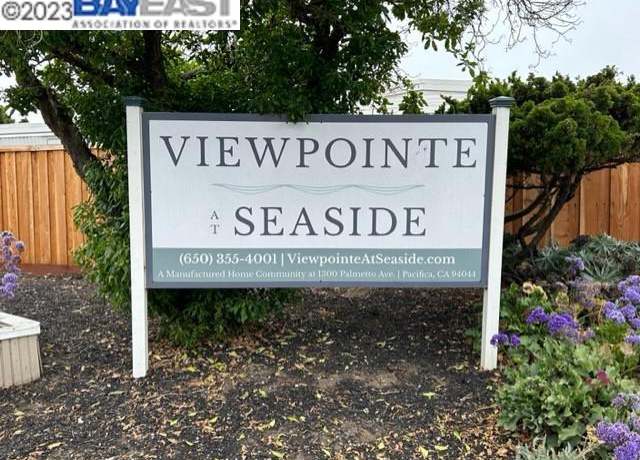
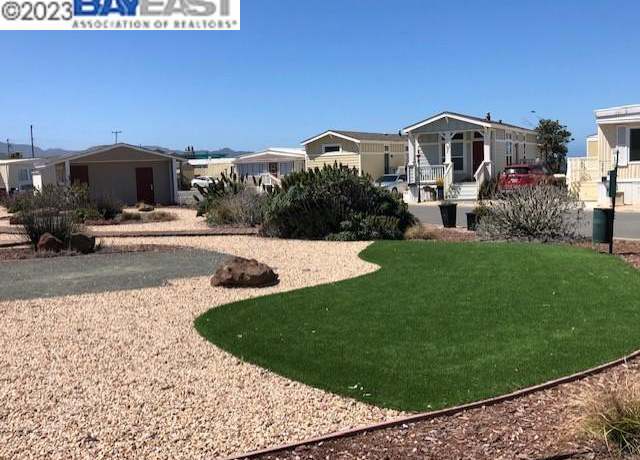
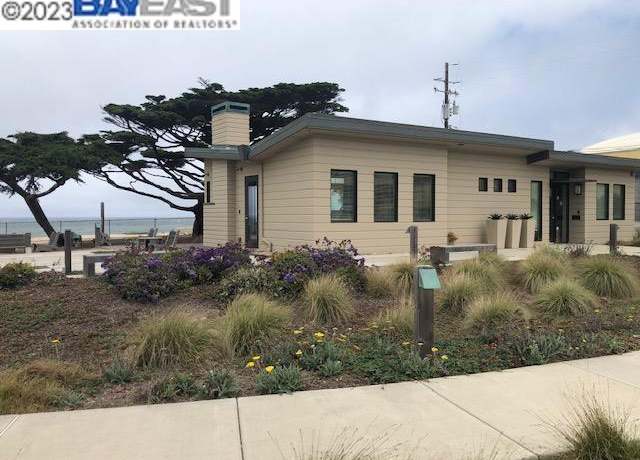
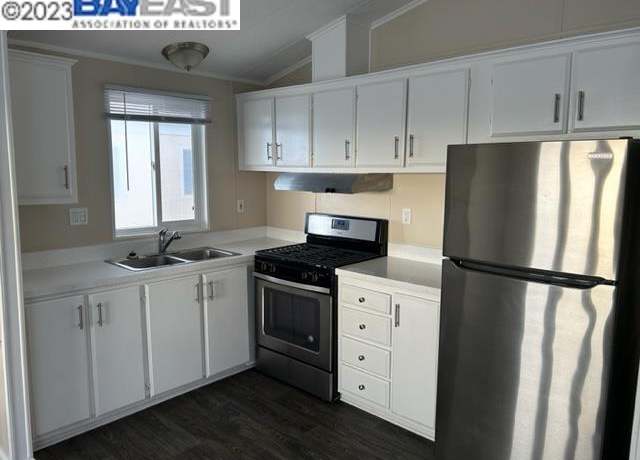
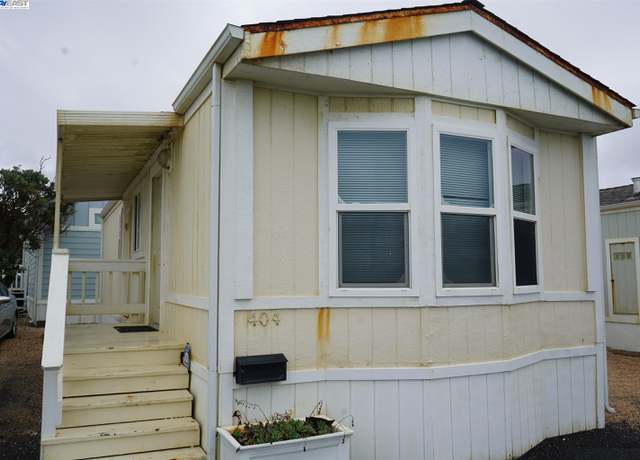
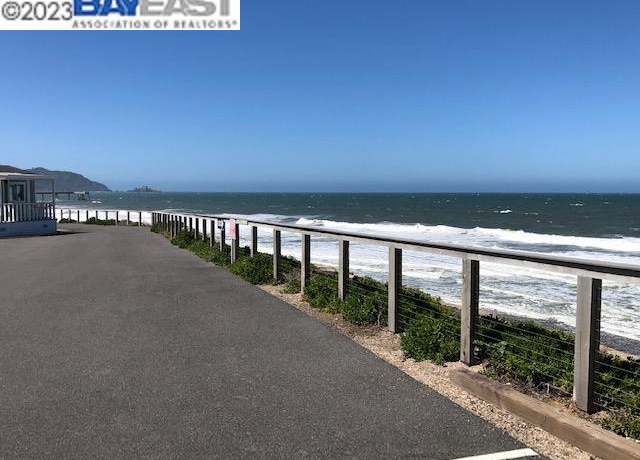
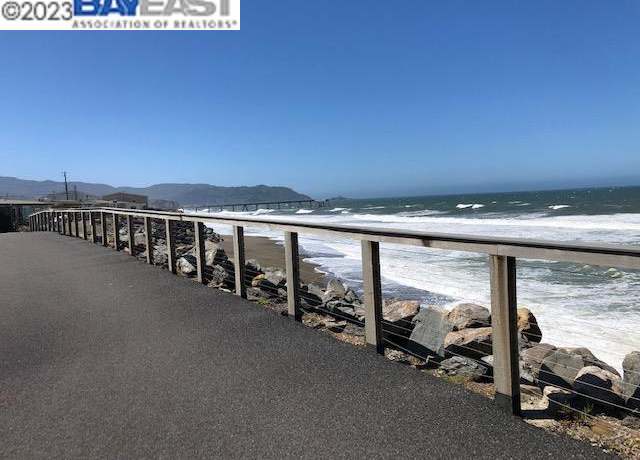
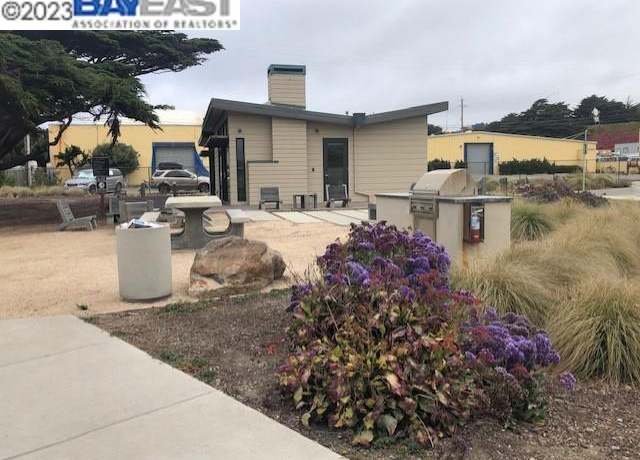
This mobile home in Pacifica is ready for move in. The home has been updated and features 1 bedroom and 1 full bath. New laminate flooring throughout. Washer and dryer in unit. Steps from the Pacific Ocean. Listen to the ocean while you relax and watch TV with open windows. The Viewpoint at Seaside is an all-age mobile home park. The community is pet friendly and amenities included: club house, walking paths fire pit, BBQ grill and more. Monthly Space rent is $2800 plus utilities.
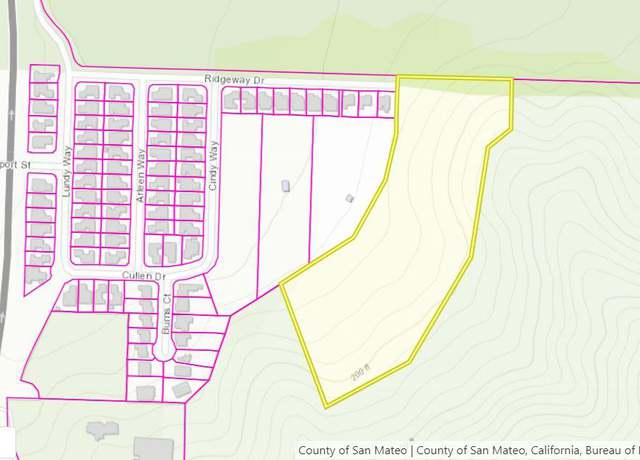
That sounds like an incredible property! With 9+ acres of vacant land within the city limits of Pacifica, privacy, rolling hills, and commanding ocean views, there's certainly a lot of potential. When it comes to marketing this property, emphasizing the privacy, natural beauty, and the potential for multiple building and home sites could be key selling points. It might also be worth considering the types of buyers who would be interested in such a property, such as developers, individuals looking to build their dream home, or even those interested in agricultural use. How can I assist you further with this amazing opportunity?
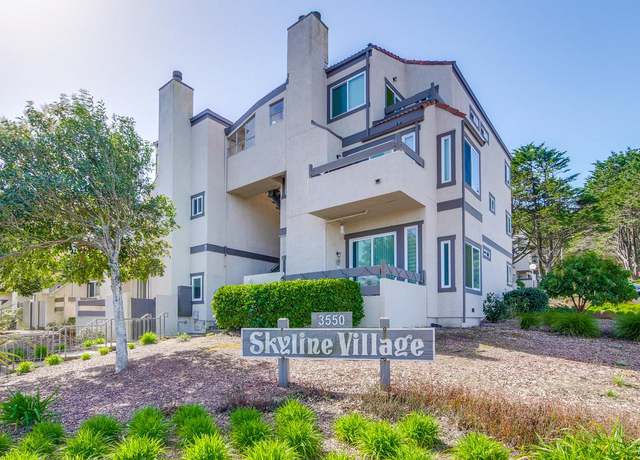
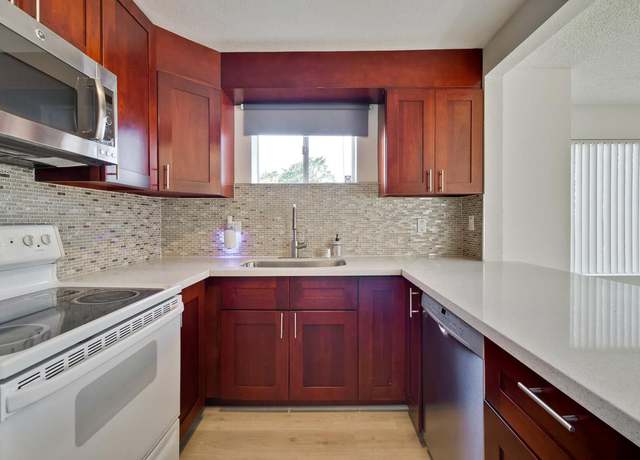
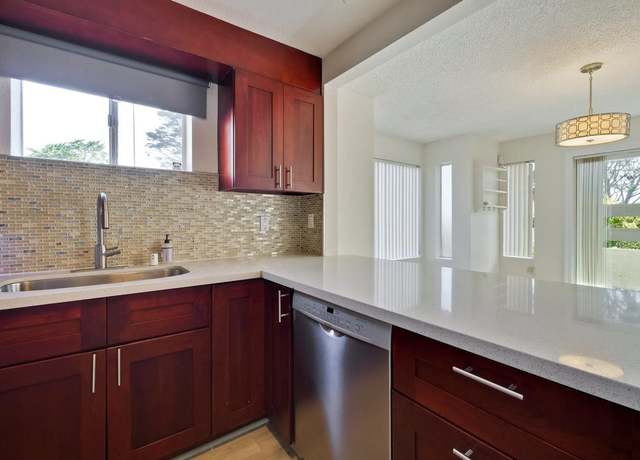
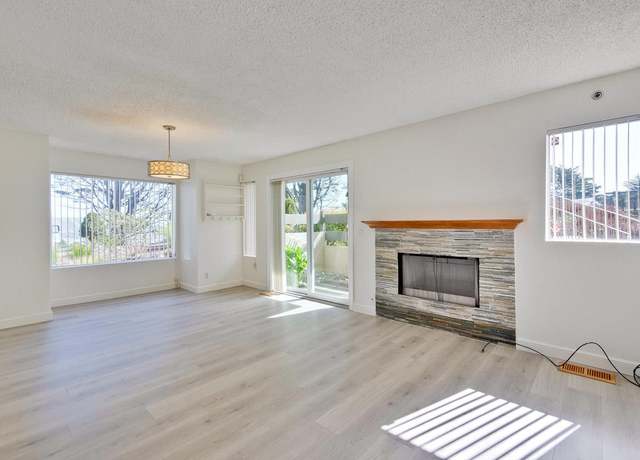
Welcome to your perfect starter home in the charming Skyline Village in SSF. The ground-Level condo offers an inviting space that is move-in ready. As you step inside, you are greeted by a bright and airy split Level floor plan. The remodeled galley kitchen is both stylish and functional, featuring stainless steel appliances, ample cabinet space, and an extended passthrough counter accommodating bar stool seating for entertaining while preparing a meal or grabbing a quick bite. Relax and host dinner parties in the combined Living and dining space with a peaceful retreat on your private patio, which is conveniently Located right off of the dining area. This cozy condo includes 2 spacious b
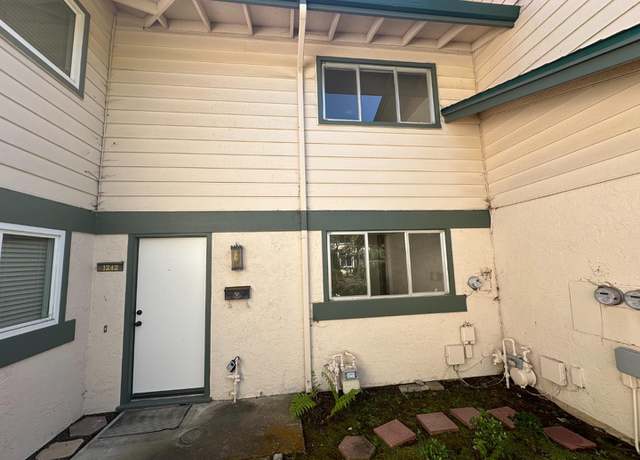
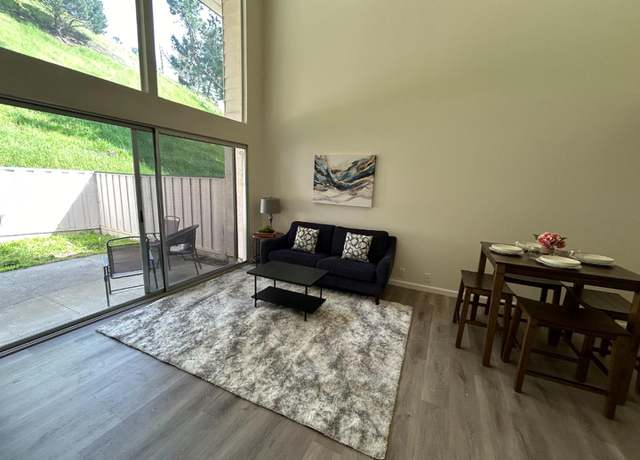
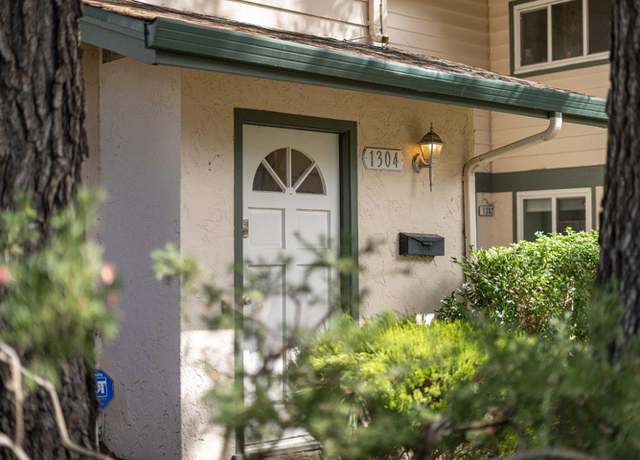
Nestled in Pacifica's sunny Linda Mar, this corner townhouse at 1304 Terra Nova Blvd is a beacon of comfort and natural light. Within walking distance to Ortega Elementary and Terra Nova High School, it offers a blend of convenience and serene living. The area is known for its favorable weather, providing a sunny respite from the typical coastal fog. The home is bathed in natural light, thanks to its advantageous corner positioning, enhancing the spacious interiors and creating a warm, inviting atmosphere. Its layout is thoughtfully designed to maximize both comfort and functionality, making it an ideal setting for both relaxation and entertainment. Linda Mar's strategic location ensures ea
Great corner lot with ample parking. First floor with LR/DR with wood burning fireplace, 1/2 bath, updated kitchen with granite countertops, stainless steel appliances & tile floor. Plus spacious master bedroom with 5 ft walk-in shower bathroom & walk-in closet with sliding door to level backyard & side entrance good for wheel chair accessibility. Upstairs 3 bedrooms & 1 bath! Original hardwood floors throughout, wall to wall carpet in master bedroom suite downstairs. Great location only 15 minutes to SFO, 20 minutes to DowntownSF, 10 minutes to Serramonte Shopping Center, easy freeway access and close to schools.
Back on Mkt, No fault of the property. This Charming Ground level Condo is located in the desirable Skyline Village Community in the Westborough neighborhood of South San Francisco. This charming corner unit condo with abundant natural light and offers an inviting space that is move-in ready. A cozy living area with open floor plan and a fireplace. A modern kitchen with ample cabinets. Additionally, the convenience of an in-unit washer/dryer and a 1 car covered detached garage (another car with Parking permit) adds to the ease and comfort of everyday living. Westborough Square, Seafood City, King Plaza, Serramonte mall, Costco, and a variety of restaurants are just moments away. With conven
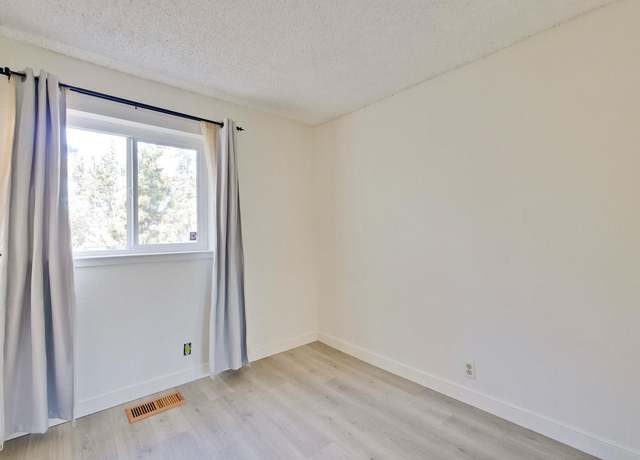
1/43
$699,000
2 beds1.5 baths877 sq ft
3550 Carter Dr #111, South San Francisco, CA 94080
Under the administration of US Bankruptcy Court; confirmation required. Agent out of town until 3/27/2024; no showings until then. Please no after-hour calls or texts.
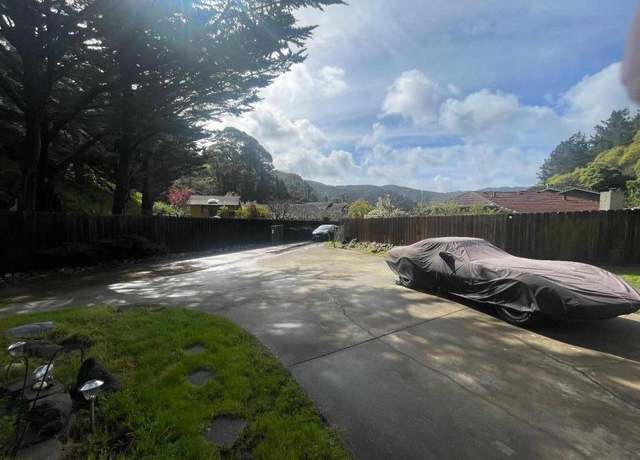
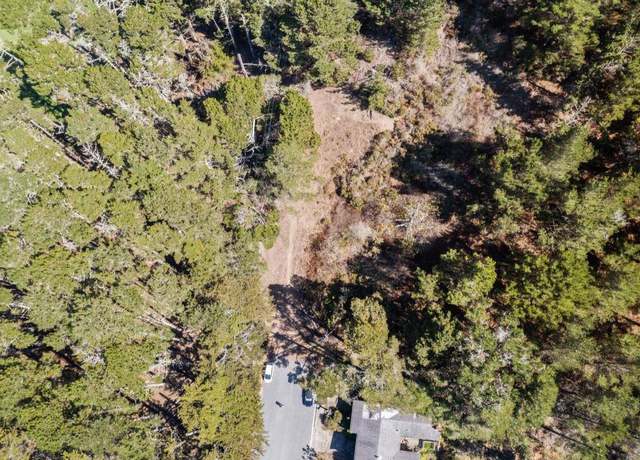
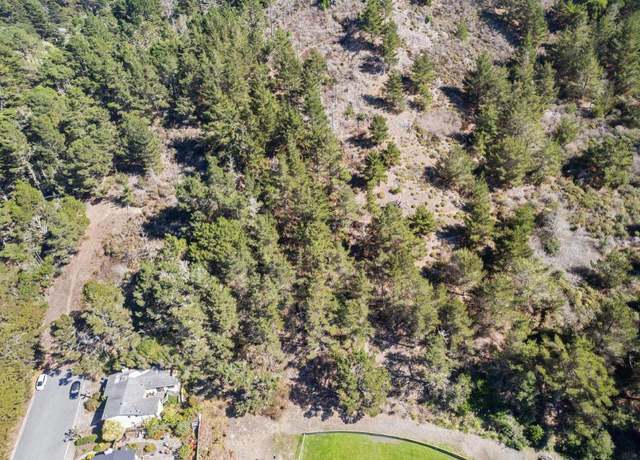
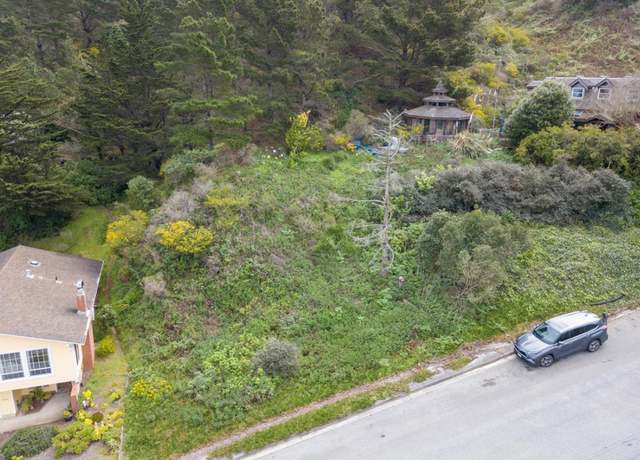
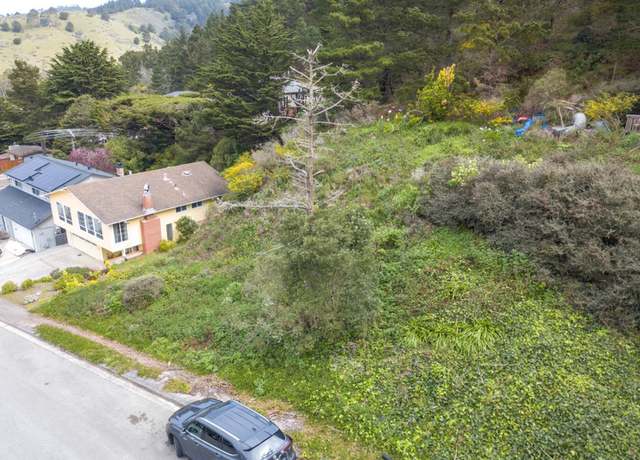
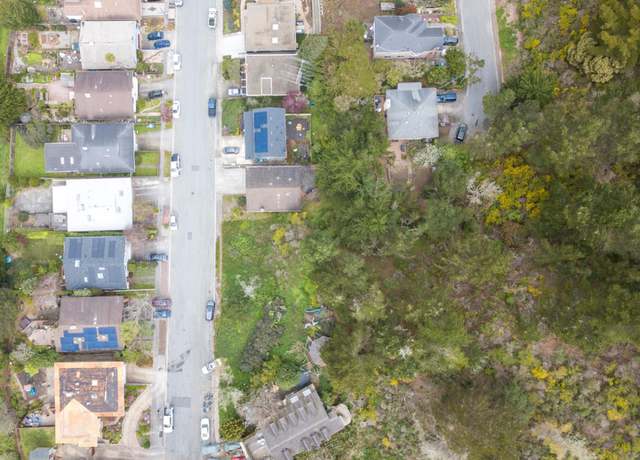
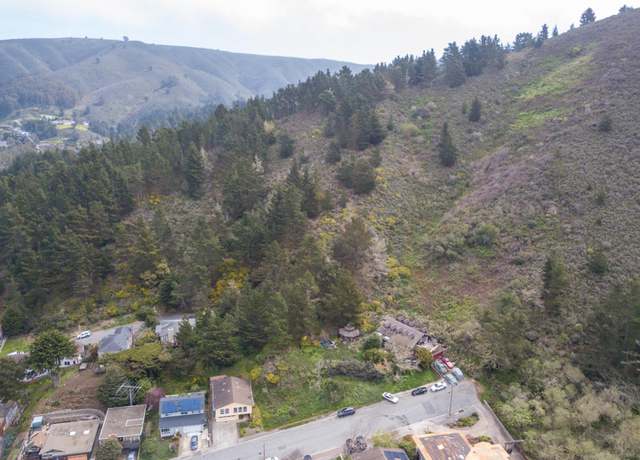
Incredible lot at the end of a quiet street in the highly desirable Vallemar neighborhood! This home sits on a large lot amongst trees and is a great opportunity to expand and make it your own. There is ample yard space and a ton of privacy being at the end of the street. Prime location towards the front of Vallemar with proximity to HWY-1 for an easy commute and access to all the restaurants, trails and beaches that Pacifica has to offer.
Welcome to your new oasis in sought-after Westlake Terrace! This fully detached two-story home offers a large lot, comfort, versatility, and stunning ocean views. As you step inside, you'll notice new waterproof luxury vinyl flooring and fresh paint throughout, creating a modern and inviting atmosphere. The main level boasts three bedrooms, an updated bathroom, and a fully renovated kitchen with new appliances, countertops, and cabinets. The living room features a beautiful wood burning fireplace, adding warmth and charm to the space. Downstairs, two additional bedrooms await with plush new carpeting, along with an updated bathroom and a living room leading to the spacious backyard with a s
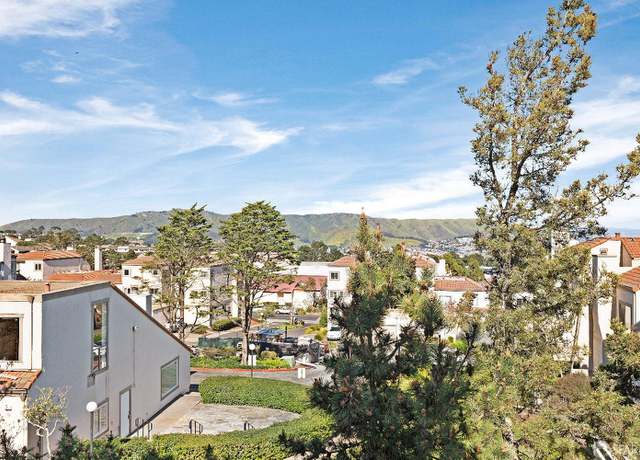
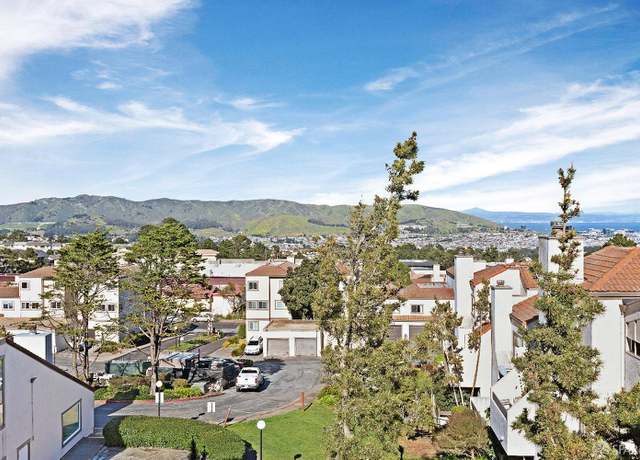
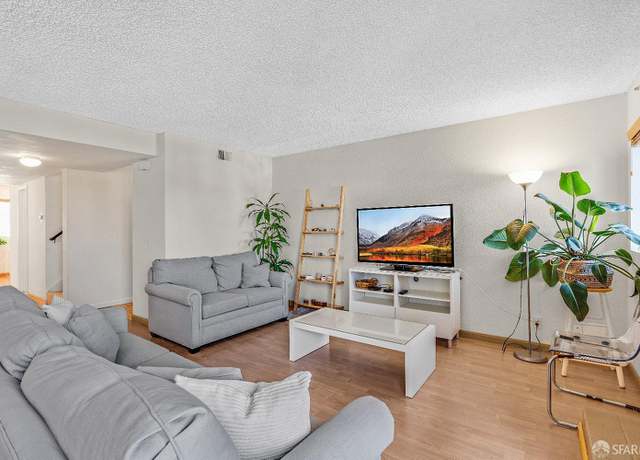
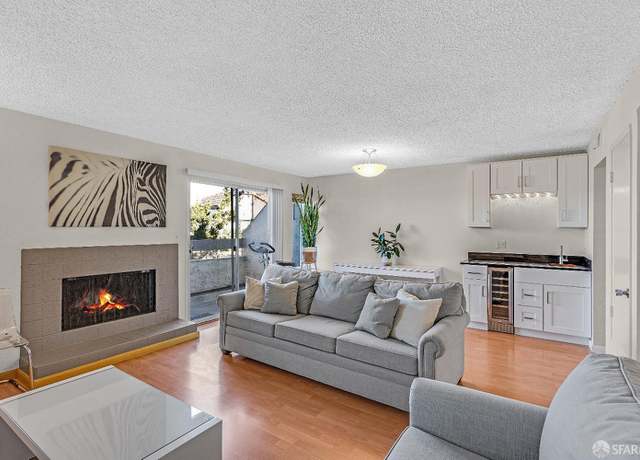
This delightful 2 level condo with views presents itself in the desirable Westborough neighborhood. Both levels offer fantastic views of the bay and the mountains. There is a spacious living room on the main level with a fireplace, a new wet bar, and a balcony with a view perfect for pleasant evenings and family gatherings. The remodeled kitchen boasts newer appliances and cabinets, while the dining and family rooms are seamlessly connected. The family room can serve as a home office. Upstairs discover a spacious primary bedroom with new double sink vanity cabinets and another private balcony overlooking the view. There are two additional bedrooms, a full bathroom, and a laundry closet. Nea
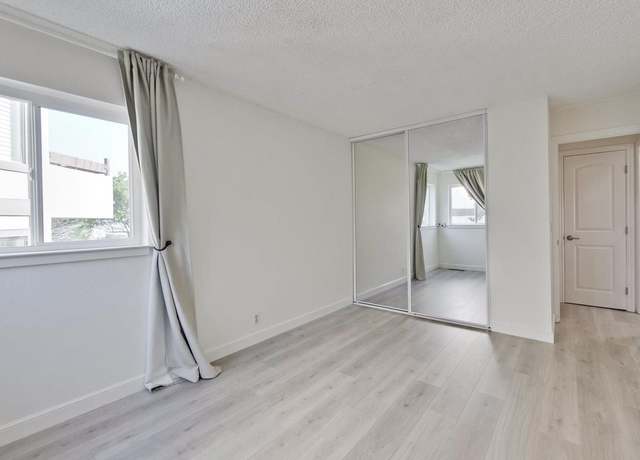
1/47
$849,000
3 beds2.5 baths1,644 sq ft
3550 Carter Dr #148, South San Francisco, CA 94080
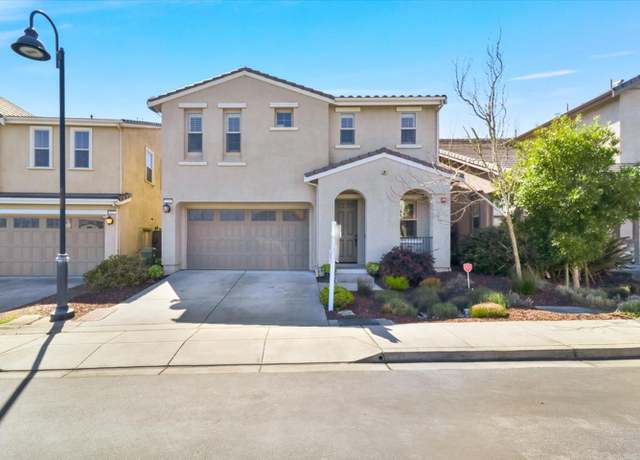
Welcome to this Gorgeous 5 Bedroom 4 Bath Home in sought-after Crestview Estates. Build in 2015 this home features hardwood floors, cozy fireplace, upgraded kitchen w/ island, granite countertops, 1 bedroom and 1 bath downstairs and 4 Bedrooms and 3 baths upstairs. 2 of the upstairs bedrooms have attached bath too. Home is perfectly located close to Serramonte Plaza, SamTrans/ Bart/ Colma Stations with easy commute to HWY 101,280 and 35. This home has a beautiful backyard with Flower Trees & Fruit trees like Peach, Cherry, Avacado, Fig, Orange & Pomegranate. It also has a walking trail that HOA maintains for home owners. Come and see to believe.
Welcome to this Elegantly remodeled and Meticulously maintained Pacifica home. Situated in one of the sunnies neighborhoods, this 4-bed, 3-bath SFH enjoys open floor plan with picturesque views of surrounding hills. Gourmet kitchen boasts Quartz countertops, Thermador appliances, breakfast island, ample storage cabinets, and sliding door to outside patio area for top green views. Sunny family room upstairs offers solid wood flooring, wood stove and and large picture windows filled with natural lights. Downstairs features living room, oversized bedroom, and full bathroom downstair, perfect for guests. Cozy patio at lower level offers entertaining outdoor space, ideal for relaxing. Convenient
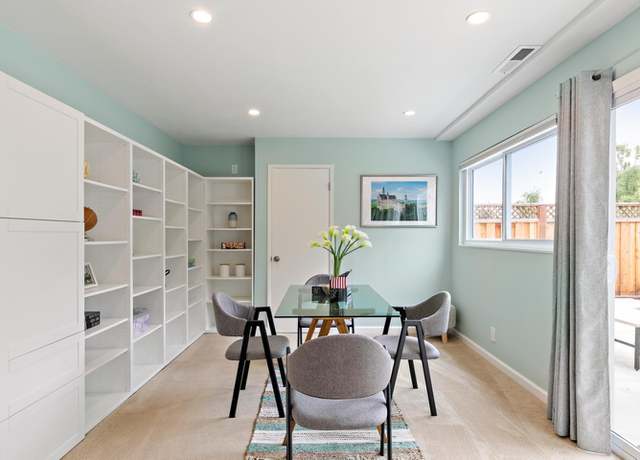
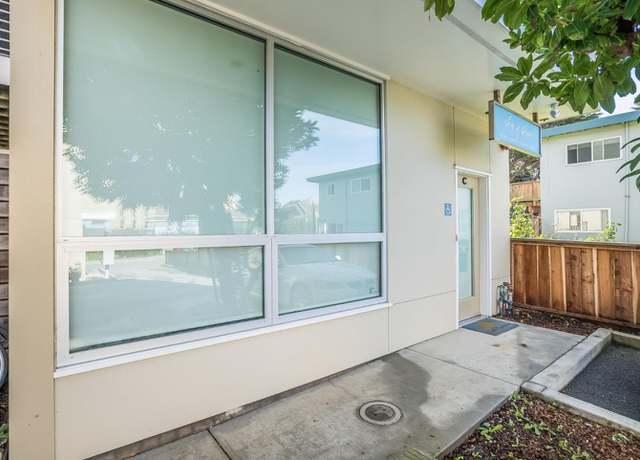
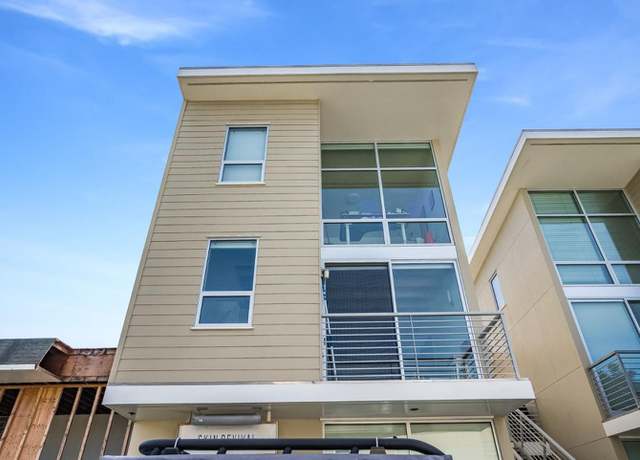
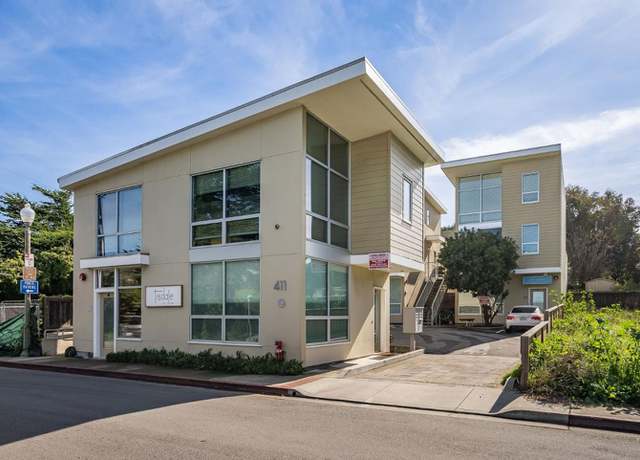
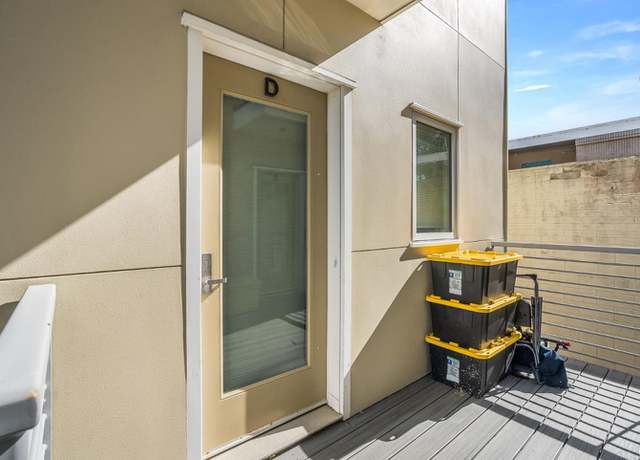
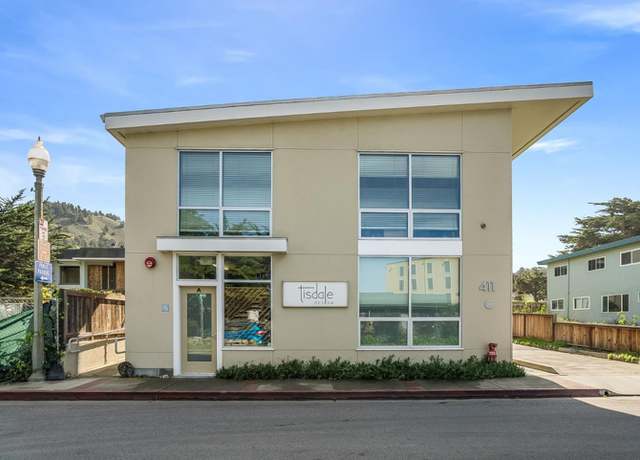
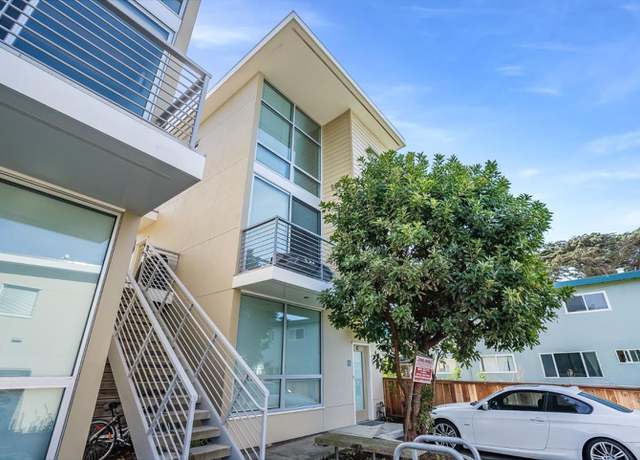
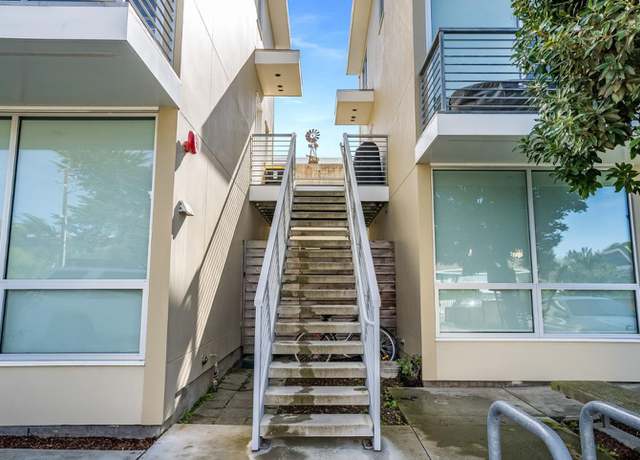
Fantastic opportunity to invest in mixed-use use Leed * Gold Certified Building in Pacifica. Located just 15 minutes south of San Francisco, 411 Dondee is nestled in Rockaway Beach, a transcendent retreat for those who want to get away. The area is uniquely positioned to capture the overflow of San Francisco's skilled, high-earning workers, who are seeking a more peaceful lifestyle by the coast and don't want to utilize overly congested commuter pathways. Each building features 1 retail/office space with a private restroom, and a spacious residential unit, two of which are townhouse style. The owner & builder invested in high-end finishes, open beam ceilings, in-unit washer & d
OCEAN VIEW TOWNHOUSE Great open floor plan, modern design, and boasts unparalleled ocean and mountain views from every angle. Lots of natural light. The remodeled kitchen provides the ideal setting for those who love to cook and entertain, with SS appliances and plenty of counter space. Remodeled half bath upstairs. Ocean view deck off the living area as well as a fireplace. Good sized private entry deck for BBQ's and entertaining. Downstairs has a laundry room, 2 good-sized bedroom. A hall bath with tub over shower and ensuite bathroom with a shower stall. Fresh interior paint. Close to the Rockaway Beach district which has restaurants, stores and hotels as well as the beach. Ideally locat
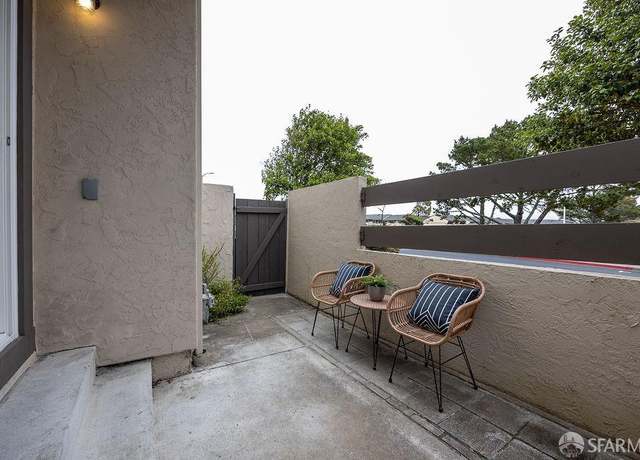
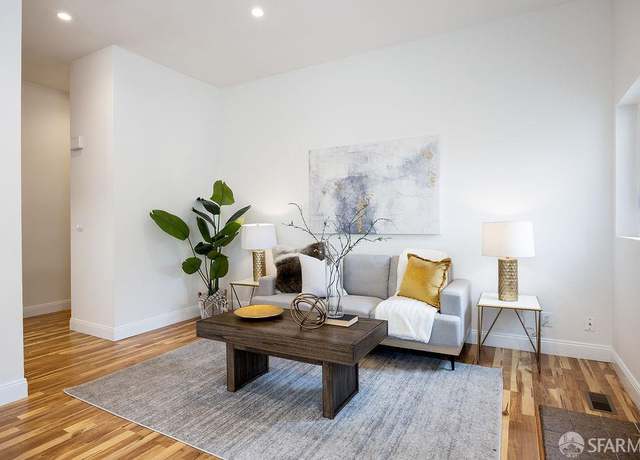
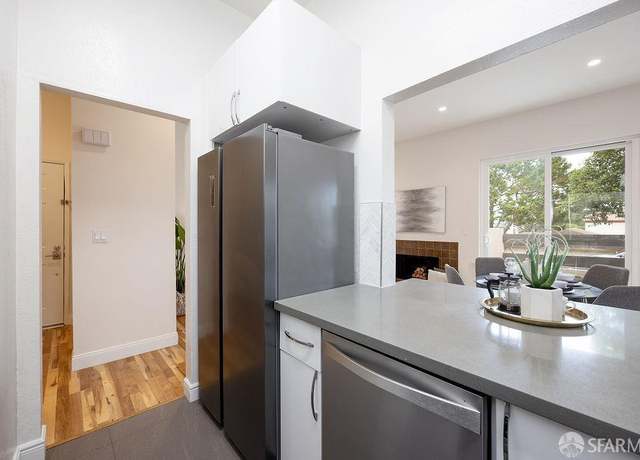
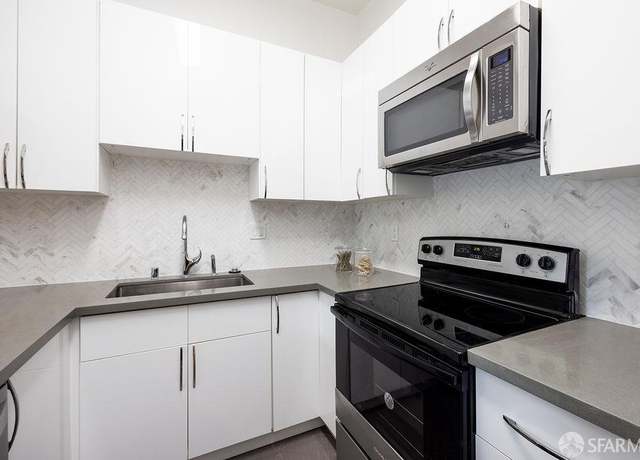
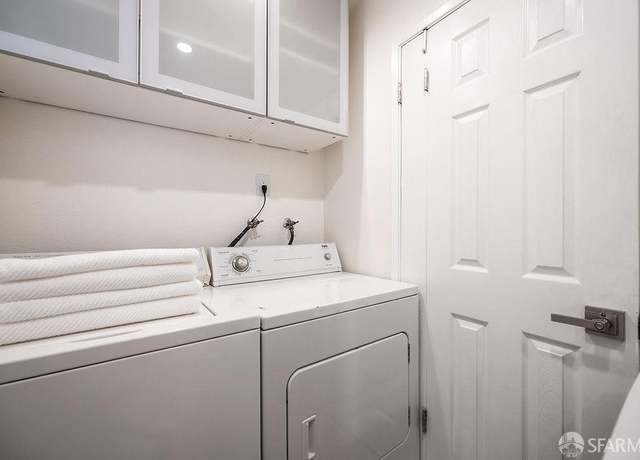
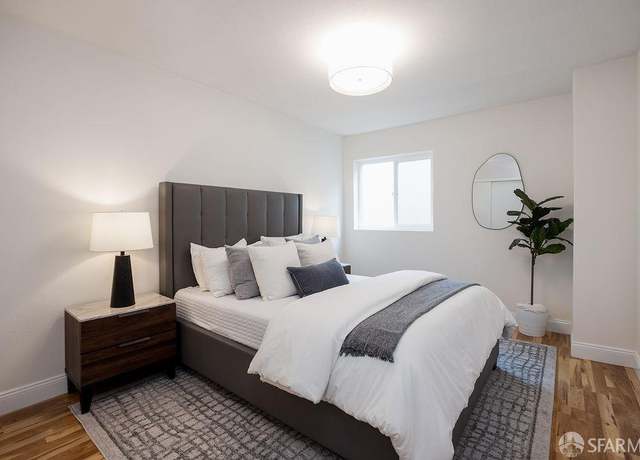
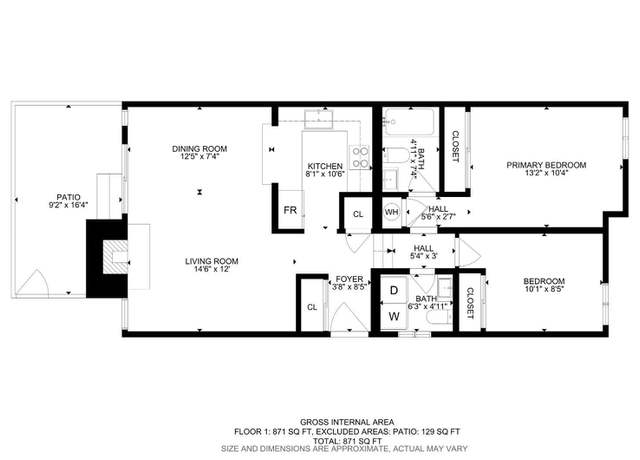
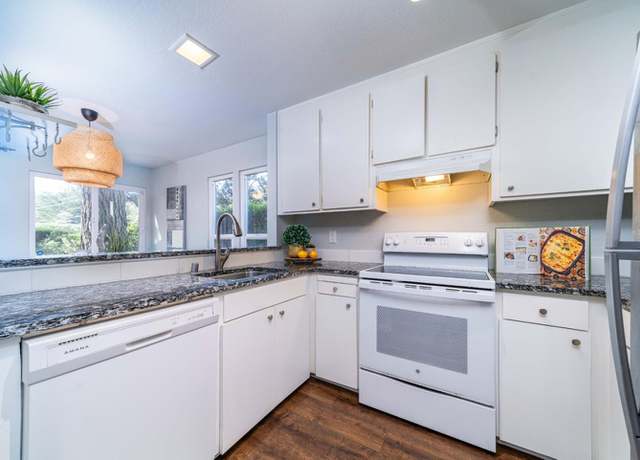
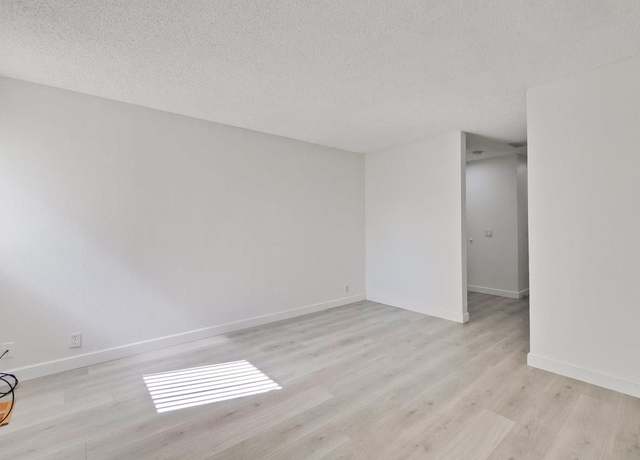
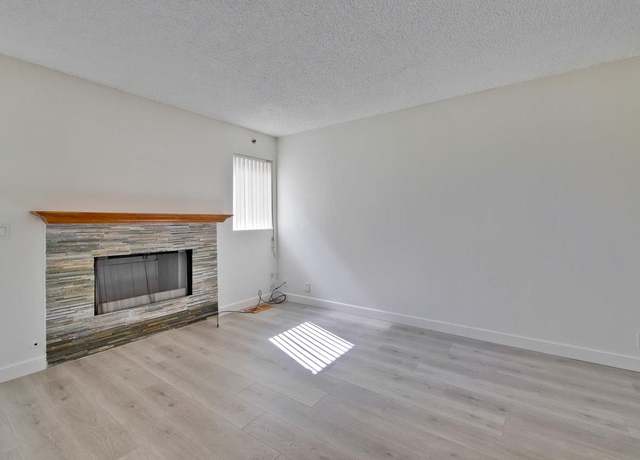
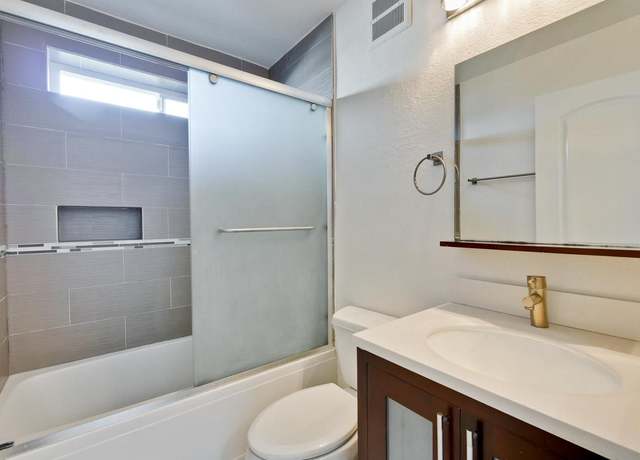
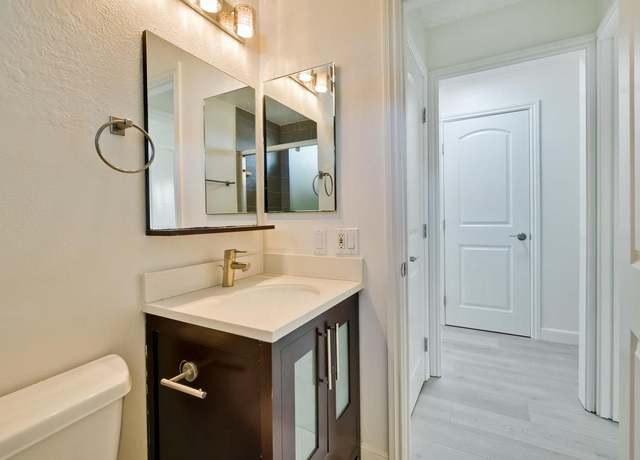
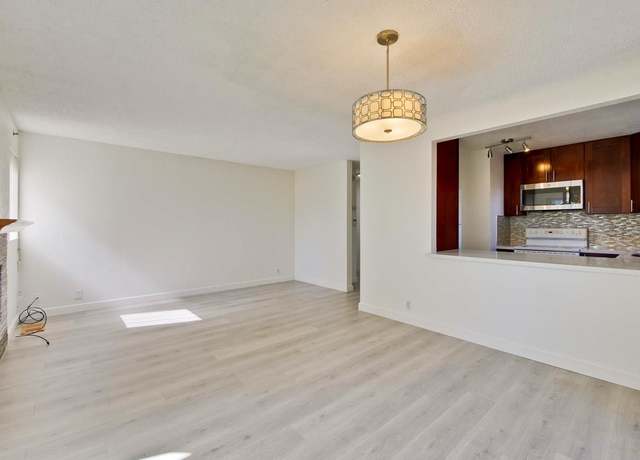
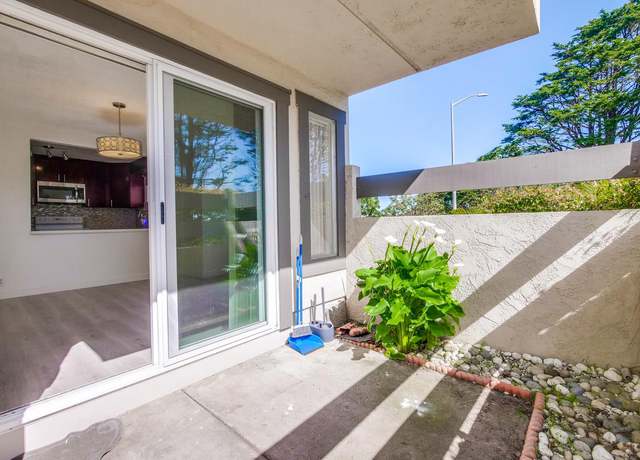
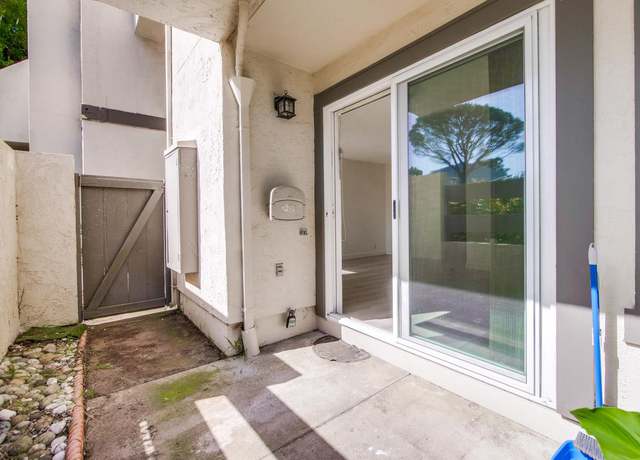
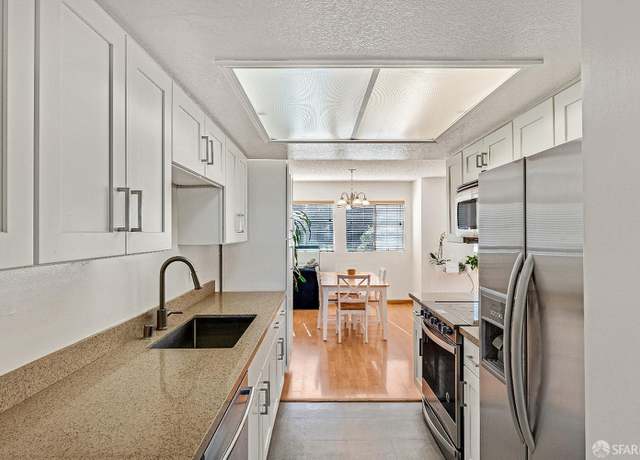
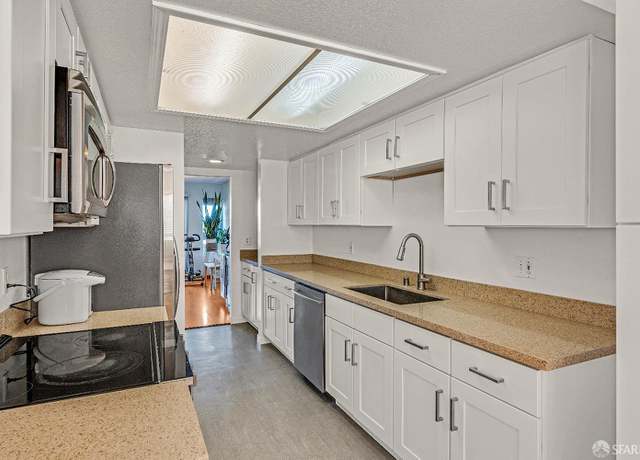
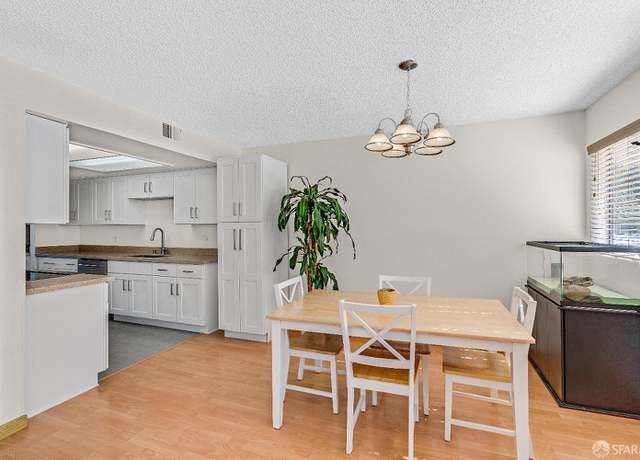
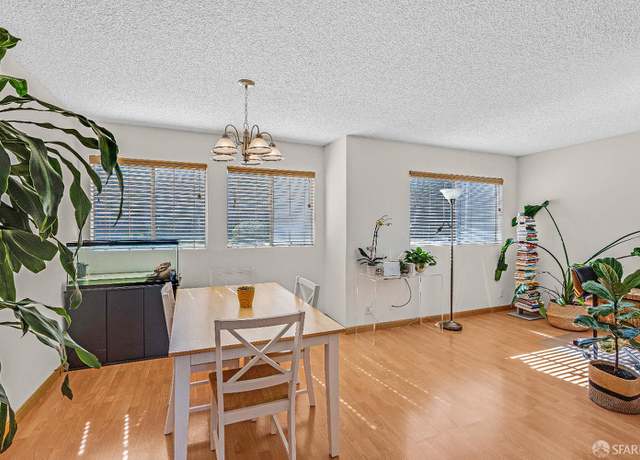
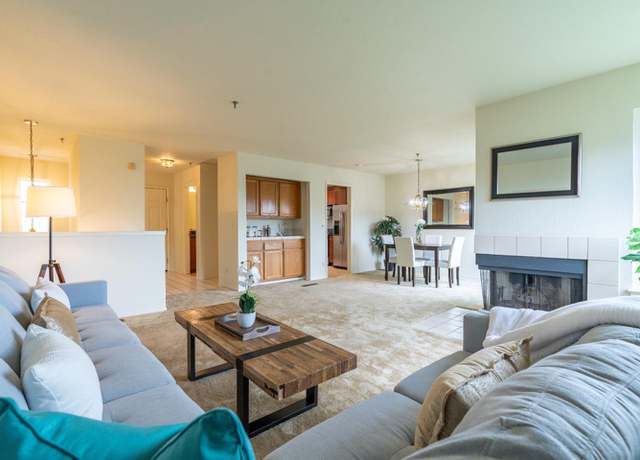
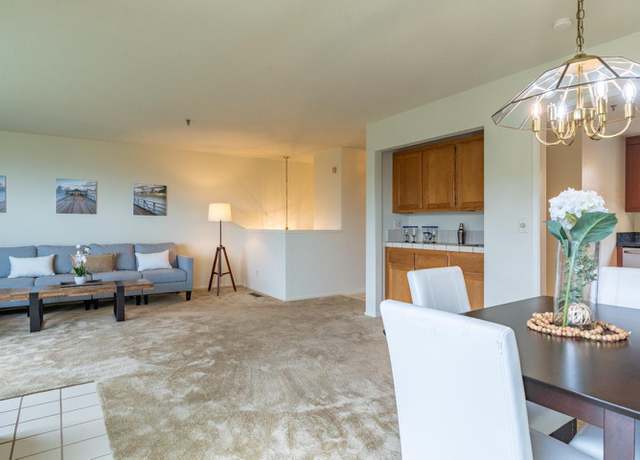
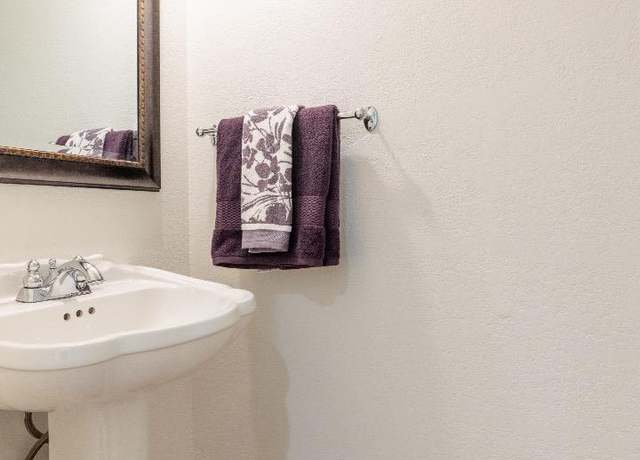
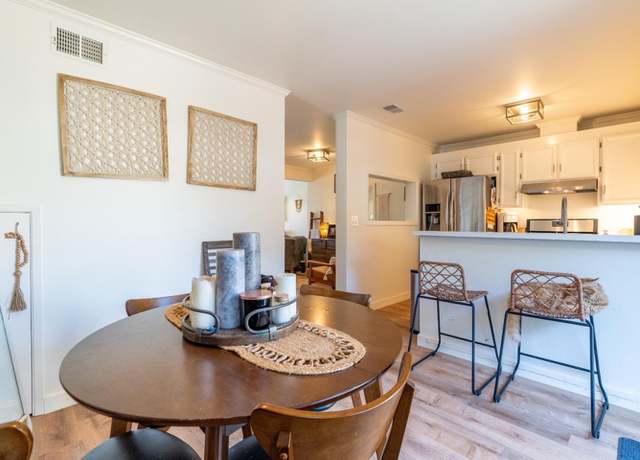
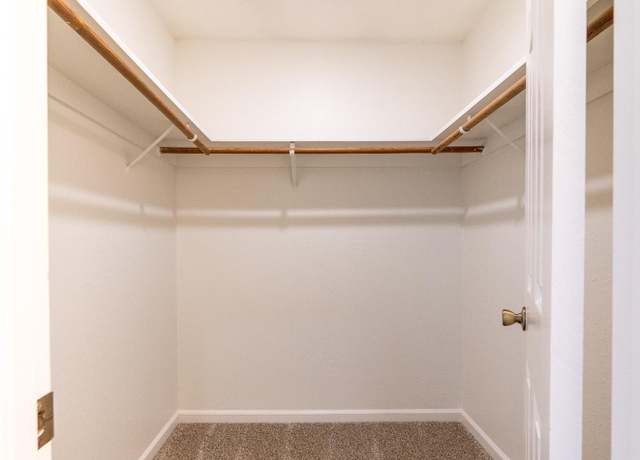
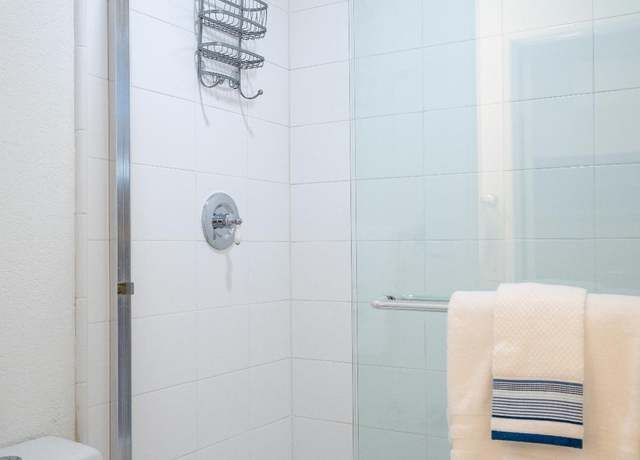
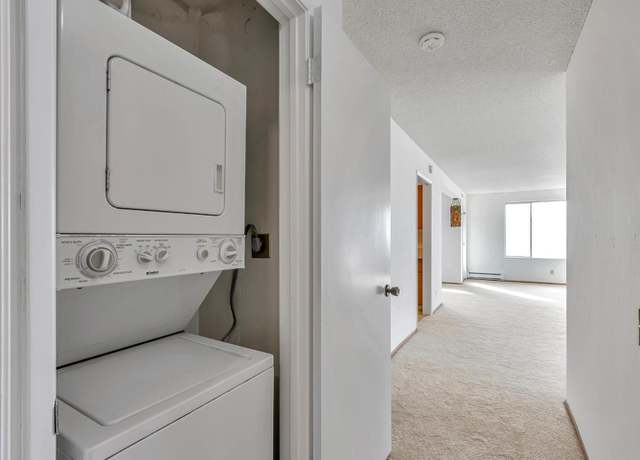
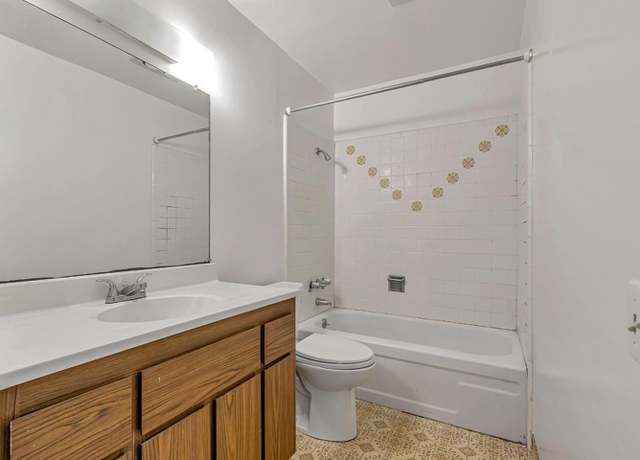
Welcome to your cozy oasis at 3550 Carter Dr #117, nestled in the highly desirable neighborhood of Westborough in SSF. This light-filled 2bd, 1.5ba condo offers the perfect blend of comfort & convenience, boasting modern amenities & prime location. As you step inside, youre greeted by a bright & airy living room complete with/ a gas fireplace. The living room flows into a cozy dining area that leads to sliding glass doors & a tranquil low maintenance outdoor space. Modern kitchen w/ plenty of cabinet space & an island - perfect for entertaining guests. Two bedrooms w/ plenty of natural light & spacious closets. The full bathroom features a shower over tub
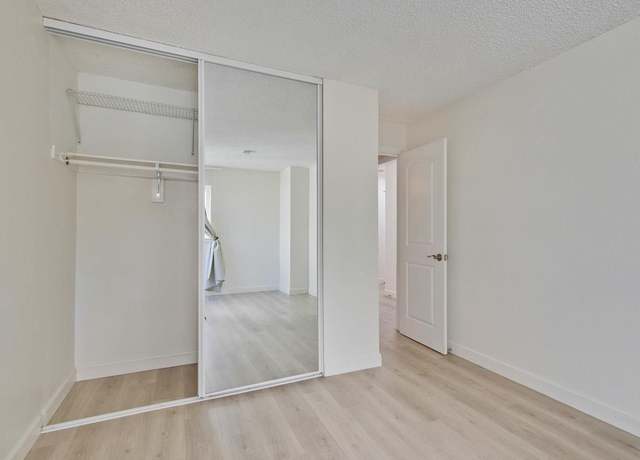
1/18
$675,000
2 beds1.5 baths877 sq ft
3550 Carter Dr #117, South San Francisco, CA 94080
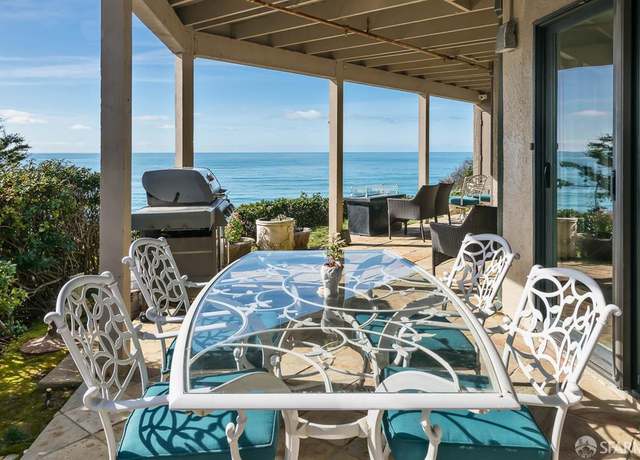
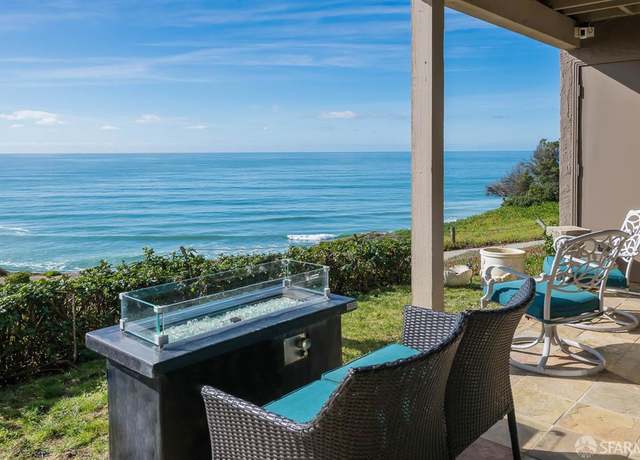
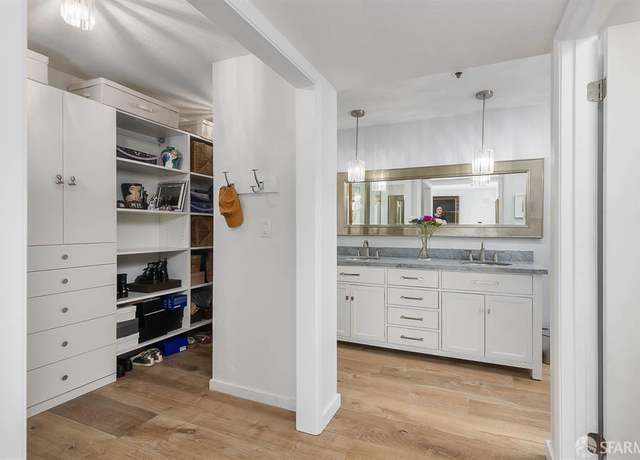
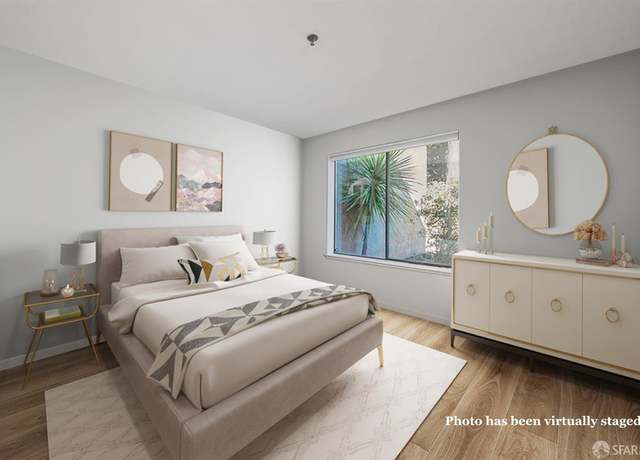
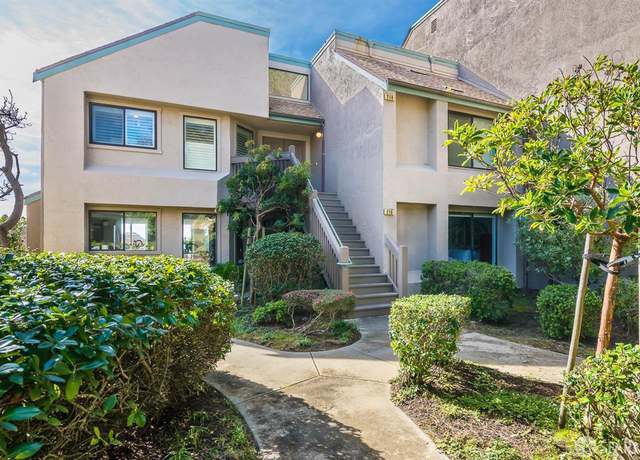
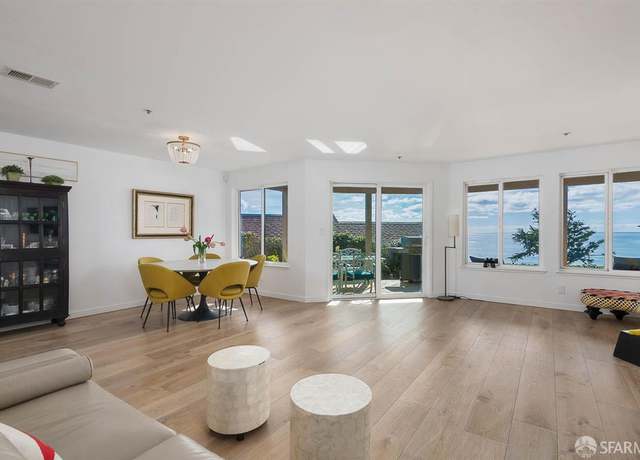
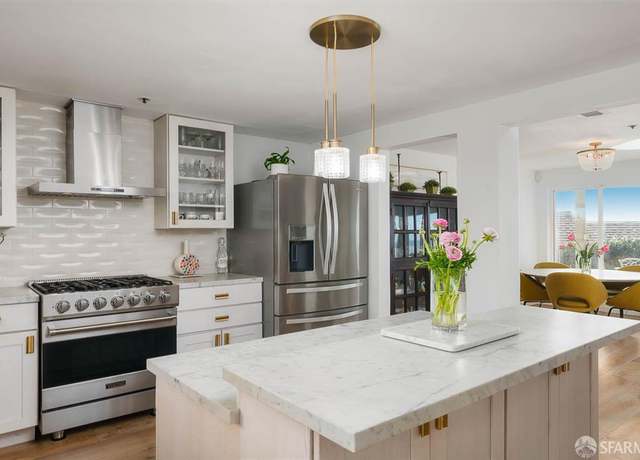
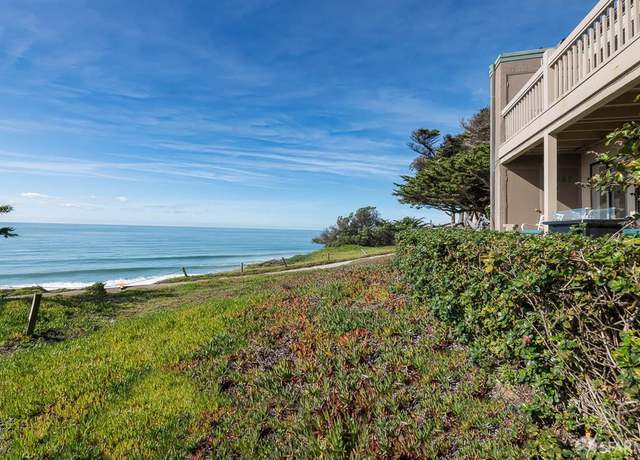
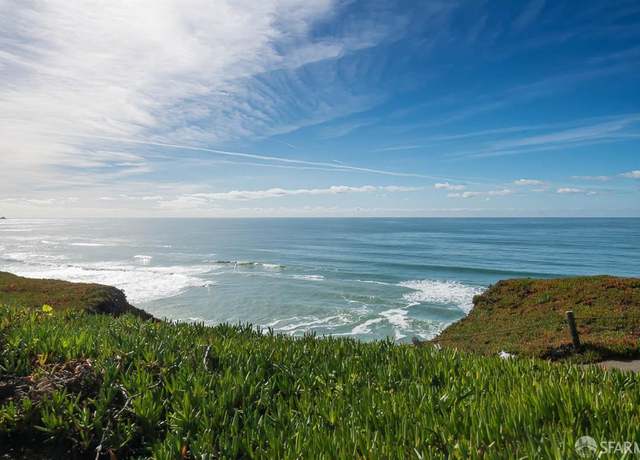
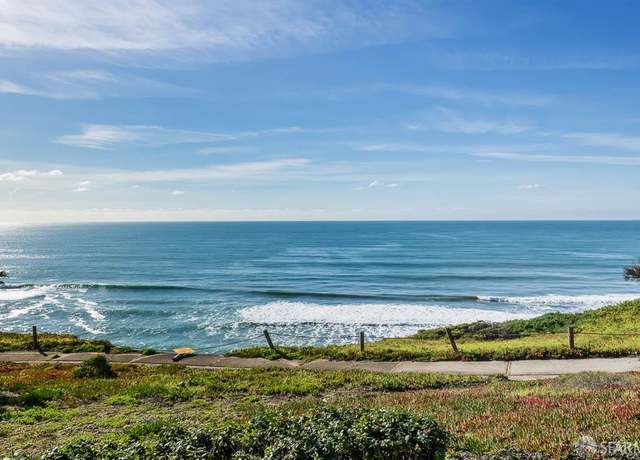
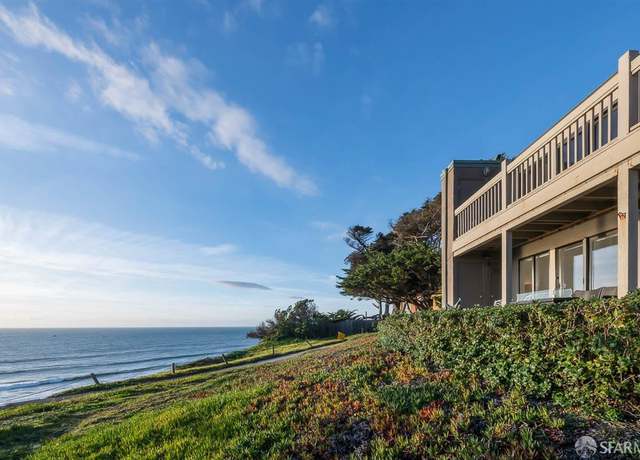
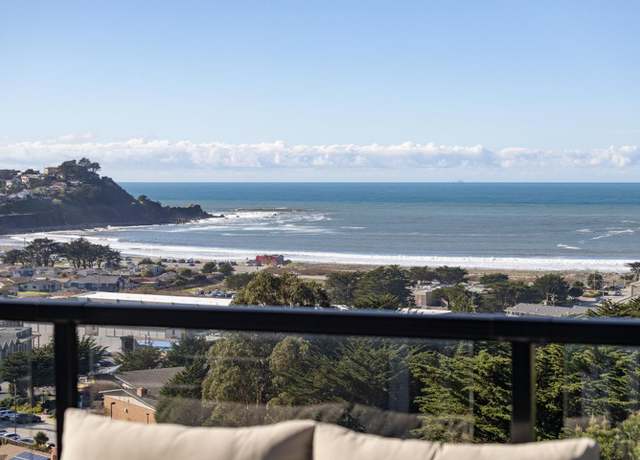
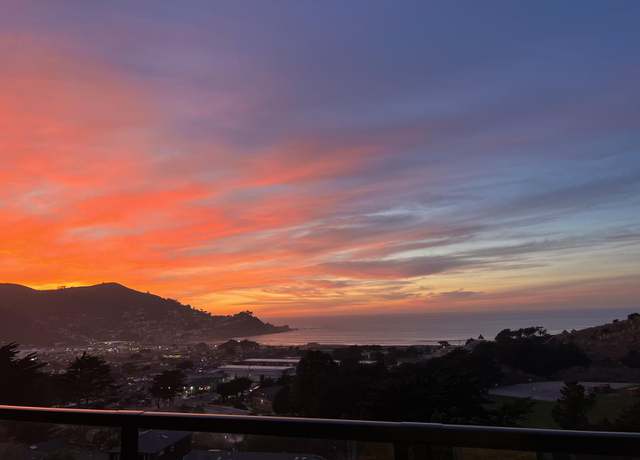
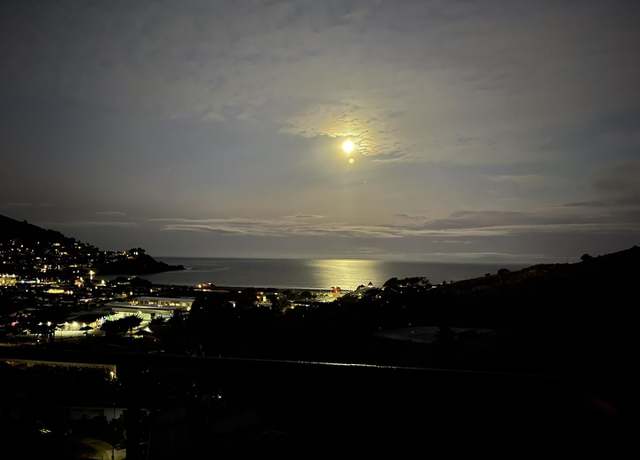
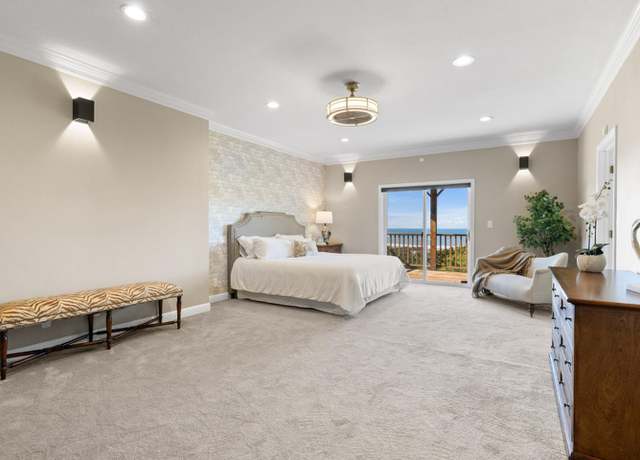
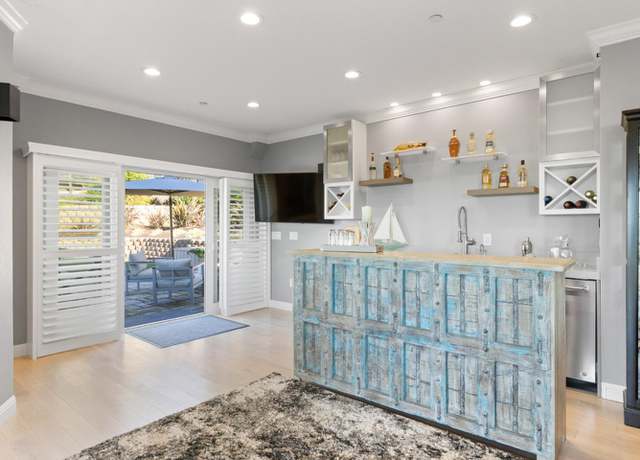
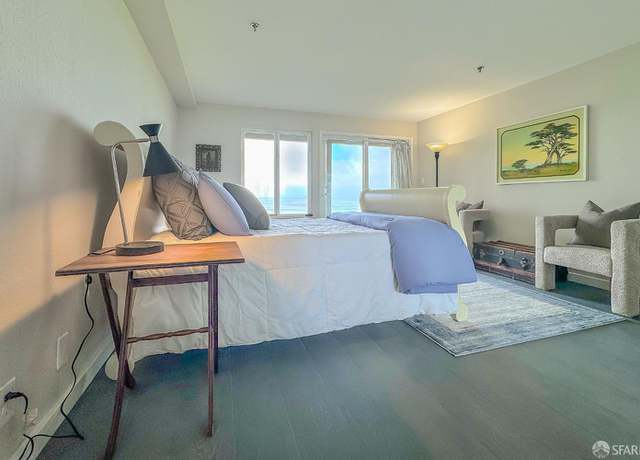
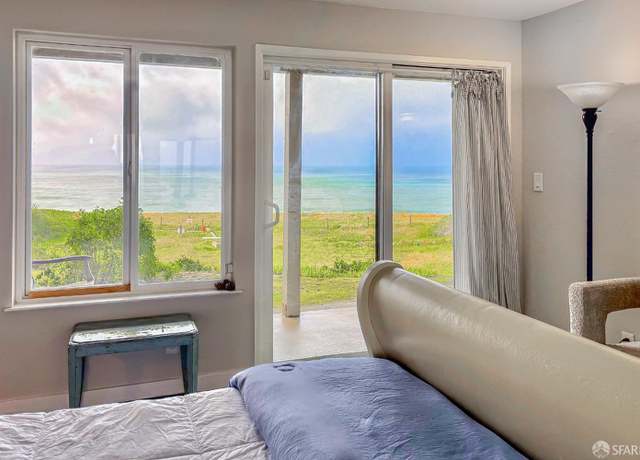
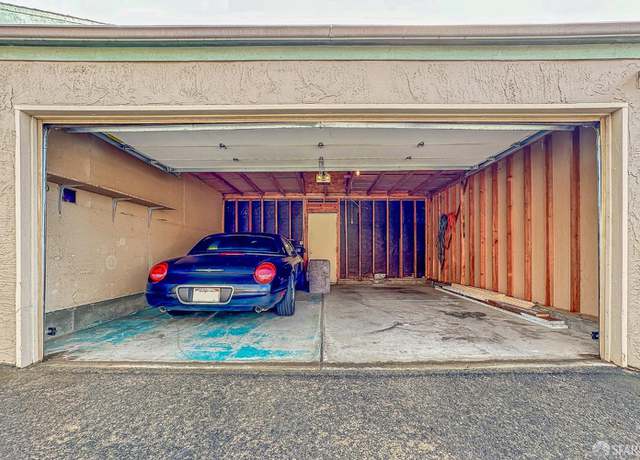
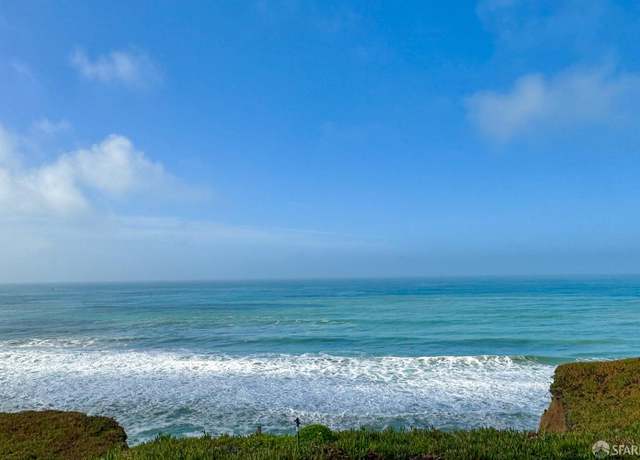
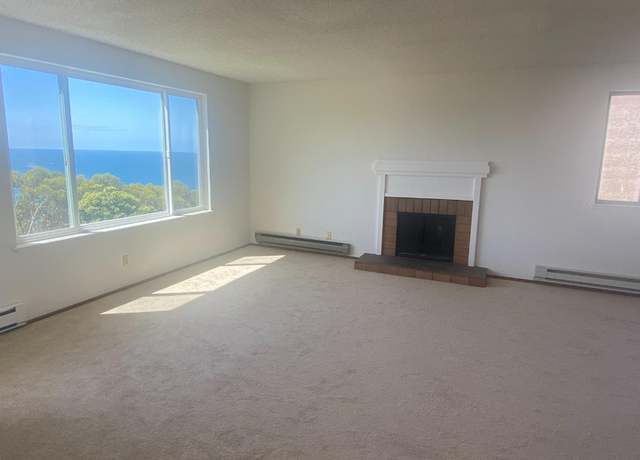
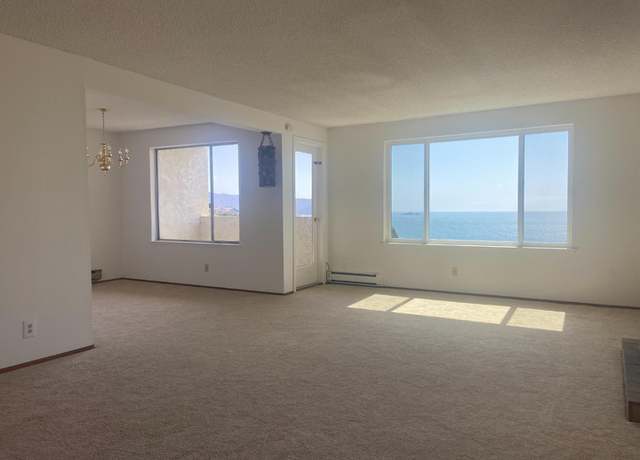
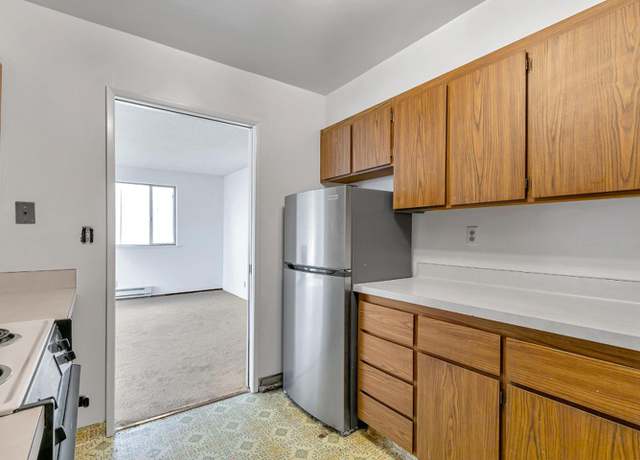
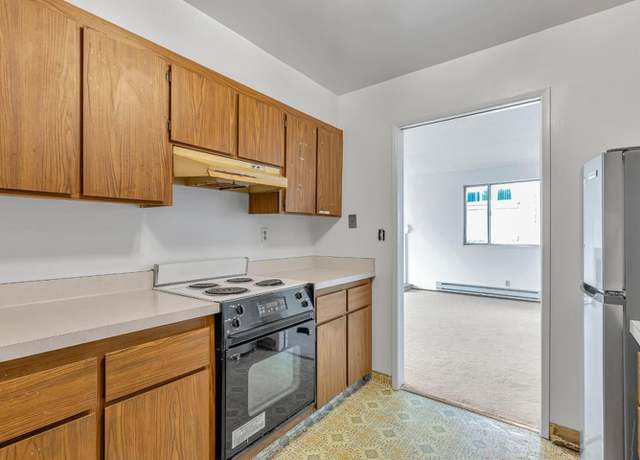
Find your bliss overlooking the Pacific Ocean in this stunning 2-bed, 2-bath single-level condo in beautiful Pacifica. Unobstructed, panoramic views and the soothing sounds of waves from your private patio. Fully remodeled designer kitchen with marble island, heath tile backsplash, Viking range, and sophisticated fixtures. Wide plank flooring covers the majority of the floors. The living/dining room has a wood burning fireplace and a wall of windows spanning the rear of the property. Large primary bedroom has Ocean Views and a gorgeously remodeled en-suite bathroom with a walk-in closet outfitted by California Closets. Separate guest bedroom and full bath. Two-car garage parking and large c
Welcome to Pacifica Heights - Where Luxury meets Serenity! Each residence has been meticulously designed with modern architecture, spacious layouts, and energy-efficient features, ensuring a comfortable and environmentally responsible lifestyle. 801 Fassler: An entertainer's delight with sophisticated design elements. Large kitchen w/ island which flows directly into your living and dining areas - creating a great room where memories will be created. Directly off the great room, sliding doors lead to your private patio area. Upstairs you will find a den / office / perfect to accommodate your lifestyle needs + a balcony situated directly off the den. Primary bed w/ private balcony + walk-in
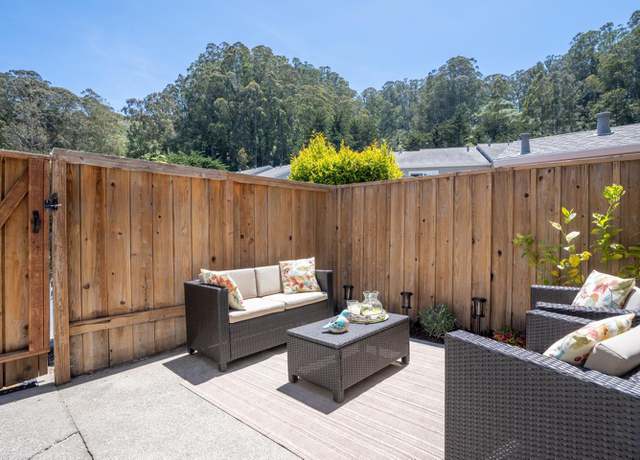
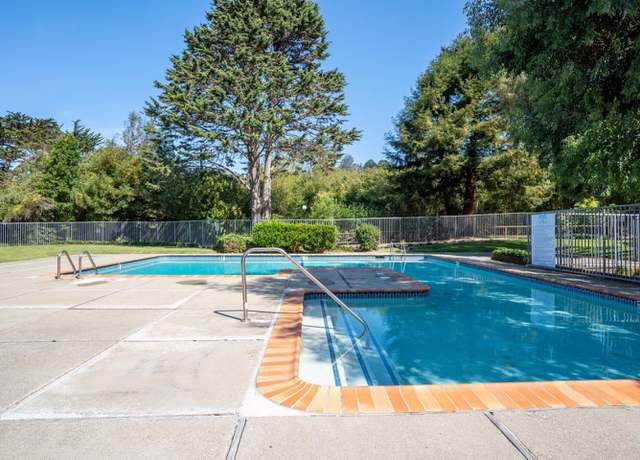
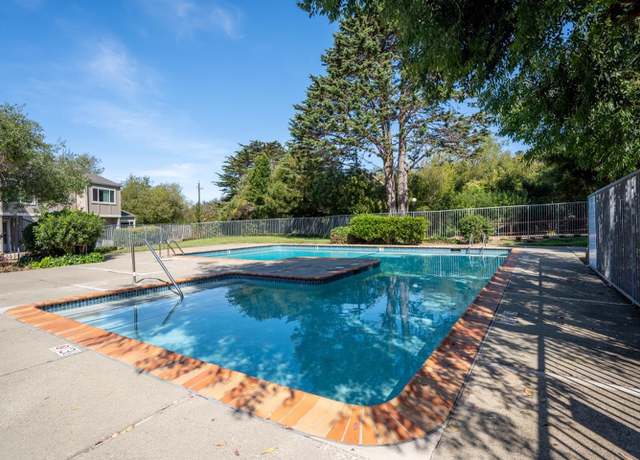
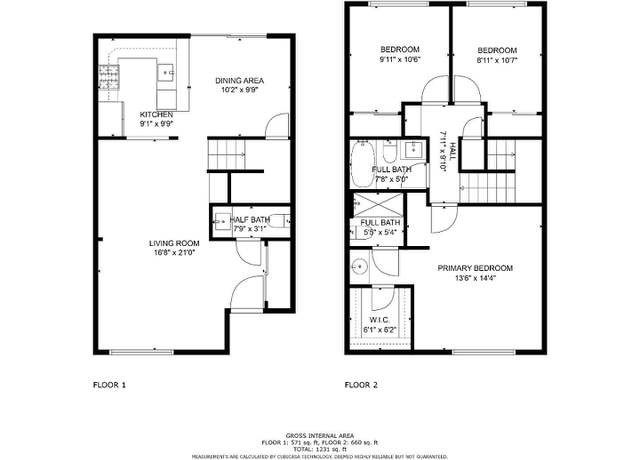
Fantastic Allternative to a Rancher. 2.5 baths and 1380 SF. POOL Side Townhouse in Sunny Linda Mar. Discover this elegant 3-bedroom, 2.5-bath townhome in the coveted Creekside community. The open living area is adorned with recessed lighting, flowing effortlessly into a kitchen upgraded with painted wood cabinets, stainless appliances, and an eat-in breakfast bar. The upper level houses a spacious main suite with a walk-in closet and private bath, plus 2 more bedrooms. Revel in new vinyl flooring, bathroom vanities, fixtures, and light fixtures throughout. Dedicated laundry room enhances comfort. Enjoy the fenced patio for BBQs, while a covered carport offers convenience. Relish the communi
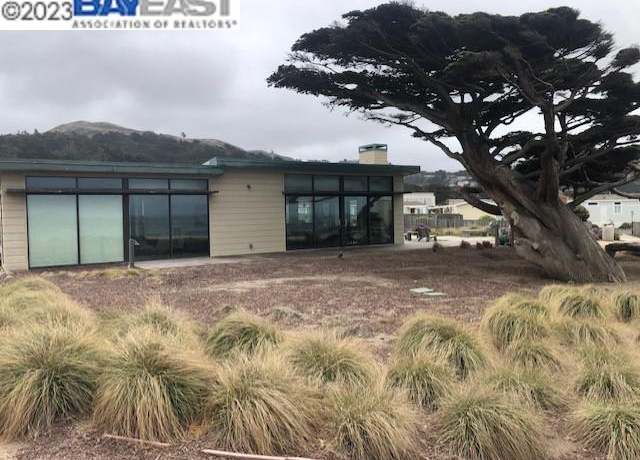
Magnificent Ocean View Estate! Just about every room in the house has a jaw dropping view. Recently completed addition has made this one of the biggest homes on the Coast. Perfect for multigenerational living and designed to be divided into 2 separate living spaces. Fabulous location as all this sits on a half-acre lot at the end of a cul-de-sac. Storage shed and RV parking area might be another great location for an additional ADU.
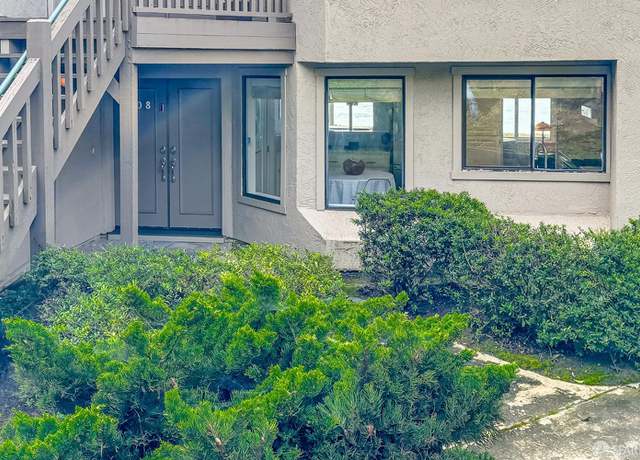
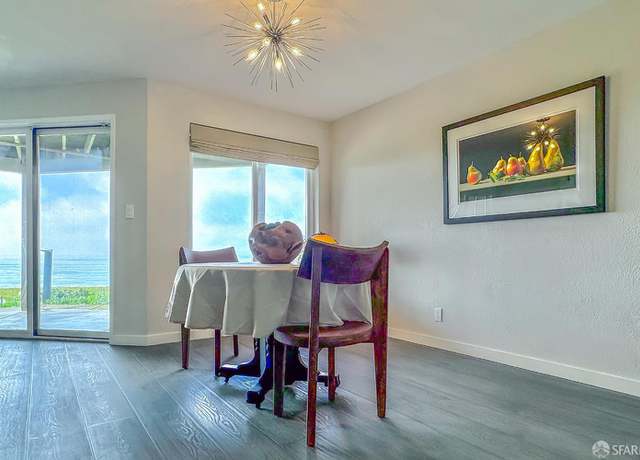
Experience serene coastal living at 208 Palmetto Avenue, an inviting ground-floor residence mere moments from San Francisco. As you step into this home, light grey engineered hardwood floors welcome you, leading to a spacious open living/dining area centered around a cozy wood-burning fireplace. A wall of windows frames the breathtaking ocean vista, extending to a wide covered patioan ideal spot to savor the ever-changing seascape. The chef's kitchen boasts top-tier Viking stainless steel appliances, complemented by quartz countertops, tile backsplashes, and a breakfast area, perfect for leisurely mornings. The expansive primary suite offers unobstructed ocean views, generous closet space,
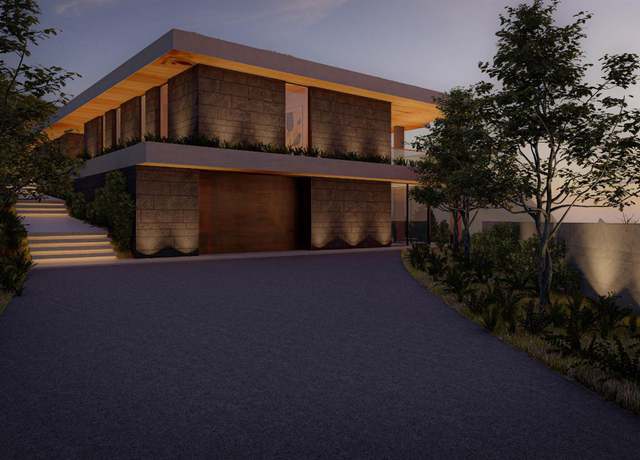
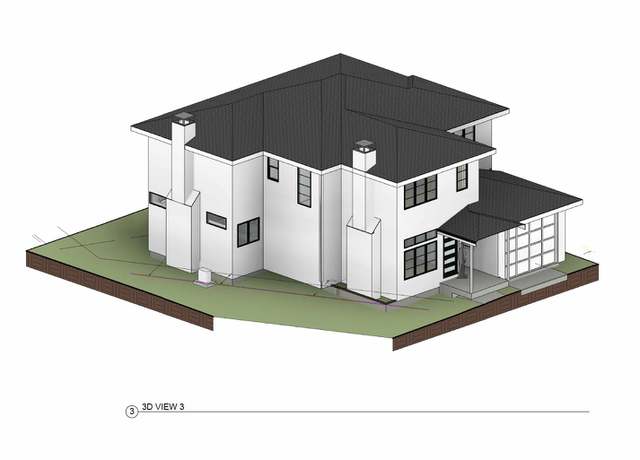
Tucked away in a private cul-de-sac in Pacificas coveted Vallemar neighborhood, 35 Aurora Court is getting the ultimate refresh! A complete remodel and addition will transform it into a revitalized 2,850sf, 3-bedroom, 3.5-bath home (plus a bonus room/office). The modern transformation will feature a spacious and efficient layout with soaring ceiling heights (9 upstairs/10 downstairs) and designer details punctuated throughout. The living room accordion doors will unfold to the verdant backyard and offer a breezy indoor/outdoor flow, perfect for entertaining and relaxed living on the coast. The kitchen will charm the home chef with professional series appliances, modern fixtures, and top-of-
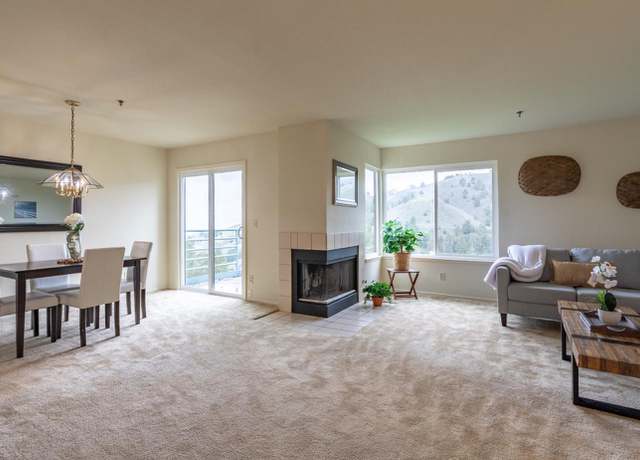
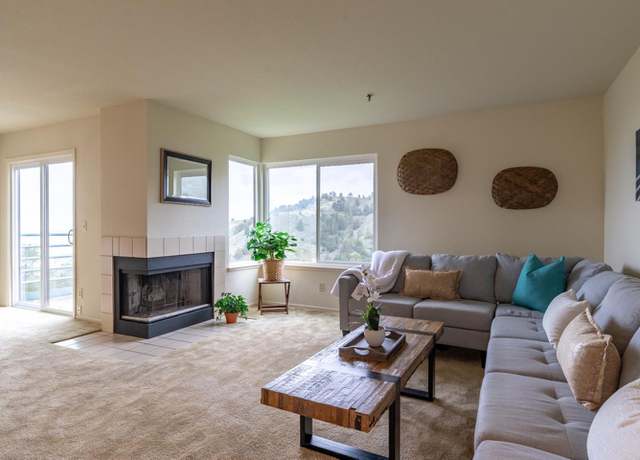
* * * Now offering 6 months of FREE HOA * * * Experience coastal living at its finest in this spectacular 2 bedroom, 2 bathroom with panoramic ocean views. The spacious and bright interior features 1,200 square feet of living space including a large living room, dining area, in-unit washer/dryer, and bedrooms with ample closet space. Garage parking for 1 vehicle with additional storage are included, along with overflow parking spaces for a second vehicle or guests. Conveniently located near shopping, restaurants, Esplanade Beach, Mussel Rock Park, and CA Highway-1, this condo offers a perfect blend of tranquility and accessibility. Don't miss the chance to make this oceanfront oasis yo
Best price & best ocean views in Pacifica! You will fall in love with this spacious & bright condo which offers 1,200 square feet of living space and spectacular views of the Pacific Ocean & the California Coast. This unit needs a little updating, but for this price it's truly an incredible value. You will enjoy watching the waves crash and the sun set from this peaceful & private property. The floor plan is great! The bedrooms are both large with lots of closet space, the living room is huge, and there is a separate dining area as well. Additional features include an in-unit washer/dryer and a covered outdoor patio with breathtaking views. The unit also comes with
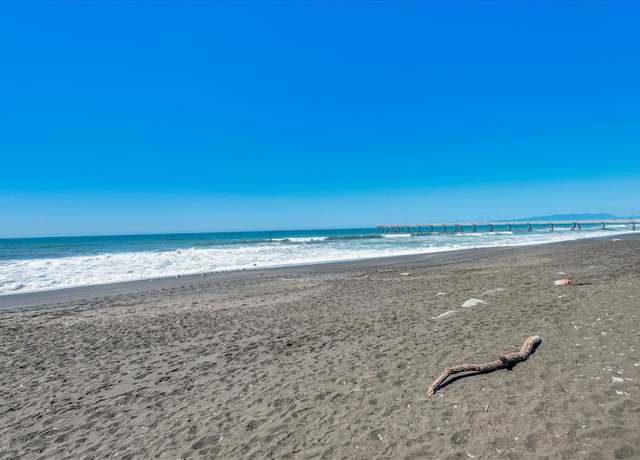
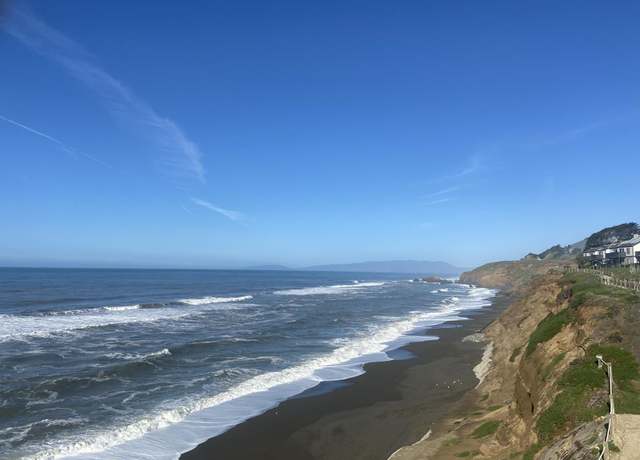
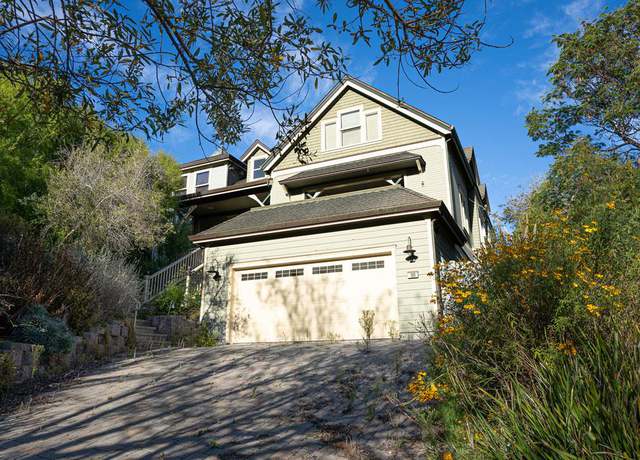
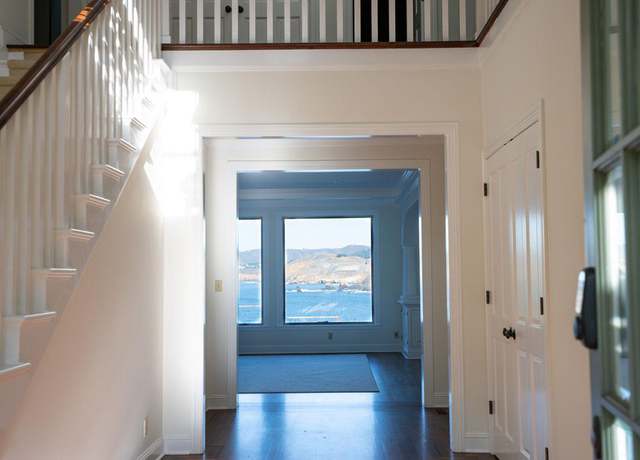
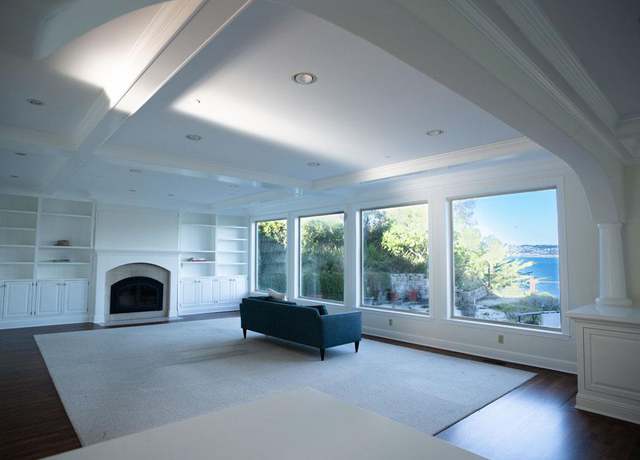
Oceanfront property with stunning views of the Pacific Ocean and Linda Mar Beach. Located in Pacifica's coveted westside Pedro Point neighborhood, this 2-story, 3,910+/- sqft home sits on an oversized 9,180+/- sqft lot. The residence boasts a spacious layout with multiple bedrooms & bathrooms, a gourmet kitchen, ample storage and an attached 4-car garage as well as mature landscaping and a private backyard. NOTE: This property is priced below market value due to problematic geological and geotechnical issues that impact the use and desirability of the property. Sellers have engaged various soils consultants, geologists and geotechnical engineers to evaluate the condition of the prope
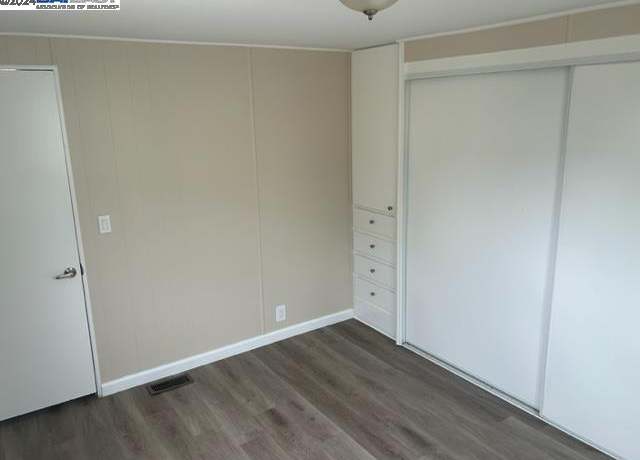
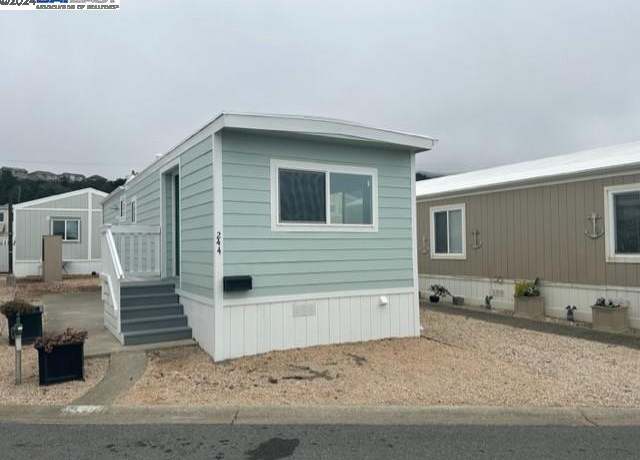
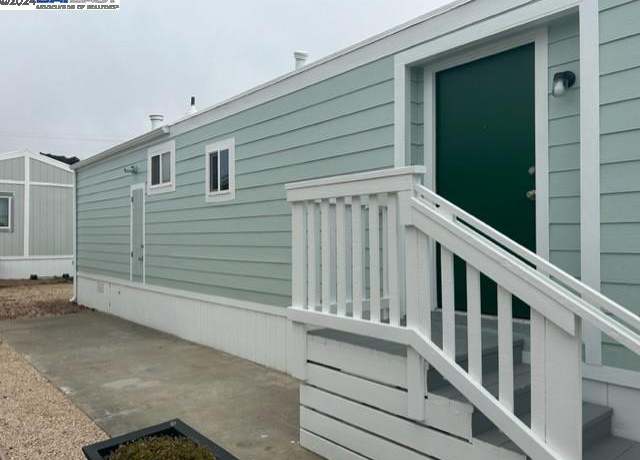
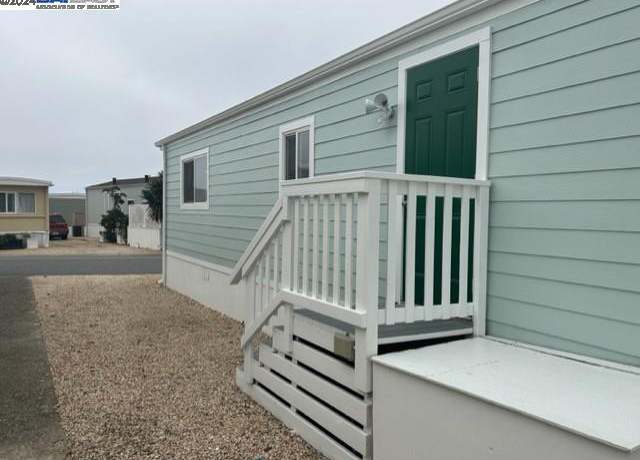
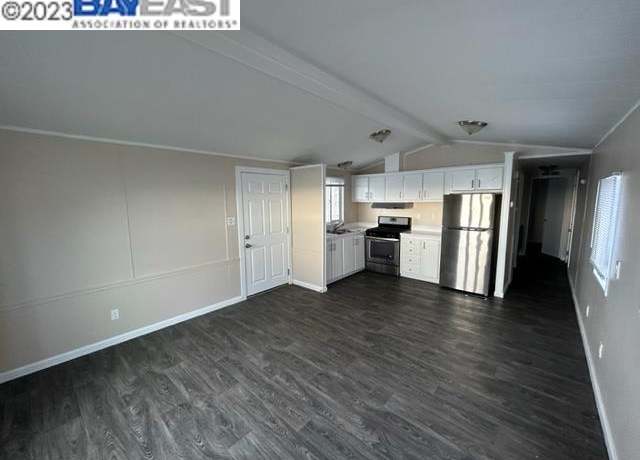
Ready for Move In! This two bedroom, one bath newer manufactured home is ready for move in. Great location as community in near the Pacific Ocean. Home has: vaulted ceilings; laminate flooring; open kitchen/living area; light and bright colors throughout; washer and dryer in unit. The Viewpoint at Seaside is an all-age mobile home park. The community is pet friendly and amenities included: club house, walking paths fire pit, BBQ grill and more. Monthly Space rent is $2800 plus utilities.
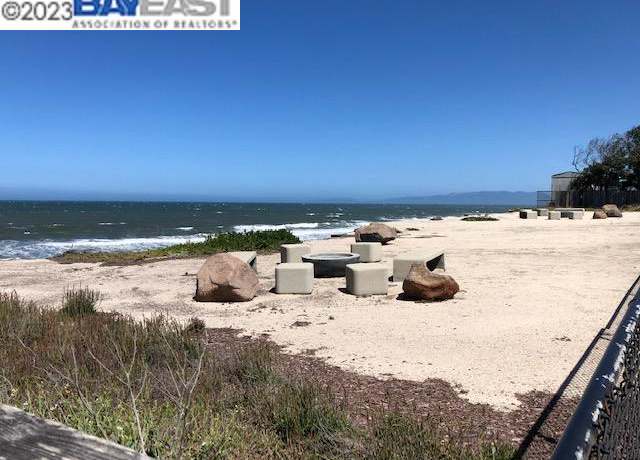
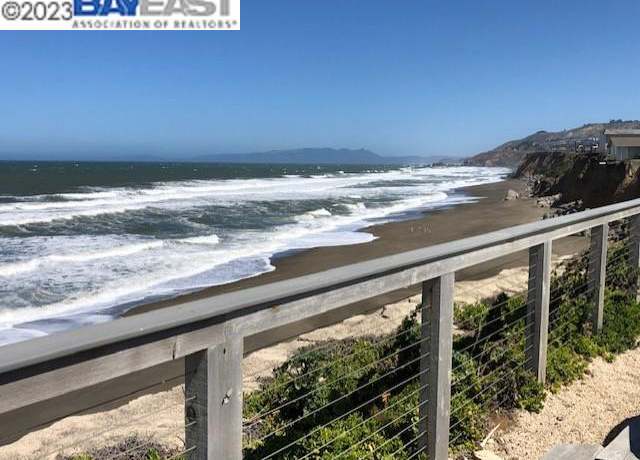
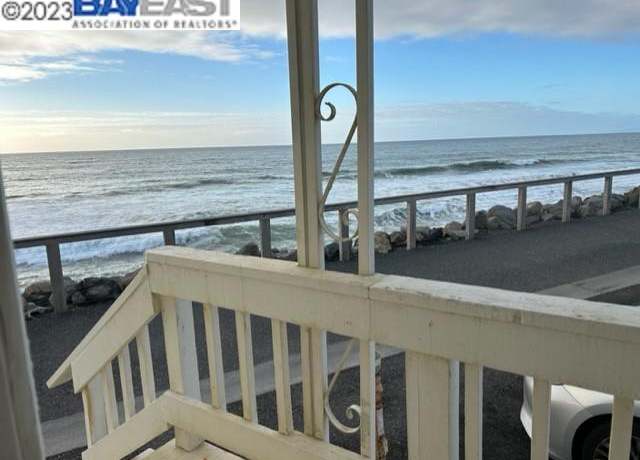
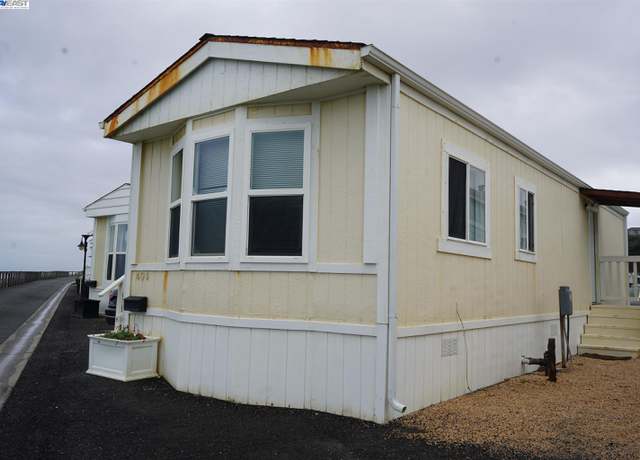
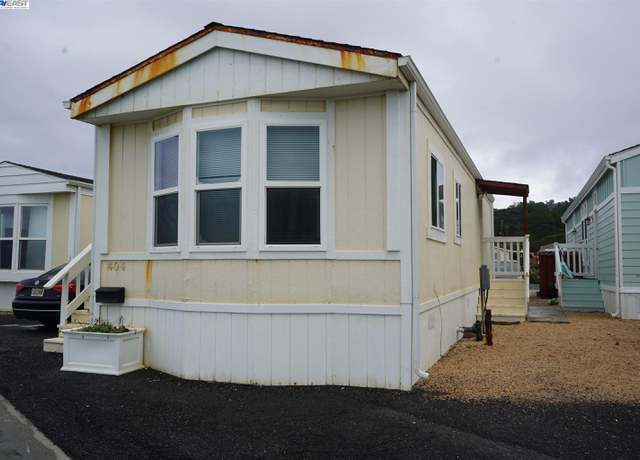
This mobile home in Pacifica is ready for move in. All age community with an amazing view of the Pacific Ocean. Enjoy your morning coffee while relaxing on the front porch as you take in the waves. This manufactured home has 1 bedroom and 1 bath; open kitchen with adjacent dining space; indoor laundry area with washer and dryer included. This home is in the mobile home park, The Viewpoint at Seaside is an all-age mobile home park. The community is pet friendly and amenities included: club house, walking paths fire pit, BBQ grill and more. Monthly Space rent is $2850 plus utilities.
LOCATION, LOCATION, LOCATION! Ready for Move In! This one bedroom one bath manufactured home has been recently updated inside; amazing view of the Pacific Ocean; kitchen with stainless steel appliances; light and bright colors throughout; washer and dryer in unit. The Viewpoint at Seaside is an all-age mobile home park. The community is pet friendly and amenities included: club house, walking paths fire pit, BBQ grill and more. Monthly Space rent is $2900 plus utilities.
Best of both worlds! Live in Vallemar with an OCEAN VIEW. Rare opportunity to build your dream home on almost a quarter acre (. 22) OCEAN VIEW LOT. End of a cul-de-sac. Located almost at the top of Reichling Av. Ocean, mountains and the valley views. Close to schools, the beach, highway and SFO.
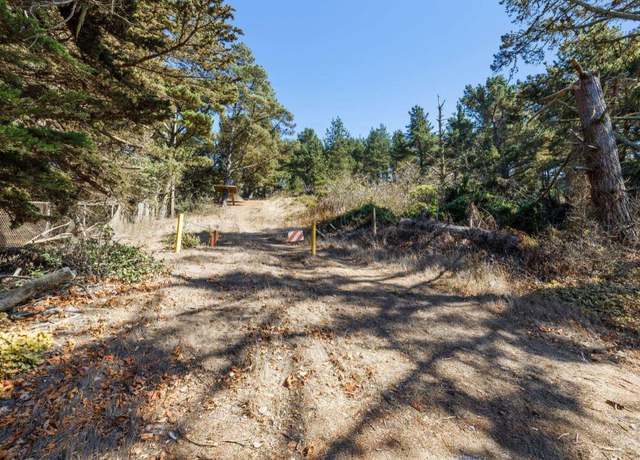
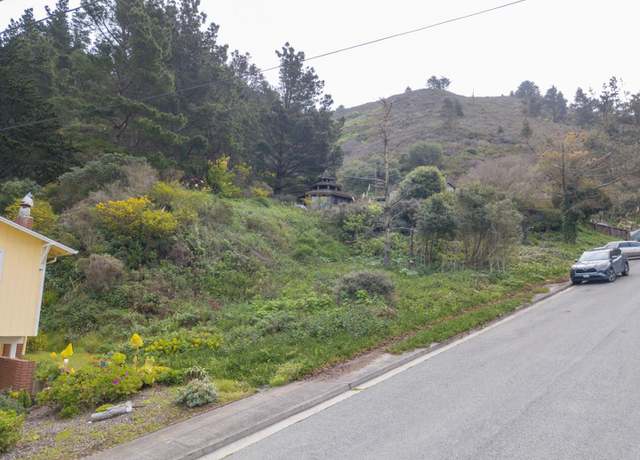
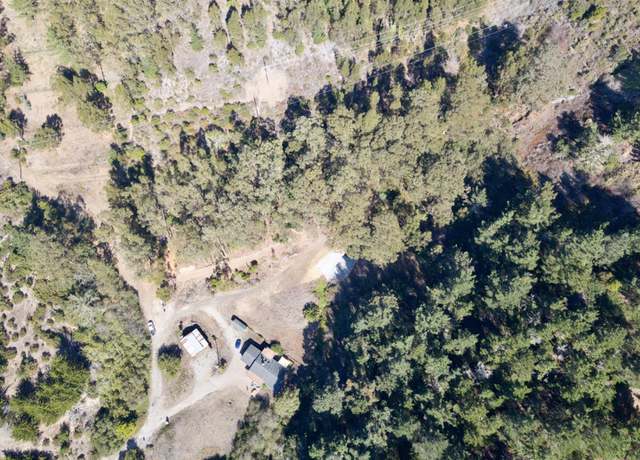
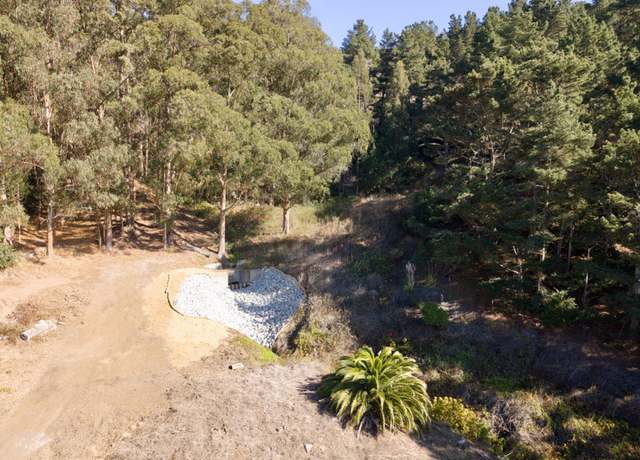
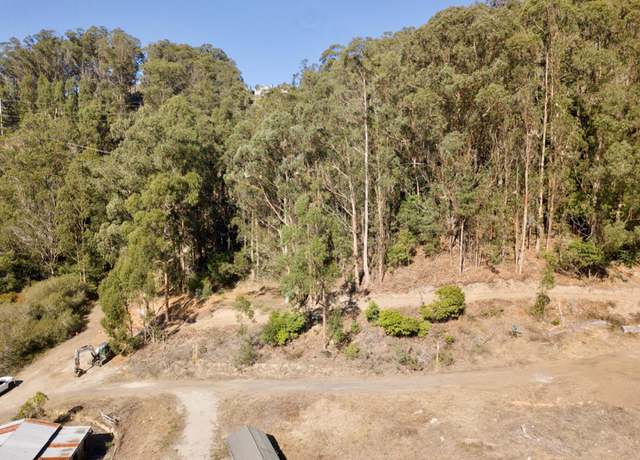
The feeling being on this property is something you need to experience for yourself. It's a dream come true to find 2+ acres to build the house you've always imagined. Truly live in the country on your own acreage and still commute to SF/SFO within 15 minutes. 6 and 8 Hinton Ranch are vacant land, ready for you to build to suit. The development plan allows one home per lot. Utilities are nearby according to the site map. Buy 1 or Buy Multiples. Each of the 3 properties is priced separately.
School data is provided by GreatSchools, a nonprofit organization. Redfin recommends buyers and renters use GreatSchools information and ratings as a first step, and conduct their own investigation to determine their desired schools or school districts, including by contacting and visiting the schools themselves.Redfin does not endorse or guarantee this information. School service boundaries are intended to be used as a reference only; they may change and are not guaranteed to be accurate. To verify school enrollment eligibility, contact the school district directly.
Homes for sale in Pacifica have a median listing price of $1.2M. Some of these homes are Hot Homes, meaning they're likely to sell quickly.
What are some of the most popular neighborhoods in Pacifica?
Popular neighborhoods include Linda Mar, Vallemar, Avalon, Crestmoor, Park Pacifica, Pacific Manor, Rockaway, Westborough, Shelter Creek Condos, and Serramonte.
Pacifica, California, is well-served by a variety of transportation options, including public transit. The city's roads are generally free-flowing, although during peak hours, you may experience some traffic congestion, particularly if you're driving a car. Public transportation is available through SamTrans, which provides bus services throughout Pacifica and the surrounding areas. For those who prefer to drive, the city is conveniently located near several major highways, including the Cabrillo Highway (Highway 1), offering easy access to other parts of California. Learn more on our Pacifica city guide.
What types of properties are available in Pacifica?
Pacifica, California offers a variety of single-family home types, including ranch-style homes, contemporary homes, and modern homes, each with their own unique architectural styles and designs. These homes can be found throughout Pacifica, California, from the coastal neighborhoods to the inland areas, providing residents with a range of options to choose from. Most properties in Pacifica, California feature multiple bedrooms and were built in various years, ensuring a diverse selection for potential buyers. To explore different property types for sale in Pacifica, California, use the 'Home type' filter located above the active listings. Customize your search by selecting options like single-family homes, condos, townhomes, and more.
What is life like in Pacifica?
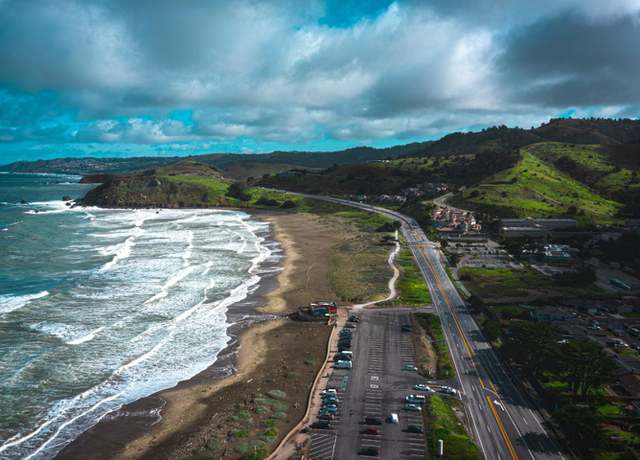
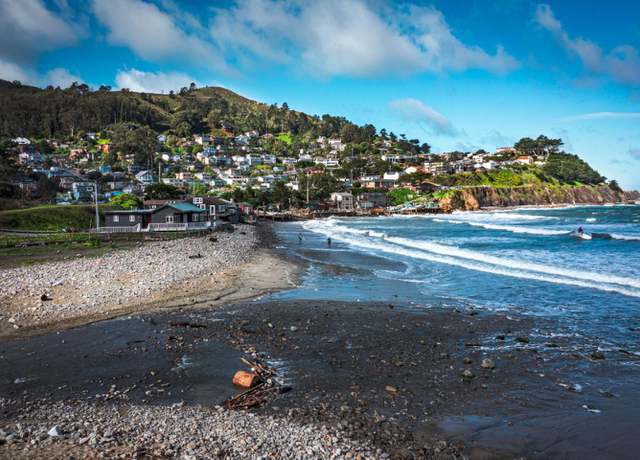
Living in Pacifica, California offers a unique coastal experience with breathtaking views of the Pacific Ocean. The landscape is characterized by rugged cliffs, pristine beaches, and rolling hills. The weather is influenced by the ocean, resulting in cool summers and mild winters. The town provides a range of job opportunities, including positions in the local retail, hospitality, and service industries. Residents can enjoy a variety of recreational activities such as hiking, surfing, and exploring the numerous parks and trails in the area.
What are the schools and amenities like in Pacifica?
Pacifica, California, offers a range of public amenities to cater to the needs of its residents. You can enjoy a variety of cuisines at multiple restaurants scattered throughout the city. The city is home to several parks, providing ample green spaces for relaxation and recreation. For your daily needs, there are numerous grocery stores available within the city limits. Additionally, Pacifica offers more amenities like libraries, fitness centers, and community centers, enhancing the quality of life for its residents.
In the past month, 15 homes have been sold in Pacifica. In addition to houses in Pacifica, there were also 5 condos, 6 townhouses, and 1 multi-family unit for sale in Pacifica last month. Pacifica is a minimally walkable city in San Mateo County with a Walk Score of 45. Pacifica is home to approximately 37,017 people and 4,371 jobs. Find your dream home in Pacifica using the tools above. Use filters to narrow your search by price, square feet, beds, and baths to find homes that fit your criteria. Our top-rated real estate agents in Pacifica are local experts and are ready to answer your questions about properties, neighborhoods, schools, and the newest listings for sale in Pacifica. Our Pacifica real estate stats and trends will give you more information about home buying and selling trends in Pacifica. If you're looking to sell your home in the Pacifica area, our listing agents can help you get the best price. Redfin is redefining real estate and the home buying process in Pacifica with industry-leading technology, full-service agents, and lower fees that provide a better value for Redfin buyers and sellers.


 REDFIN IS COMMITTED TO AND ABIDES BY THE FAIR HOUSING ACT AND EQUAL OPPORTUNITY ACT. READ REDFIN'S FAIR HOUSING POLICY AND THE NEW YORK STATE FAIR HOUSING NOTICE.
 United States
 Canada