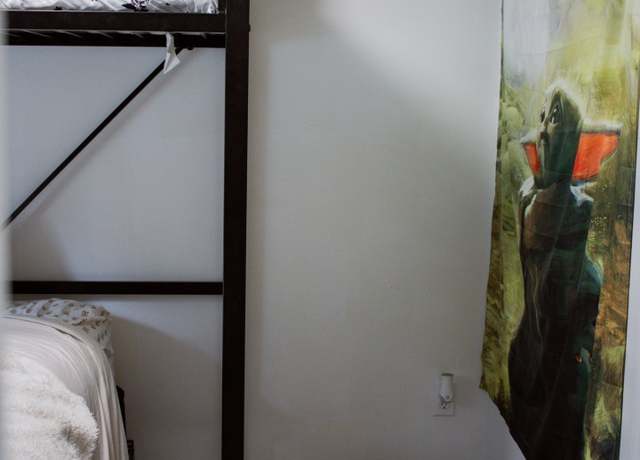
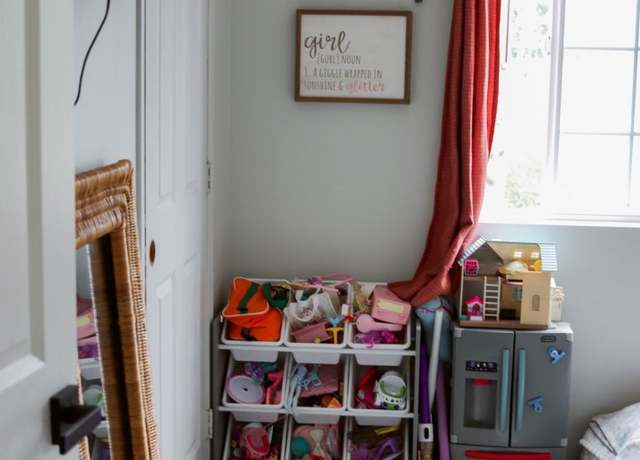
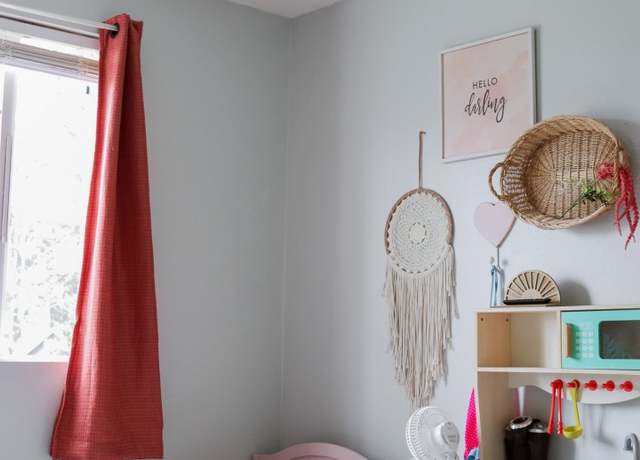
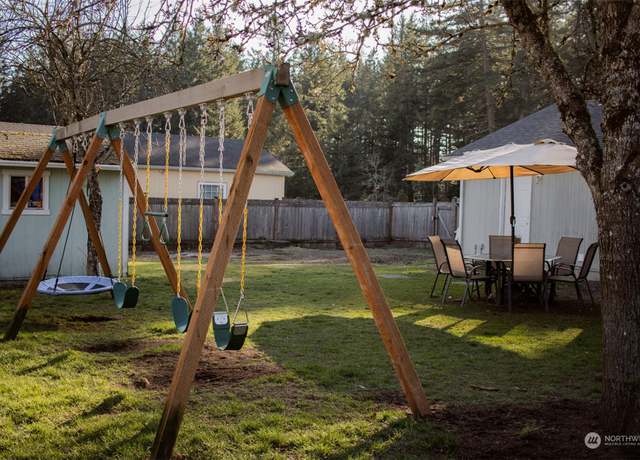
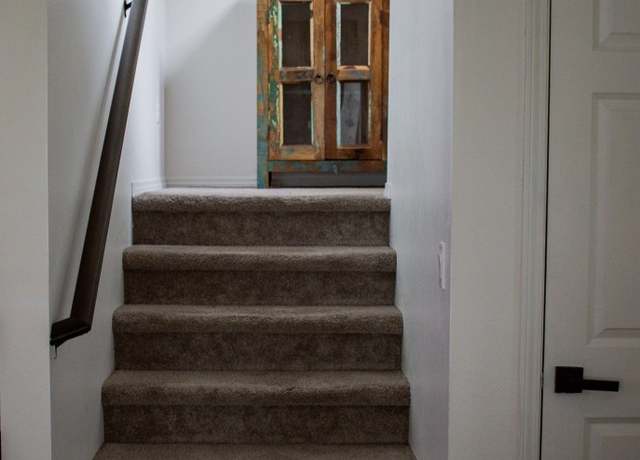
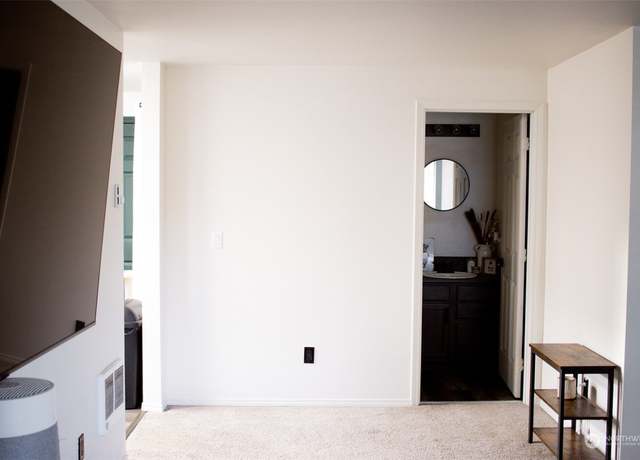
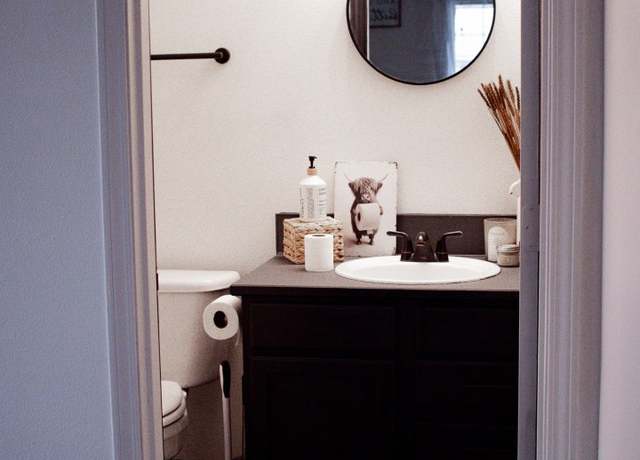
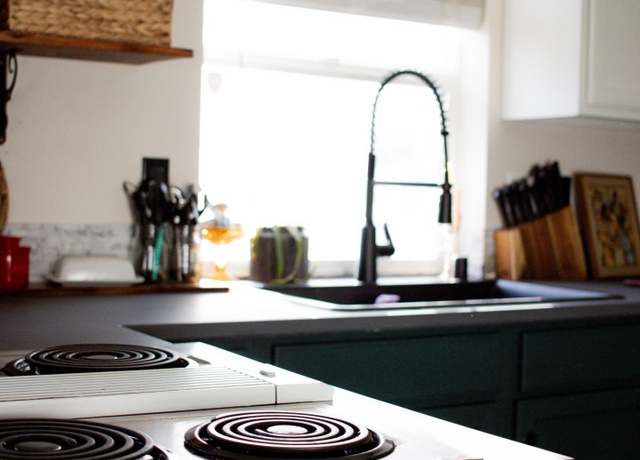
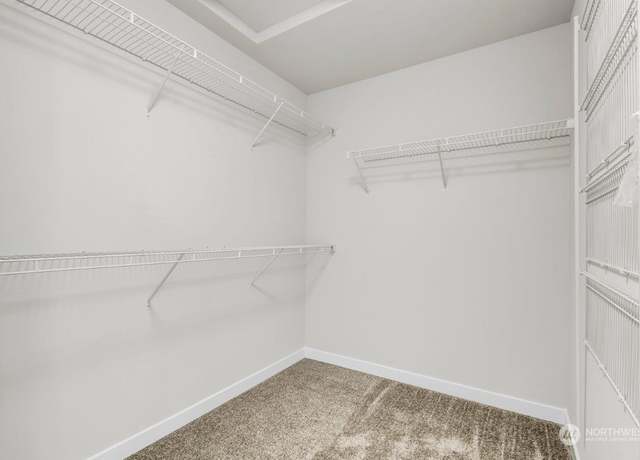
Welcome to our cozy two-story home in Rainier, WA. Nestled in a peaceful neighborhood, this retreat offers relaxation and comfort. Step onto the porch and enjoy tranquil views of trees and sunsets. Inside, find a welcoming living area and a kitchen with a pantry and breakfast bar. The garage is equipped with an extra fridge and tool benches for DIY enthusiasts. Upstairs, discover the master bedroom, two baths, and walk-in closets in each bedroom. A single window illuminates the stairway, adding charm to the space. Outside, enjoy the spacious backyard with an apple tree and swing set. With a new roof and fresh paint, this move-in ready home is waiting for you to make it your own.
1/39
$450,000
3 beds2.5 baths3,659 sq ft0.30 acre (lot)
503 Rainier Acres Rd SE, Rainier, WA 98576
Listing provided by NWMLS as Distributed by MLS Grid
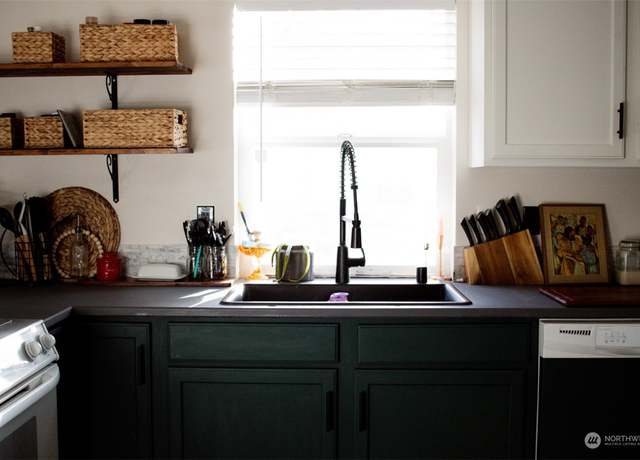
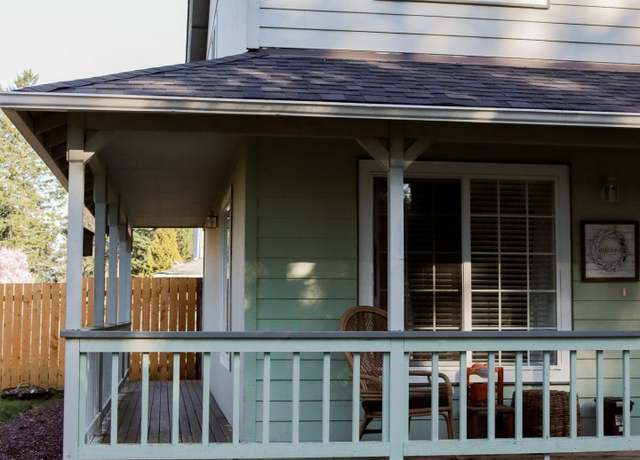
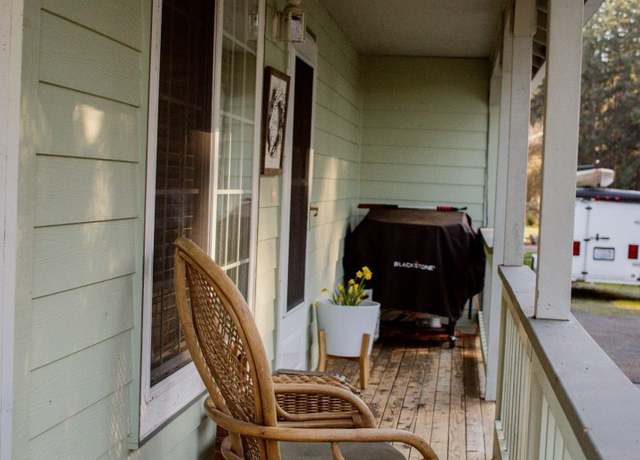
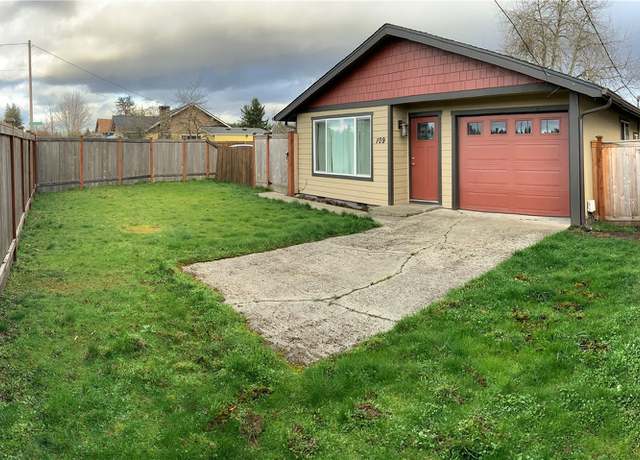
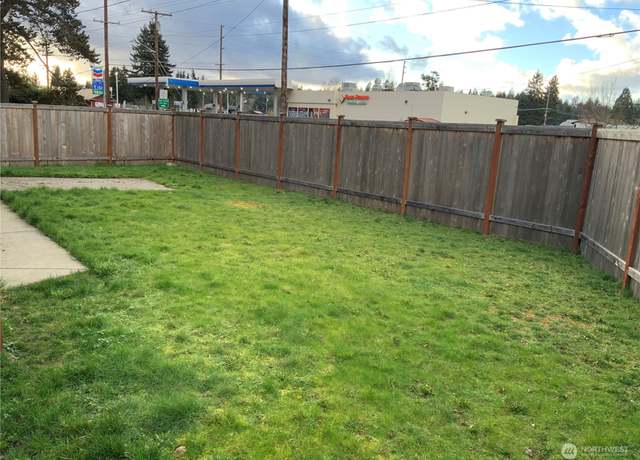
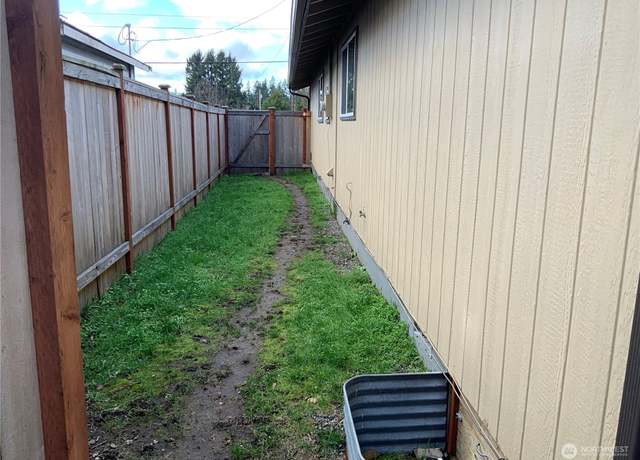
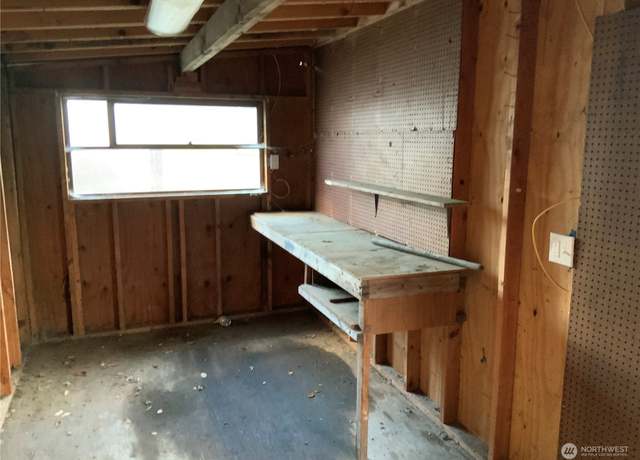
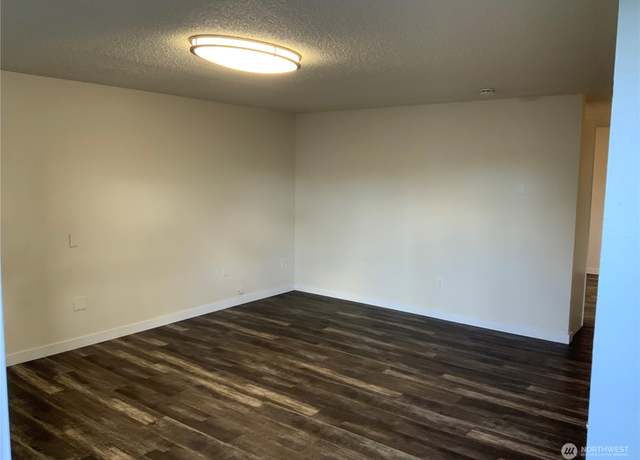
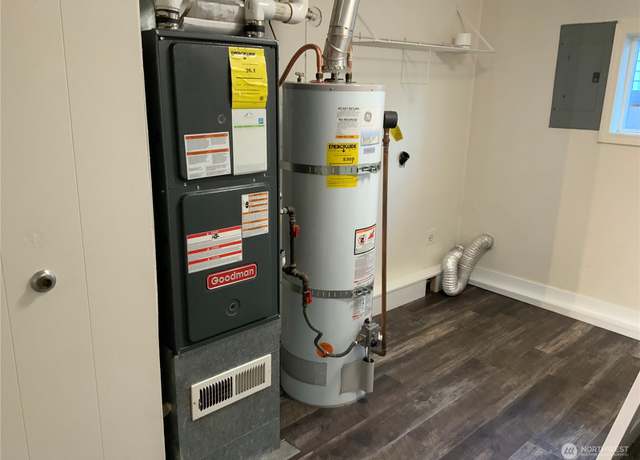
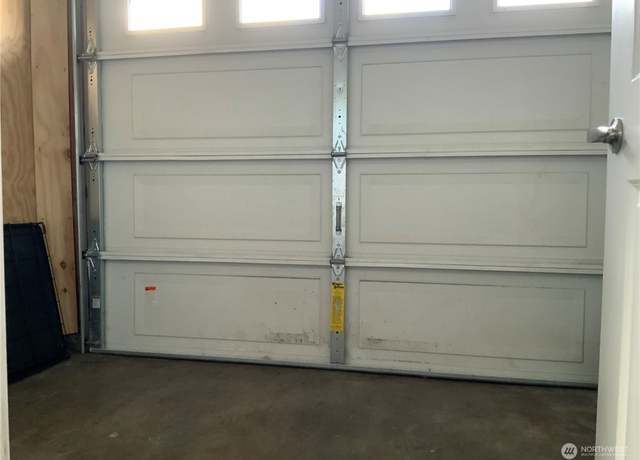
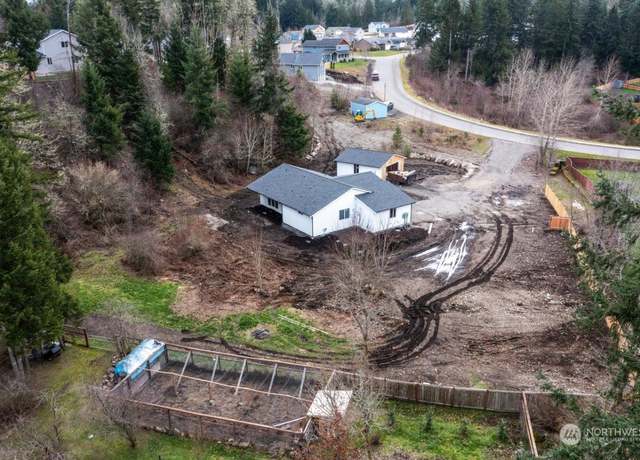
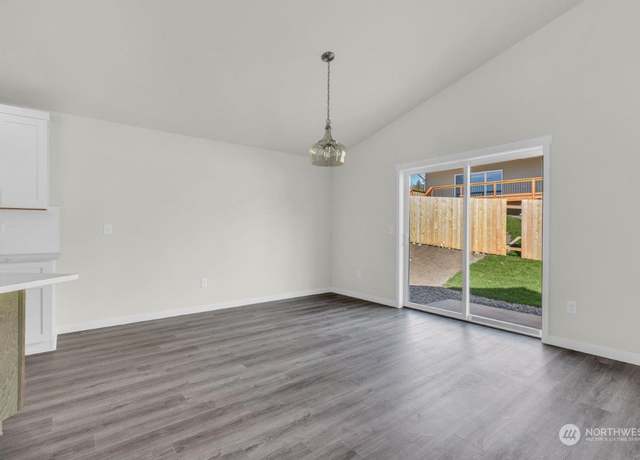
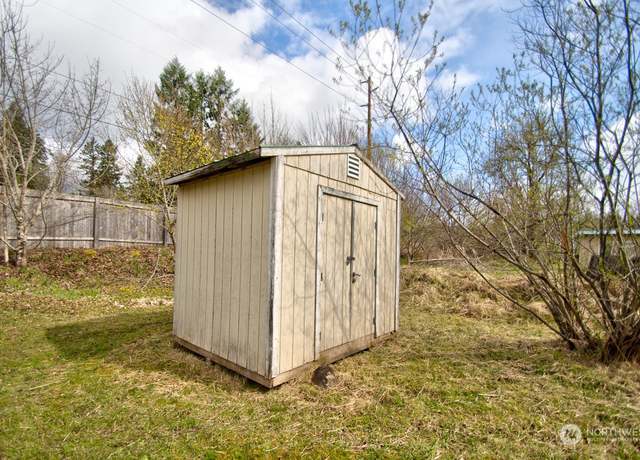
Come see this Rambler located in beautiful Rainier! This 3 bed, 1 bath is loaded w/ updates galore! Roof was replaced in 2020 w/ 30 year roof, siding, gutters, vinyl windows, crawl space clean out, Newer doors, mill work & VP flooring throughout. Kitchen updated in 2020 w/ SS appliances, cabinets & quartz tops. Newer bathroom w/ new fixtures, vanity & quartz top. Completely fenced backyard w/ a covered patio, garden space & shed. Easy access to Lacey, Olympia & JBLM!
1/39
$399,900
3 beds1 bath1,034 sq ft7,000 sq ft (lot)
109 SE Binghampton, Rainier, WA 98576
Listing provided by NWMLS as Distributed by MLS Grid
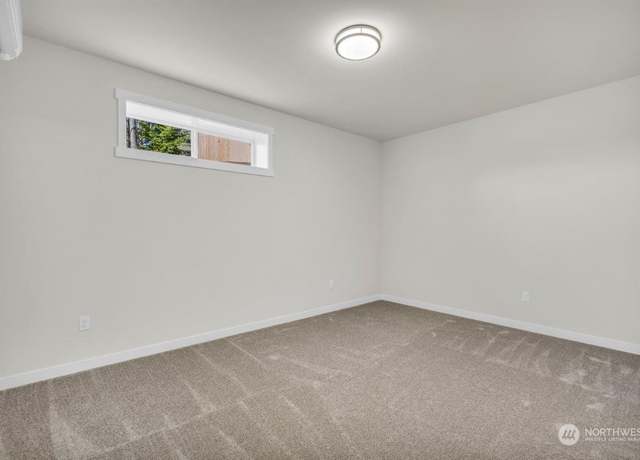
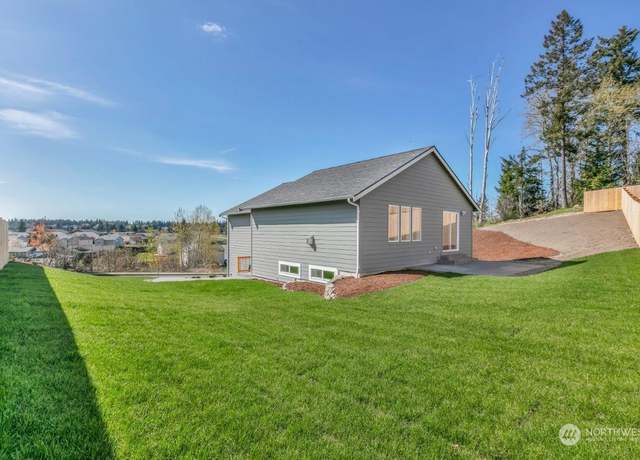
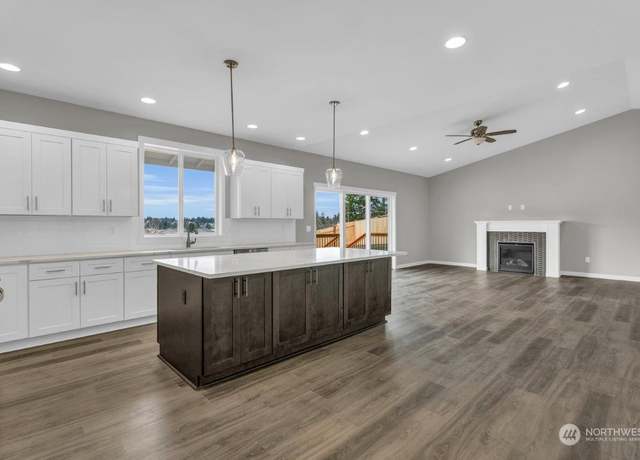
The Nisqually plan, a must-see new construction Rambler in Trotter Downs. This house will have it all including 26x30 SHOP! Luxury Vinyl Plank flooring throughout the entry, living room, kitchen and dining room adds style, character and easy clean up. The kitchen features white painted cabinets, 3cm quartz counter tops, a large island, and a walk-in pantry. Find 3 bedrooms and an office on the main floor. Enjoy 9ft ceilings with a vaulted living room, white millwork wrapped windows throughout the entire home. Take entertainment to your back yard where you'll enjoy a huge, covered patio, on 1.54 acres. some Photos of a like home.
1/10
$749,950
3 beds2 baths1,946 sq ft1.56 acres (lot)
602 Myers St SE #92, Rainier, WA 98576
Listing provided by NWMLS as Distributed by MLS Grid
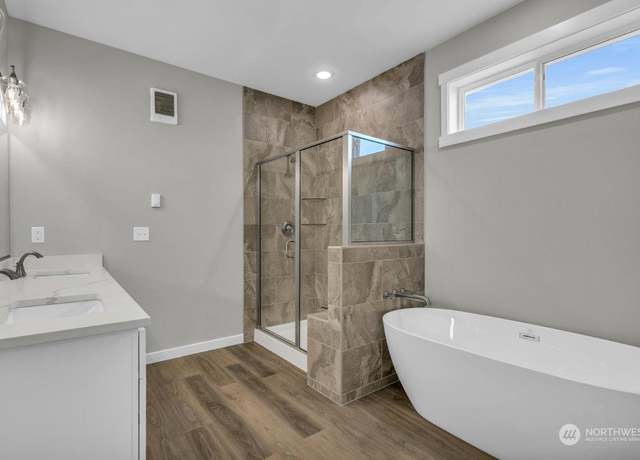
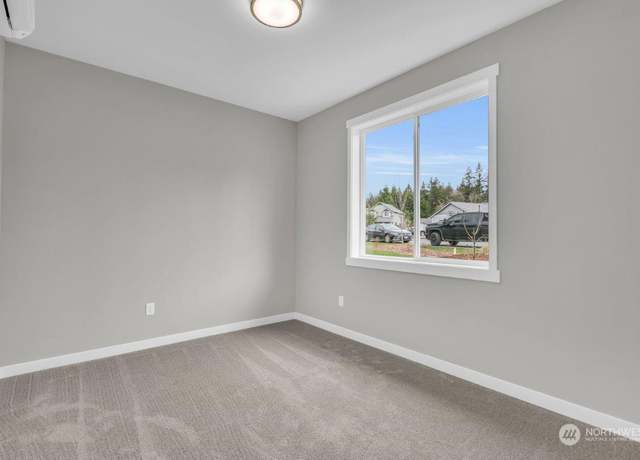
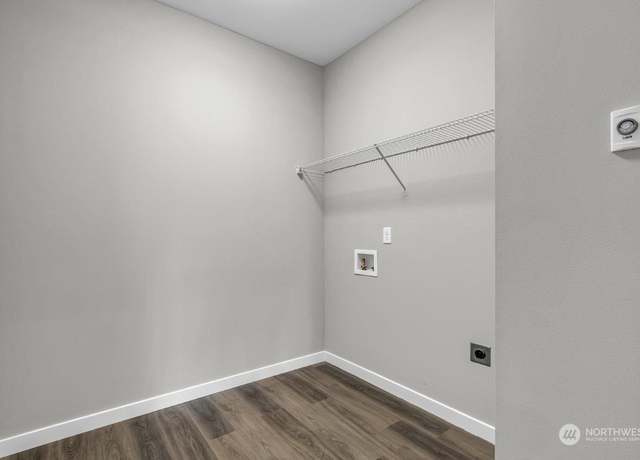
$10k Buyers Bonus available. Looking for new construction on large lots? Trotter Downs is just what you're looking for! Introducing the Tahoma plan, a home that has it all! LVP flooring kitchen and dining room adds style, character and easy cleanup. The kitchen features white painted cabinets, 3cm quartz countertops, large island, and a walk-in pantry. This home has a spacious bonus room and an office. Enjoy 9ft ceilings and white millwork wrapped windows throughout the entire home. The primary bath will feature a tile shower and free-standing soaker tubs. Take entertainment to your back yard where you'll enjoy a deck off the back patio. * Photos of a like home * estimate completion Ma
1/31
$599,950
3 beds3 baths2,438 sq ft0.29 acre (lot)
604 Myers St SE #91, Rainier, WA 98576
Listing provided by NWMLS as Distributed by MLS Grid
MOVE in READY! $10k Buyers Bonus available. Introducing the Nisqually plan, a must-see new construction Rambler in Trotter Downs. This house will have it all! Luxury Vinyl Plank flooring throughout the entry, living room, kitchen and dining room adds style, character and easy clean up. The kitchen features white painted cabinets, 3cm quartz counter tops, a large island, and a walk-in pantry. Find 3 bedrooms and an office on the main floor. Enjoy 9ft ceilings with a vaulted living room, white millwork wrapped windows throughout the entire home. Take entertainment to your back yard where you'll enjoy a huge, covered patio.
1/27
$574,950
3 beds2 baths1,946 sq ft0.29 acre (lot)
906 Cody St SE #87, Rainier, WA 98576
Listing provided by NWMLS as Distributed by MLS Grid
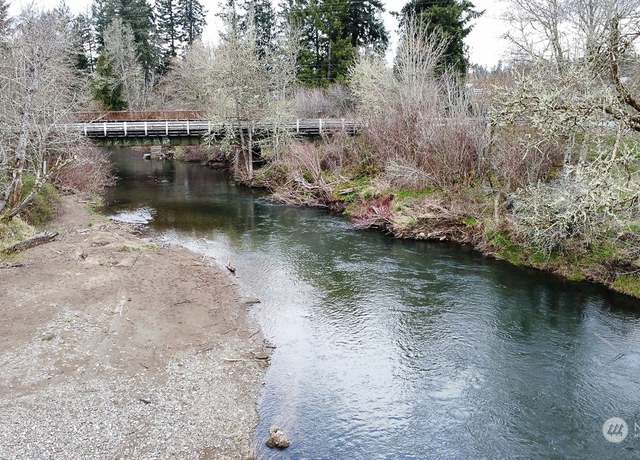
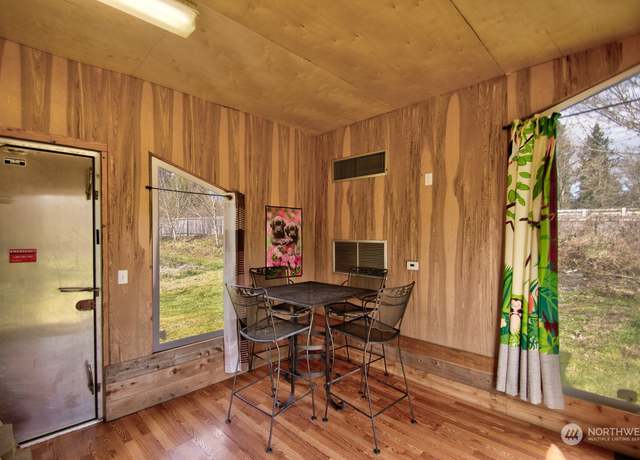
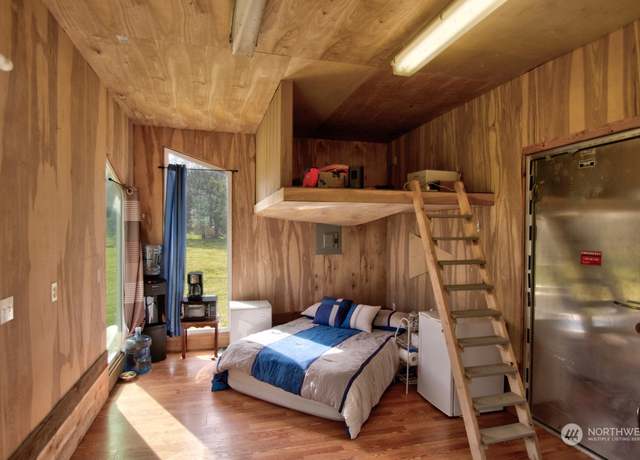
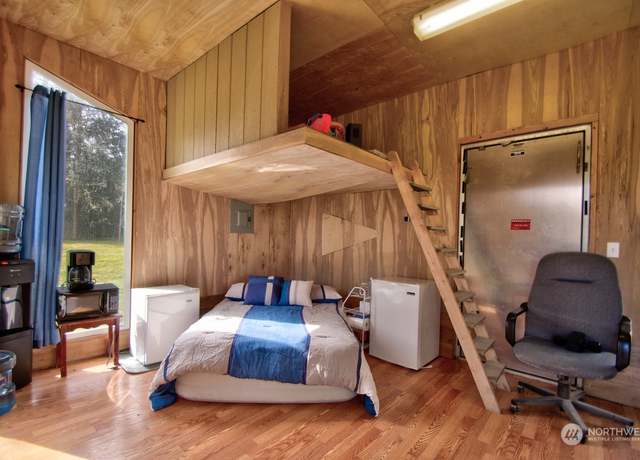
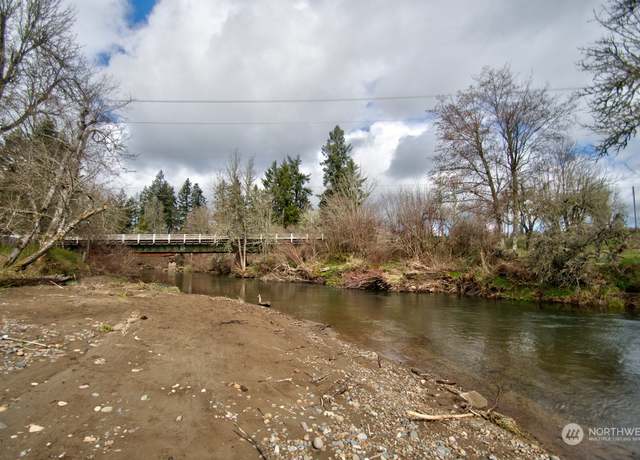
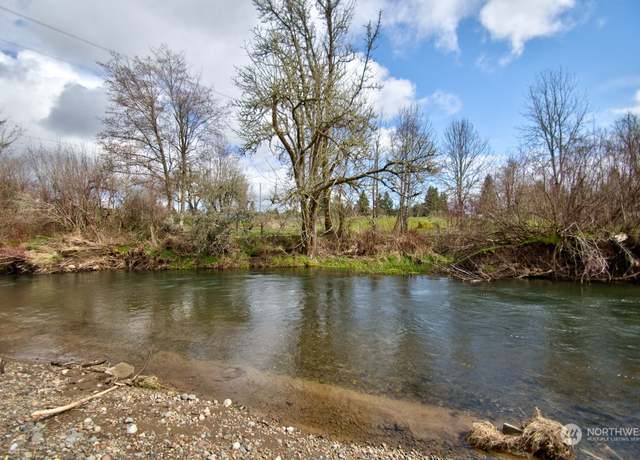
Wonderful, lightly treed +/- 1.242 acre corner lot with 185' of frontage right on the Deschutes River. This lot has a 220 amp panel on site. Relax, fish, and unwind on the gravel beach or float the Deschutes! Lot includes a small cabin with loft, 125 amp panel, and heat pump. It also includes several outbuildings and your own personal port-a-potty! There's also a 12' X 40' cement pad for an RV! Use this strictly for recreation or check with Thurston County planning and permitting to see if it is potentially buildable like other lots down the road. Riverfront has 300' set back for building. Owner Financing Available with minimum $50,000 down payment.
1/31
$124,900
— beds— baths1.24 acres (lot)
14810 Turner Rd SE, Rainier, WA 98576
Listing provided by NWMLS as Distributed by MLS Grid
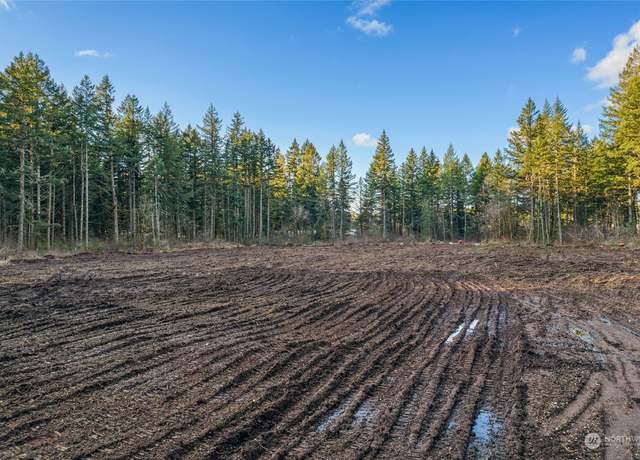
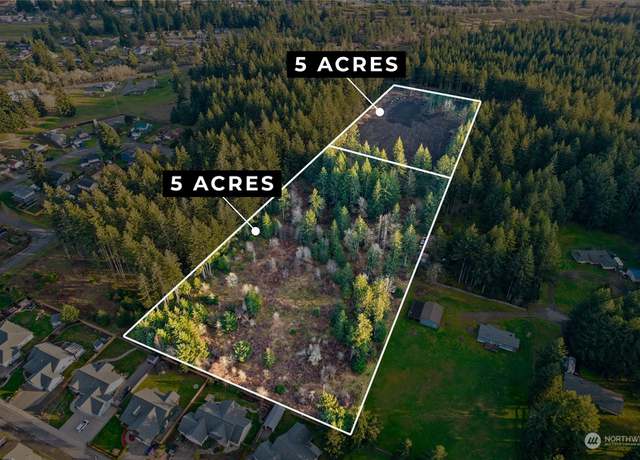
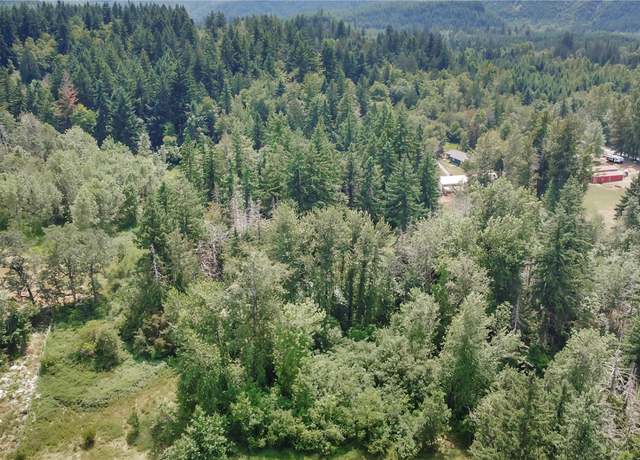
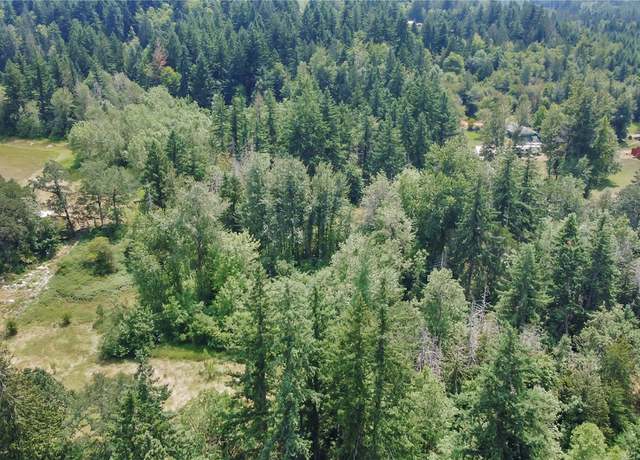
Incredible opportunity! Just shy 10 acres in the process of being subdivided into two 5-acre parcels. Featuring a gated entry, partial clearing, and tons of privacy. Whether you keep it together for a beautiful oasis or wish to capitalize on the development potential this property offers endless possibilities, including timber assets and no CCRs. Perfect for immediate purchase, investment recovery through parcel sales, or creating a multi-generational living situation with homes next to each other. Currently, pending approval for two city of Rainier water hookups: enhancing convenience and value. Enjoy country living while being just minutes from town, schools, shops, and other amenities.
1/13
$349,000
— beds— baths9.87 acres (lot)
13826 Rainier Rd SE, Rainier, WA 98576
Listing provided by NWMLS as Distributed by MLS Grid
Flat buildable lot just outside of the quaint town of Rainier and a short commute to JBLM and surrounding cities. All utilities at street and with no HOA, this is a blank canvas ready for you to make it what you want it to be! Adjacent lot is also for sale giving you the option to double your space! Community river front access, public lakes, and hiking trails nearby, opens up a world of recreational opportunities.
1/5
$75,000
— beds— baths0.33 acre (lot)
16227 Village Dr SE, Rainier, WA 98576
Listing provided by NWMLS as Distributed by MLS Grid
Flat buildable lot just outside of the quaint town of Rainier and a short commute to JBLM and surrounding cities. All utilities at street and with no HOA, this is a blank canvas ready for you to make it what you want it to be! Adjacent lot is also for sale giving you the option to double your space! Community river front access, public lakes, and hiking trails nearby, opens up a world of recreational opportunities.
1/5
$75,000
— beds— baths0.33 acre (lot)
16236 Village Dr SE, Rainier, WA 98576
Listing provided by NWMLS as Distributed by MLS Grid
Peace and seclusion are found on this beautiful 7+ acres with a mix of mature trees and clearings. No restrictions, no HOA, zoned residential, bring your vision, ideas and build a home. Not far from Rainier and Yelm amenities but far enough out to enjoy rural privacy. Reichel Rd is a paved dead end county road, power is in road, well and septic are needed. Easement runs along East 20' of lot 1 for lot 2 utilities, ingress and egress. Adjoining 7 acre timber lot 2 is also for sale. MLS 2139130.
1/8
$170,000
— beds— baths7.08 acres (lot)
0 Reichel Rd SE, Rainier, WA 98576
Listing provided by NWMLS as Distributed by MLS Grid
Marketable timber for investment property or take advantage of the privacy all those trees provide and create/clear a building site for a home. Parcel is located in a beautiful rural area not far from Rainier and Yelm. Access to this parcel is an easement through the lower lot 1 at paved county maintained Reichel Rd. PSE could tell you if closer power can be accessed off 173rd. 173rd is a private gravel road for residents belonging to it's road maintenance agreement. Easily view this parcel by driving up this road, but parcel s not a member of agreement. Well & septic are needed, no studies have been completed. Current net on timber harvest would be approximately $60k. Don't miss the
1/1
$180,000
— beds— baths7.08 acres (lot)
0 Reichel Rd SE, Rainier, WA 98576
Listing provided by NWMLS as Distributed by MLS Grid
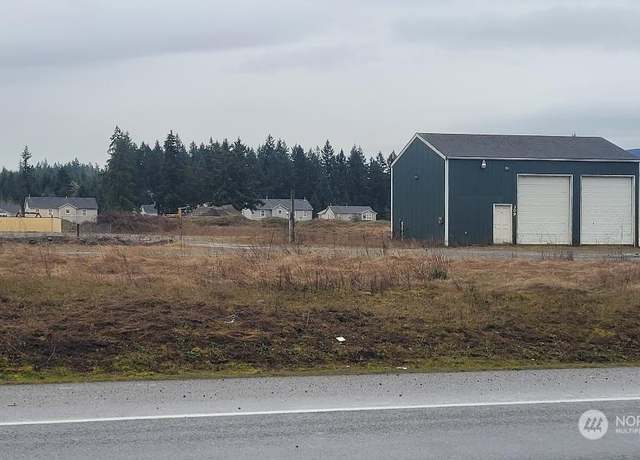
This level, 5+ acre property is a great location for a variety of businesses, with the parcel being zoned (HC), Highway Commercial. Those uses are specified in the Rainier Zoning Code; 18.42.030. It has approximately 562' of highway frontage on SR 507 with an Annual Average Daily Traffic Count of "8,095,000" in 2022. Water is with the City and the property has an on-site septic system that may have to be upgraded depending on your use. Access is from SR 507 & from Myers St. If you're looking for a place for your business with great visibility from high traffic volume, This is It!
1/3
$850,000
— beds— baths5.00 acres (lot)
309 Binghampton St SE, Rainier, WA 98576
Listing provided by NWMLS as Distributed by MLS Grid
Based on information submitted to the MLS GRID as of Fri Apr 19 2024. All data is obtained from various sources and may not have been verified by broker or MLS GRID. Supplied Open House Information is subject to change without notice. All information should be independently reviewed and verified for accuracy. Properties may or may not be listed by the office/agent presenting the information. Some IDX listings have been excluded from this website.
School data is provided by GreatSchools, a nonprofit organization. Redfin recommends buyers and renters use GreatSchools information and ratings as a first step, and conduct their own investigation to determine their desired schools or school districts, including by contacting and visiting the schools themselves.Redfin does not endorse or guarantee this information. School service boundaries are intended to be used as a reference only; they may change and are not guaranteed to be accurate. To verify school enrollment eligibility, contact the school district directly.
Rainier, Washington, offers a serene driving experience with relatively low traffic levels, making it a breeze for car owners. The town does not have a public transportation system, so residents primarily rely on their cars for commuting. For those needing to travel further, Rainier is conveniently located near several major highways, providing easy access to surrounding areas. The town's transportation infrastructure supports smooth and efficient travel, making it an ideal place for car owners.
What types of properties are available in Rainier?
Rainier, Washington offers a variety of single-family home types, including ranch-style homes, split-level homes, and contemporary homes. These homes can be found throughout the Rainier area, providing options for different preferences and needs. Most properties feature three to four bedrooms and were built in various years. To explore different property types for sale in Rainier, Washington, use the 'Home type' filter located above the active listings. Customize your search by selecting options like single-family homes, condos, townhomes, and more.
What is life like in Rainier?
Rainier, Washington offers a serene living experience with its picturesque landscape of lush green forests and rolling hills. The region experiences a mild climate with moderate rainfall throughout the year. The area provides a range of job opportunities across various industries, including agriculture, manufacturing, and healthcare. Residents can engage in a variety of recreational activities such as hiking, fishing, and exploring the numerous parks and trails. The community fosters a strong sense of belonging and camaraderie, with opportunities for social engagement and community involvement.
What are the schools and amenities like in Rainier?
Rainier, Washington provides a variety of public amenities to its residents. This includes a local grocery store for all your daily needs and a restaurant for dining out. For outdoor enthusiasts, there's a park available for leisure and recreation. Other amenities include a post office, library, and a school. Overall, Rainier offers a well-rounded selection of amenities to cater to the needs of its residents.
In the past month, 3 homes have been sold in Rainier. In addition to houses in Rainier, there were also 0 condos, 1 townhouse, and 1 multi-family unit for sale in Rainier last month. Find your dream home in Rainier using the tools above. Use filters to narrow your search by price, square feet, beds, and baths to find homes that fit your criteria. Our top-rated real estate agents in Rainier are local experts and are ready to answer your questions about properties, neighborhoods, schools, and the newest listings for sale in Rainier. Our Rainier real estate stats and trends will give you more information about home buying and selling trends in Rainier. If you're looking to sell your home in the Rainier area, our listing agents can help you get the best price. Redfin is redefining real estate and the home buying process in Rainier with industry-leading technology, full-service agents, and lower fees that provide a better value for Redfin buyers and sellers.


 REDFIN IS COMMITTED TO AND ABIDES BY THE FAIR HOUSING ACT AND EQUAL OPPORTUNITY ACT. READ REDFIN'S FAIR HOUSING POLICY AND THE NEW YORK STATE FAIR HOUSING NOTICE.
 United States
 Canada