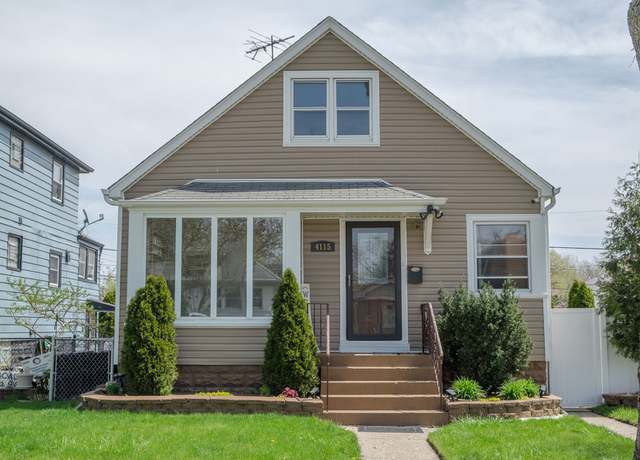
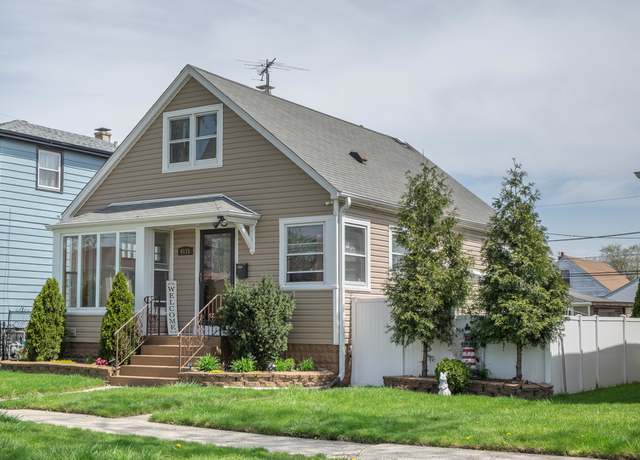
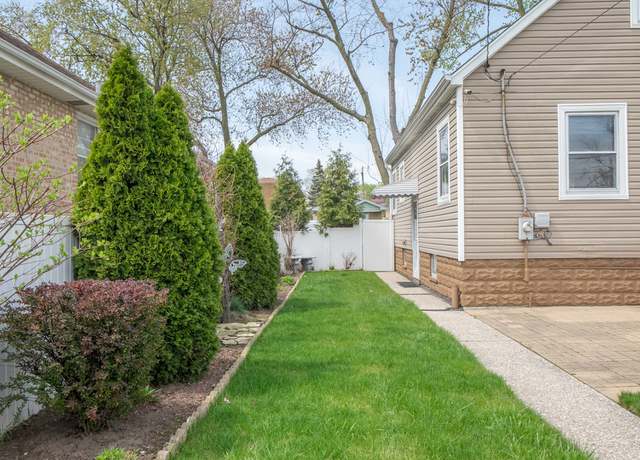
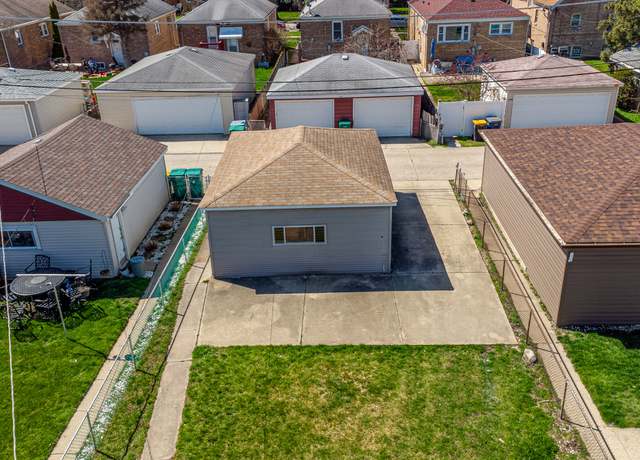
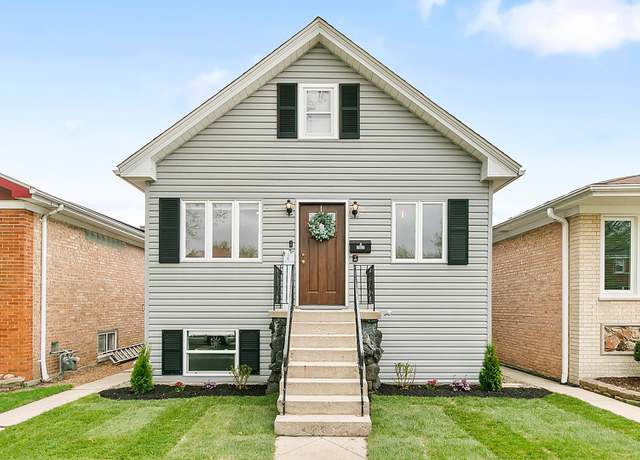
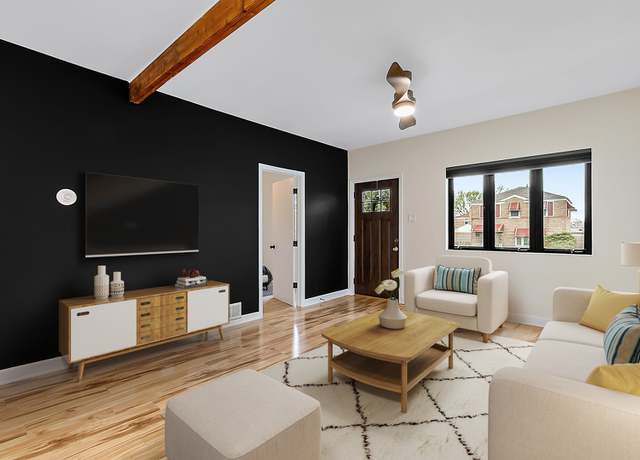
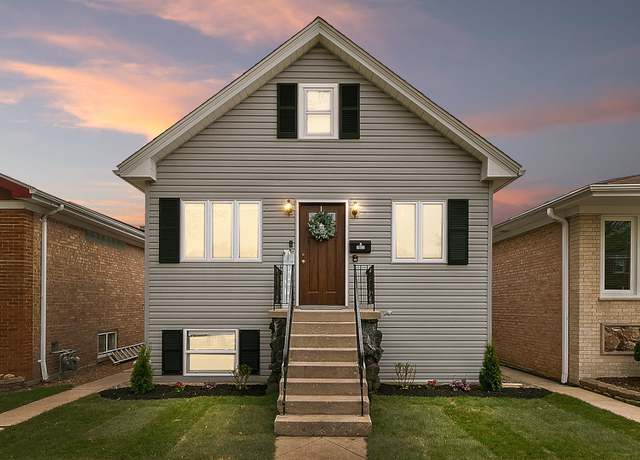
Must see this move-in condition home in excellent Stickney Village location! Main floor has living room, kitchen, full bathroom and 2 bedrooms. Second floor has 2 more bedrooms with closets and tons of storage space. Full basement with rec room, laundry area and half bath. Nice wide lot with car port and PVC fend for privacy. Hardwood floors on main floors just redone! Dishwasher "As Is".
This exquisite 4-bedroom home nestled in Stickney that new home smell, brand new hardwood floors on the first and second levels and striking black marble epoxy flooring in the basement, this residence is perfect for entertaining and to call home. The basement offers a laundry area and expansive entertainment space, complete with a stylish mini bar. Two generously sized bedrooms and a full bath grace the main floor, while the primary bedroom and fourth bedroom, along with another full bath, are located on the upper level. Upgraded mirrors add a touch of luxury to the bathrooms, complementing the brand-new fixtures. The kitchen is a chef's delight, showcasing stainless steel appliances, deep
Welcome to this beautifully renovated bungalow located in the convenient and friendly neighborhood of Stickney. This home boasts exceptional curb appeal and a pristine and welcoming atmosphere as soon as you step inside. The heart of the home is the renovated eat-in kitchen, featuring new stainless-steel appliances, classic subway tile backsplash, recessed LED lighting, and modern floating shelves. This space is perfect for culinary creations and casual meals alike. The home offers two good-sized bedrooms, one of which includes a custom closet organizer and stylish sliding barn doors, adding both functionality and a touch of rustic elegance. You'll find a beautifully updated bathroom on the
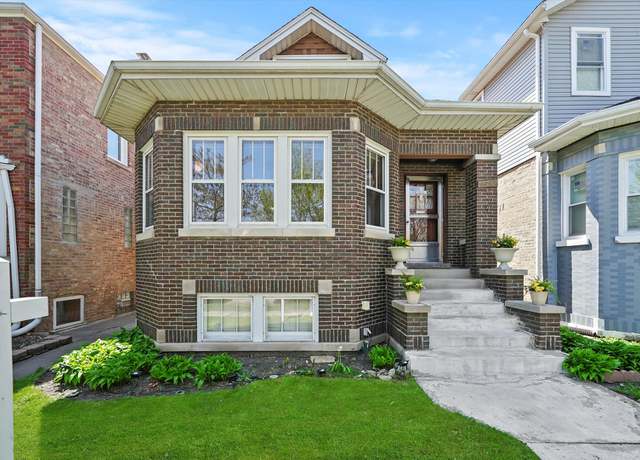
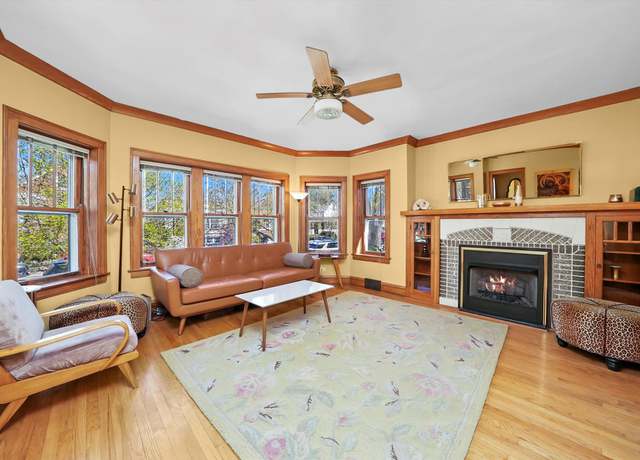
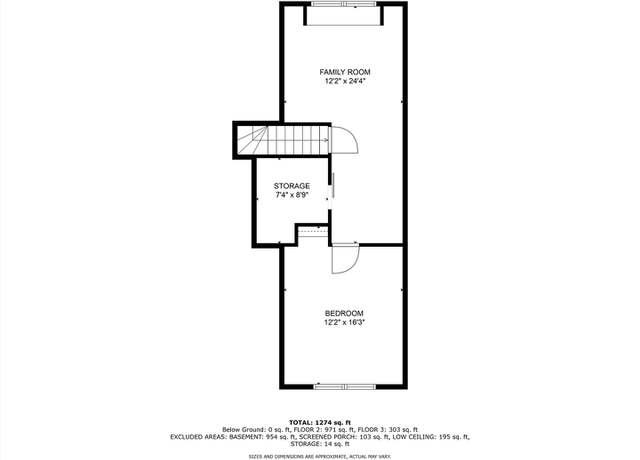
This 3 bedroom, 1 bath Berwyn Bungalow has been meticulously restored back to it's original glory. You will feel the warmth as you walk into the living room with built in fireplace and bookshelves. The hardwood floors throughout most of the home are in excellent condition. It's a Mid-Century modern dream. You'll traverse through the dining room that boasts original trim work. Wait until you see the kitchen with the fabulous 40's refrigerator, and workhorse Roper 6 burner stove & double oven. Full Basement with TONS of room for storage. 2 bedrooms on the main floor and 3rd bedroom and office/sitting room on the 2nd floor. New garage door. Easy access to all that Berwyn has to offer. We
Opportunity knocks and this time, open the door and let it in. This is your chance to own a beautifully maintained and updated home, on a huge lot. It is conveniently located just 2 short blocks to the Metra station and 2 blocks to downtown. A spacious and sunny living room is on one side of the central staircase, with the dining room and kitchen on the other side. There is a main floor family room at the rear of the home, overlooking the gigantic yard with a sunny, custom hardscaped patio AND a 3.5 car, heated garage, with 200 amp service - perfect for an auto enthusiast or anyone with a big hobby, and ready for EV chargers. The kitchen includes a 30" Wolf range and new microwave. A g
Classic Berwyn/Chicago 1920s bungalow with interesting multi color brickwork, and so much attention to classic detail. Large room sizes for easy day to day living, and gracious entertaining possibilities. Fantastic original leaded mirror glass windows, built in ironing board, walk in pantry, basement with outside entrance, gorgeous woodwork, doors and trim, great front porch, and fenced yard with patio/pergola. Great south Berwyn location close to schools, shopping, restaurants, Pershing Road, and transportation options. Perfect basement with gorgeous full bath, laundry, storage, and so many finishing possibilities. Extensive hardwood flooring. This one is charming, special, and ready for y
Make this incredible two-story Victorian beauty, in a prime location, yours! Discover 3433 Oak Park a renovated 3-bed, 1.5-bath home on an oversized lot with potential for an additional bedroom in the unfinished attic. Conveniently located in south Berwyn just steps away from the Metra, making this home a commuters dream. Enjoy modern comforts with central A/C, and a new water heater. Air ducts have been professionaly lined, enjoy clean air with 4 HEPA air filters throughout the home. Park effortlessly in the 2-car garage or on the 3-car pad. Relax on the spacious rear deck and move in with peace of mind. Property has passed Berwyn compliance inspection with no violations. Your dream home a
!!!!!! STICKNEY!!!!! COME CHECK OUT THIS BRICK BUGALOW NEWLY REMODELED. 1ST FL LIVING ROOM, KITCHEN, 2-BEDROOMS WITH A BATHROOM, 2ND FLOOR HAS OWN ENTRANCE WITH ADDITIONAL 2-BEDROOM AND FULL BATH. CENTRAL HEAT AND AC. FULL PARTIAL FINISHED BASEMNET. PROPERTY TAXES REFLECT NON-OWNER OCCUPANT.
This 5 bedrooms, 2 bathroom Mediterranean-style home exudes quality vintage charm throughout. While currently serving as a single residence, it is designed for multi-unit use, complete with kitchens on both levels and the option for private entries for each unit. The entryway, with its double doors leading into the living room, creates a welcoming and grand first impression. The classic woodwork throughout the home is exceptionally beautiful. Ample kitchen space includes an island, eat-in area, and expansive pantries in both kitchens. Upstairs, you'll also find a large storage area and an additional multipurpose room, adding versatility to the living spaces. Prime location situated just a f
Welcome to this unique 2 story 3+BR 2BA Berwyn Home! Recently updated! Home features: brand new finished basement! Large kitchen with stainless steel appliances, granite countertops and sharp breakfast bar! Nice open floor plan with original hardwood floors! New electric, new roof, new windows, new boiler, new gutters, new concrete and new copper plumbing! Bathroom upgraded shower and whirlpool! Basement bathroom started!(can be finished by seller. ) Nice back yard with huge deck and with privacy fence! Insulated garage! Walk to fine dining, bars, and grocery store! A few blocks to the El-Train and I290! 10 min. To Downtown Chicago! Too much to mention! Call for private tour!
Welcome home to this spacious brick corner lot ranch in the south Berwyn area. The main level boasts 3 bedrooms, one full bath, and a spacious living room and dining room. Your new home contains gleaming Hardwood floors throughout the dining room and all three bedrooms. Property also features a modern kitchen with granite counter tops, and newer stainless steel appliances. The first floor bathroom has been remodeled with custom tile, an updated vanity, and a Jacuzzi bath tub. In addition, there is a large den with a beautiful fireplace that is separated from the formal living room. The finished basement has brand new floors installed within the last 12 months, as well as another finished sp
This fully renovated two-story home promises to be a delightful find for your potential buyers. Having undergone a complete gut rehab down to the studs, the property boasts new windows, flooring, and bathrooms, ensuring a fresh and modern living experience. The kitchen has been entirely updated, including brand-new appliances, complemented by new paint throughout the house for a pristine finish. Outside, a new sidewalk adds to the curb appeal. The fully finished basement expands the living space, providing a versatile area that can be tailored to the new owner's needs. Located in a prime area close to schools, shopping centers, dining options, and recreational facilities.
This ideally located and well appointed brick home in central Berwyn is a fabulous option for any buyer, first time or fifth time! It has been well maintained over many years by owners who have recently moved and rented out the house (tenant is flexible on move date). Thus, it is ready for the next chapter. The home sits very comfortably on a nearly double 45x126 lot, which has prepared the property for new innovations and imaginative ideas of all kinds. It is a home that is unique and classic at the same time, and as such, it is well worth seeing. The basement is low, but also open and practical, as it houses the mechanical equipment, including water heater and furnace. The home itself has
Welcome to this remarkable single family home in Berwyn! The main level offers an open concept living room with high ceilings, a dining area, and a modern fully equipped kitchen with stainless steel appliances and ample cabinet space. Additionally, there is a first floor bedroom with a closet and a half bathroom. The second level presents a stunning master bedroom suite with a walk-in closet and a full bathroom featuring double sinks, a soaking tub, and a standing shower. Furthermore, there are two additional bedrooms, one of which includes a game/play room, a modern full bathroom, and a laundry room. The full finished basement is perfect for entertaining, boasting a spacious family room an
BRING THOSE BUYERS OUT THEY WILL NOT BE DISSAPOINTED WITH THIS BEAUTIFUL TWO-LEVEL HOME. THIS PROPERTY WAS A COMPLETE GUT REHAB TO THE STUDS IN 2019. IT OFFER 2400 SQF IN TOTAL LIVING SPACE. THE 1ST FLOOR HAS AN OPEN FLOOR CONCEPT ALL HARDWOOD FLOORS THROUGH OUT A BEAUTIFUL KITCHEN WITH AN L SHAPE COUNTER ALL STAINLESS-STEEL APPLIANCES AND GRANITE COUNTER TOPS AND A HALF BATH AND A MASTER SUITE BEDROOM WITH A FULL BEAUTIFUL CUSTOM BATH IT'S A MUST SEE. .. !!!! THE SECOND FLOOR OFFER 3 GENEROUS SIZE BEDROOMS AND ANOTHER FULL BATH. IT ALSO HAS A PARTIAL BASEMENT WHICH IS PERFECT TO STORE ALL THOSE HOLIDAY DECORATIONS. .. !!!!
Welcome to a charming slice of history in the heart of Berwyn where this inviting three-bedroom, 1 1/2 bathroom home offers both timeless architecture, elegance and modern convenience. Situated in the historic district and just moments away from the Metra, this residence offers the perfect blend of small-town charm and easy access to city amenities. Upon entry, you're greeted by a large foyer adjacent to the living room which is flooded with natural light, creating a welcoming atmosphere for gatherings or quiet evenings at home. The adjoining dining area provides the ideal setting for enjoying home-cooked meals with family and friends. The well-equipped kitchen boasts ample cabinet space, p
Come see this gorgeous all brick octagon front, legal two unit home! It is perfect for the buyer who wants to rent one unit and live in the other. The home has great natural light coming in from the newer windows. The first unit has two large bedrooms. It also has a modern kitchen with stainless steel appliances, recessed lighting and island. Solid well-kept hardwood throughout most of the main level. The basement is partially finished. It has an office, full bathroom, utility room and laundry area. The other half of the basement is open space, with a ton of potential to be framed the way you wish or used for storage. The second unit has two large bedrooms, a full kitchen and living room. I
* * * Located in Berwyn, IL * * * Bungalow-style property boasts two Legal Units. The spacious first floor features three bedrooms, a large kitchen with room for a breakfast table, a separate dining room, and a generous living room with ample recreation space. The first floor is complemented by a finished basement, which includes a sizable storage room, utility room, and a full bathroom. The kitchen on the first floor features updated cabinets with granite countertops. Accessible via a back stairway, the second unit occupies the second floor and constitutes a fully rentable unit with additional bedrooms. The property has been well maintained over the years, featuring three full bathroo
Welcome to this completely remodeled Berwyn 4 bedroom Home! Home features: updated high end kitchen with Quartz countertops, stainless steel appliances, huge island, beautiful laminate upgraded flooring throughout, luxury bathroom w/ glass shower, all brand new windows, new furnace & AC unit, all new plumbing & electric, nice upstairs with 2 more bedrooms, and huge fenced backyard with pool & stamped concrete. Huge TV included! Located on quiet street, min. to El-train, I290, 10 min. To Downtown Chicago! Too much too mention!
Looking for an affordable home, without breaking the bank? 6 room, 3 bedroom and 1 bath home with enclosed front porch. Just 2 blocks from the Oak Park Metra Train Station. Formal dining room and many possibilities to move in and update. Basement is unfinished and includes a walkout. New water supply line installed 2 years ago. 2 1/2 car garage. Owner is an Illinois Licensed Real Estate Brokerage
WELCOME TO THIS REMARKABLE MULTI-UNIT PROPERTY LOCATED IN BERWYN. 1ST UNIT FEATURES LARGE LIVING ROOM, WITH BEAUTIFUL HARDWOOD FLOORS, NEW KITCHEN CABINETS, QUARTZ COUNTERTOPS, NEW APPLIANCES, KITCHEN W/ DINING AREA, AND 3 LARGE BDRMS W/ AMPLE CLOSET SPACE. GARDEN UNIT OFFERS LARGE LIVING ROOM, NEW KITCHEN CABINETS, NEW APPLIANCES, KITCHEN W/ DINING AREA, 2 BEDROOMS, AND SLEEK VYNIL FLOORING. SEPERATE UTILITIES, LARGE YARD W/ DECK PERFECT FOR ENTERTAIMENT, AND A 2.5 CAR GARAGE! CLOSE TO SHOPPING & TRANSPORTATION!
Recently improved and re-leased to quality tenants. BEAUTIFUL 30-UNIT architectural brick apartment building in the Chicago suburb of Berwyn. The building consists of 29 Studios and 1 One-Bedroom units. The studios are VERY large and could easily be converted to all one-bedroom units as a relatively simple value-add play. The property is located only 1.5 blocks from the Berwyn Metra station and is adjacent to a lively retail district. BRAND NEW ROOF installed and the brick has been tuckpointed within the past 5 years. The building heating system has been converted to in unit electric baseboard heating. Owned by IL Licensed RE Broker. With a population of over 56,000, the City of Berwyn lies
Legal 3 Unit Building in a quite neighborhood. Unit 1, Newly Rehabbed includes formal foyer, dining room, living room, 2 bedroom. Unit 2 Top Floor, includes formal foyer, dining room, living room, 3 bedroom. Garden Unit Newly Rehabbed, includes living room & 1 bedroom. Clean enclosed back porches for additional room. 2024 Hot Water Heater, 2019 New roof, Newer Boiler, recent tuck-pointing/concrete, newer windows/door with life time warranty. Well maintained building. Laundry room in the basement with separate storage rooms. Large fenced yard. 2 car garage plus a possible third parking spot. "As Is"
Welcome to this solid brick ranch conveniently located in Berwyn. This two bedroom, two bathroom home has a full basement ready to be finished. Updates include kitchen remodel, updated baths, newer mechanicals, floors, and cabinets. Easy parking with a two car detached garage. Across the street from Lincoln Middle School, close to shopping and interstate. Make 1618 Gunderson your new home!
BIG HOUSE WITH PLENTY OF ROOM FOR A LARGE FAMILY. 3 BIG BEDROOMS DEN FINISHED FULL FINISHED BASEMENT. LAUDRY ROOM AND A 3/4 BATH CONNECTED. LIING ROOM IS LARGE FAMILY ROOM IS LARGE AND DINING ROOM IS LARGE. BRING ALL YOUR BUYERS. KITCHEN IS LARGE AND HAS AN EAT-IN KITCHEN WITH PLENTY OF LIGHT. A VERY SPACIOUSS HOME. LARGE ATTACHED GARAGE WITH A NICE YARD. GAS FORCED AIR AND CENTRAL AIR. WINDOWS ARE CRANK OUT IN THE HUGE LIVING ROOM AND WITH AN L SHAPED VERY LARGE DINING ROOM. FIREPLACE TOO. NATURAL STONE IN THE BASEMENT AND AROUND THE FIREPLACE. A MUST SEE! A REAL CREAMPUFF. YOUR DREAM HOMES AWAITS YOU. ROOMS GALORE! STOP BY YOU WILL REALLY SEE THE POTENTIAL.
* SHORT SALE * Welcome to this charming brick Georgian home nestled in the heart of Berwyn, IL. Step inside to discover the timeless appeal of hardwood floors gracing the kitchen and dining room, creating an inviting ambiance throughout. The kitchen has been thoughtfully updated with sleek quartz countertops and modern stainless-steel appliances. Entertain with ease as the dining room seamlessly opens up to a super spacious backyard, boasting a new deck and fresh fencing all around, perfect for enjoying outdoor gatherings and leisurely evenings under the stars. Venture to the second level where two generously sized bedrooms await, and a full bathroom. The basement presents a blank canvas,
Clean and well maintained bungalow on a quiet street in South Berwyn. Main level features front living room, spacious eat-in kitchen, 2 bedrooms and one full bath - remodeled in 2022. The 2nd floor has a flexible floor plan with a full bath, which could be used as 3 bedrooms with family room OR as a large master suite with an office and walk-in closet. Finished basement recreation room and laundry room, plus extra storage space. GFA furnace and currently 2 window AC units but central AC could be added without issue. Sump pump and a dry basement! Deep yard with side drive and 2-car detached garage. Exterior has just been painted! Located just a half block from Janura Park, Berwyn Rec center
Extra-wide lot in a quiet neighborhood on the north side of Berwyn, improved with a charming frame bungalow. This 3-bedroom home was partially renovated in 2013. Among the renovation projects were a new eat-in kitchen with an island, 42" kitchen cabinetry, granite countertops and a Subzero refrigerator. Also new in 2013: electric panel, new central A/C, new GFA furnace, new main floor bath, and new roofs on both the house and the garage. A brand new window was installed in a second-floor bedroom in February 2024. Plenty of sunlight flows through this lovely home, due to its east-west exposure. The bedroom on the main floor can easily serve as an office for those who happen to work from
BEAUTIFUL OVERSIZED BRICK BUNGALOW WITH MANY NEW UPDATES. THIS HOME FEATURES LIVING ROOM W/ BEAUTIFUL ORIGINAL DESIGNED WINDOWS, LARGE DINING ROOM, 2BEDROOMS, FULL BATH AND HARDWOOD FLOORS THROUGHOUT, DORMER WITH FULL BATH AND BEDROOM, LARGE EAT IN KITCHEN, FULL FINISHED BASEMENT WITH SEPARATE LAUNDRY ROOM, FAMILY ROOM, 1/2 BATH AND NEW OVERSIZED BAR! SOLD AS IS
New opportunity emerges and a rare second chance! Their lost is your gain, come and look at this well maintained solid brick Bungalow in desirable South Berwyn! Excellent home for the large family and/or In-Law arrangement. Large kitchen, 2 bedrooms on the main floor, 2 in the lower level, and unfinished attic waiting for your ideas! Recent updates: Roof (Home & Garage) 2019, Water Heater & Sump Pump 2021, Waterproofing and basement bathroom (except sink) 2022 and main floor bathroom 2023. SOLD AS-IS.
Hot Stickney Special! Although the home is being sold as/is, this 4br 2ba home has many recent updates, including newer roof, windows, siding, kitchen and bathrooms. The house sits on JUMBO 50' lot and features a large rear deck and spacious backyard. The 1st floor features 3 bedrooms, large kitchen with an island and breakfast bar, dining room opens to the deck, large living room, hardwood floors. Basement was previously finished with an additional bedroom and bathroom. There is also a garage and parking pad off the alley. Sold as/is, no survey. Room count and sizes are estimated and should be verified. Buyer responsible for any city requirements or violations, IF ANY. Please see agent rem
Legal non-conforming 2 flat Originally built as a 6 bedroom family home that was converted to 2 legal units in 1923. The property has always been family owned. This is a Historic property on one of the largest lots in Berwyn. The Arthur J. Dunham Centennial Home is listed on The National Register of Historic Places. Recent updates include roof, copper gutters, furnace, and water heater, at the time of the conversion in 1923 the original architect Tallmadge and Watson designed an addition of a main floor primary bedroom along with enclosed 2nd floor porch into an office/den/study area. The architect said at that time that the property could be de-converted to one big single family home curre
Sitting on one of the largest lots in Berwyn 103X140, The Arthur J Dunham Centennial Home is listed on the National Register of Historic Places as well as the Berwyn Historical Society Registry. Built in 1907 the Prairie School Style, has been owned and lived in by the same family for over 117 years. Recent updates include roof, furnace, hot water heater. The exterior has been recently renovated maintaining the original appearance. Additionally the upstairs kitchen an both upstairs baths have been modernized. The floor plan of the Dunham house is a modified "L" shape centered around a large entrance hall which provides access to the ground floor rooms. The interior detailing is
This 2 Bed, 1 Bath Property is conveniently just steps away from Havlicek Elementary school, and just a couple blocks away from the restaurants and shopping on Roosevelt Road. This Property is being Sold AS IS. Buyer is responsible for Berwyn Compliance and Escrow Requirements.
Welcome to your new home! This exquisite 4-bedroom, 3.5-bathroom residence is an entertainer's dream, complete with a finished basement boasting a full bathroom and ample space for fun-filled gatherings. Inside, enjoy a gourmet kitchen, spacious living areas, and a serene master suite. Outside, the peaceful neighborhood offers tranquility and convenience. Don't miss out on this perfect blend of luxury and comfort. Schedule your viewing today!
Seize the opportunity to own a 2-flat property in Berwyn! Perfectly situated within walking distance of Elementary and Middle High Schools, and mere blocks from public transportation, dining, entertainment, Oak Park, and expressways, this is a truly remarkable prospect. Each unit is self-sufficient, covering its own gas, heat, and electricity expenses, providing tenants with autonomy and flexibility. Look beyond the surface-this property harbors significant untapped potential and opportunity! Additionally, the rents are currently below market due to the presence of long-term, reliable tenants.
Welcome to this stunning mid-century Split-level Ranch in the heart of North Berwyn. With only two owners, the charm and character of this unique home has been preserved. With its remarkable original features and thoughtful layout, this residence offers comfort, style and room to spread out. You'll be drawn to the inviting ambiance of the large living room, complete with a wood-burning fireplace and full brick focal wall. The oven, stove top & vent, cabinets, and counters add a touch of nostalgia in the kitchen and the spacious heated/cooled breezeway is equipped with an original built-in grill. Convenience is key with a main-floor powder room featuring double sinks. On the second lev
Come see this beautifully remodeled CONDOMINIUM in a Beautiful Berwyn neighborhood!!! We offer a Stunning eat in Kitchen loaded with tall cabinets, granite counter top space and stainless steel appliances. You will love the large living room that is filled with great natural sunlight. The bedroom is spacious and VERY comfortable. The bathroom is big and provides a spa like feel!! You will enjoy the hardwood floors throughout, closets and spacious storage unit!!! Close to schools, parks, stores and transportation!!! SCHEDULE YOUR SHOWING TODAY!!!
Based on information submitted to the MLS GRID as of Thu Apr 25 2024. All data is obtained from various sources and may not have been verified by broker or MLS GRID. Supplied Open House Information is subject to change without notice. All information should be independently reviewed and verified for accuracy. Properties may or may not be listed by the office/agent presenting the information.
School data is provided by GreatSchools, a nonprofit organization. Redfin recommends buyers and renters use GreatSchools information and ratings as a first step, and conduct their own investigation to determine their desired schools or school districts, including by contacting and visiting the schools themselves.Redfin does not endorse or guarantee this information. School service boundaries are intended to be used as a reference only; they may change and are not guaranteed to be accurate. To verify school enrollment eligibility, contact the school district directly.
Homes for sale in Berwyn have a median listing price of $347K. Some of these homes are Hot Homes, meaning they're likely to sell quickly.
What are some of the most popular neighborhoods in Berwyn?
Popular neighborhoods include South Berwyn, Clyde, North Berwyn, West Side, and Portofino Shores.
How often does Redfin update their new listings?
Most of our new listings in Berwyn are updated every 5 minutes so you can see new homes as soon as they come on the market. Learn more
What is transportation like in Berwyn?
Berwyn, Illinois boasts a well-connected transportation network, making commuting and travel convenient for its residents. Traffic levels in Berwyn can be moderate to heavy, particularly during peak hours, so driving a car may require some patience. The city is served by an efficient public transportation system, including buses and trains, providing an alternative to car travel. Additionally, Berwyn's strategic location offers easy access to several major highways and freeways, facilitating quick connections to surrounding areas. Learn more on our Berwyn city guide.
What types of properties are available in Berwyn?
Berwyn, Illinois offers a variety of single-family home types, including ranch-style, split-level, and bungalow-style homes. These homes can be found throughout the city, with ranch-style homes primarily located in the western part of Berwyn, split-level homes scattered throughout the city, and bungalow-style homes concentrated in the eastern neighborhoods. Most properties feature 2-4 bedrooms and were built between the 1920s and 1950s. To explore different property types for sale in Berwyn, Illinois, use the 'Home type' filter located above the active listings. Customize your search by selecting options like single-family homes, condos, townhomes, and more.
What is life like in Berwyn?
Living in Berwyn, Illinois offers a unique blend of urban and suburban living. The landscape is characterized by a mix of residential neighborhoods and commercial areas, providing easy access to amenities and services. The weather in Berwyn varies, with hot summers and cold winters, allowing residents to experience all four seasons. Job opportunities in Berwyn are diverse, with a range of industries present, including healthcare, education, and manufacturing. There are plenty of things to do in Berwyn, from exploring local parks and trails to enjoying the vibrant dining and entertainment scene.
What are the schools and amenities like in Berwyn?
Berwyn, Illinois is home to a variety of public amenities that enhance the quality of life for its residents. The city boasts numerous restaurants offering a wide range of culinary delights. For outdoor enthusiasts, there are several parks within the city limits providing open spaces for relaxation and recreation. Grocery stores are also readily available, making shopping for daily essentials convenient. Additionally, Berwyn offers other amenities such as libraries, fitness centers, and public transportation options.
In the past month, 24 homes have been sold in Berwyn. In addition to houses in Berwyn, there were also 9 condos, 1 townhouse, and 26 multi-family units for sale in Berwyn last month. Berwyn is a fairly walkable city in Cook County with a Walk Score of 75. Berwyn is home to approximately 55,865 people and 10,796 jobs. Find your dream home in Berwyn using the tools above. Use filters to narrow your search by price, square feet, beds, and baths to find homes that fit your criteria. Our top-rated real estate agents in Berwyn are local experts and are ready to answer your questions about properties, neighborhoods, schools, and the newest listings for sale in Berwyn. Our Berwyn real estate stats and trends will give you more information about home buying and selling trends in Berwyn. If you're looking to sell your home in the Berwyn area, our listing agents can help you get the best price. Redfin is redefining real estate and the home buying process in Berwyn with industry-leading technology, full-service agents, and lower fees that provide a better value for Redfin buyers and sellers.

 REDFIN IS COMMITTED TO AND ABIDES BY THE FAIR HOUSING ACT AND EQUAL OPPORTUNITY ACT. READ REDFIN'S FAIR HOUSING POLICY AND THE NEW YORK STATE FAIR HOUSING NOTICE.
 United States
 Canada