


- Median Sale Price
- # of Homes Sold
- Median Days on Market
Median Sale Price (All Home Types)
$575,000
+23.9% YoY | Mar 2024
- 1 year
- 3 year
- 5 year
Loading...
Loading...
Loading...

Based on information submitted to the MLS GRID as of Thu Apr 18 2024. All data is obtained from various sources and may not have been verified by broker or MLS GRID. Supplied Open House Information is subject to change without notice. All information should be independently reviewed and verified for accuracy. Properties may or may not be listed by the office/agent presenting the information.
Public, K-5
Public, K-5
Public, K-5
Public, K-5
Public, K-5
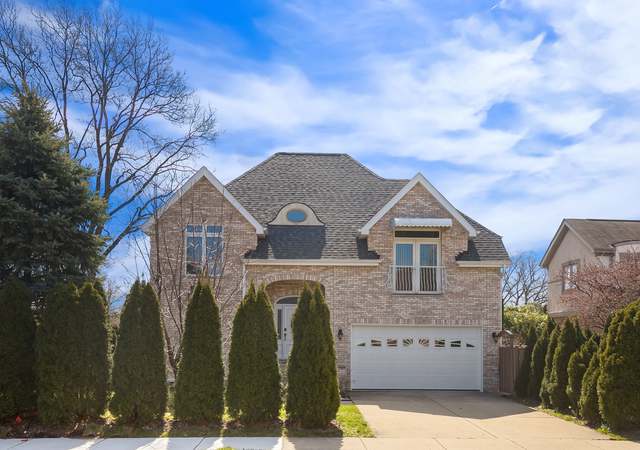
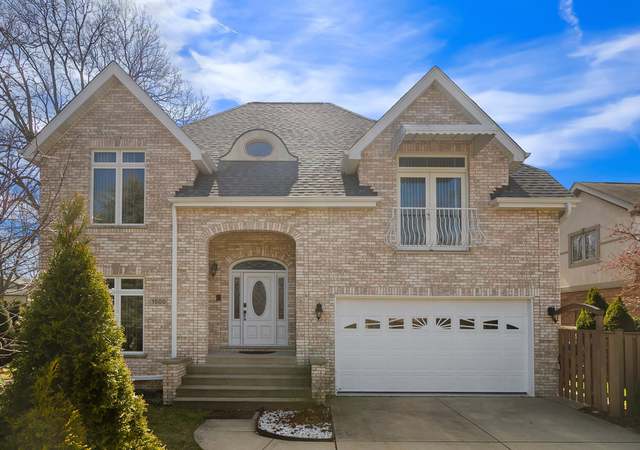
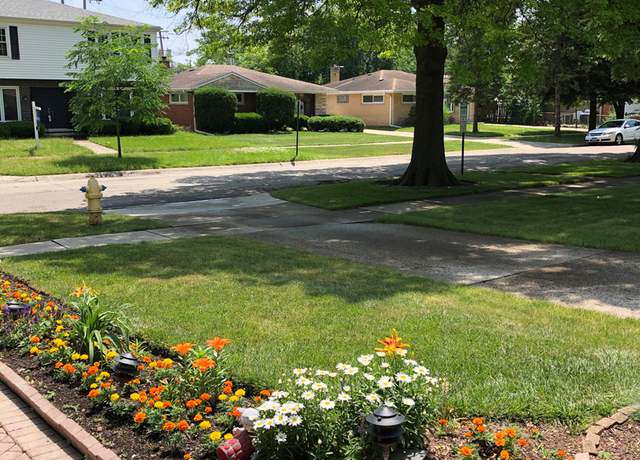
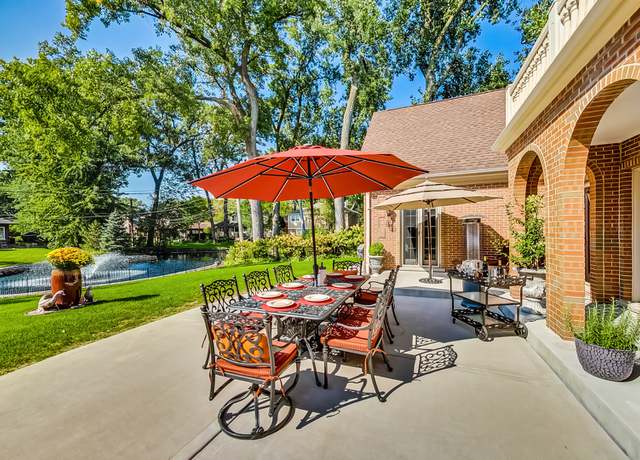
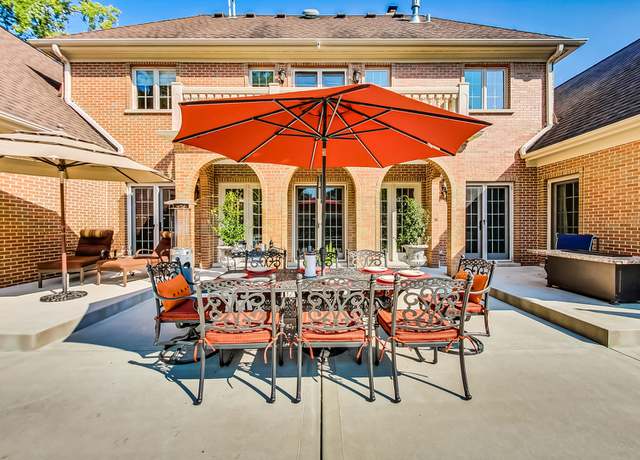
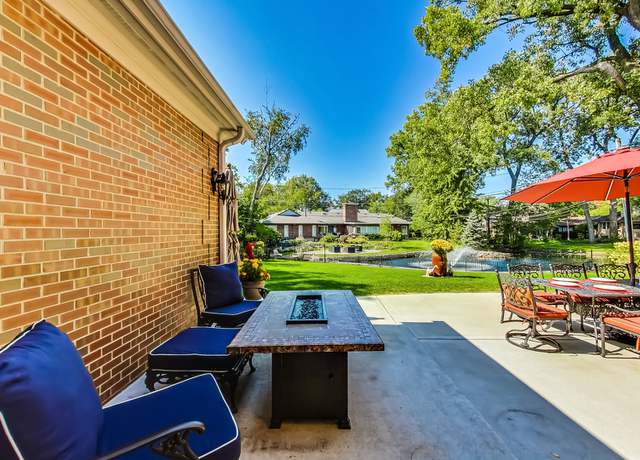
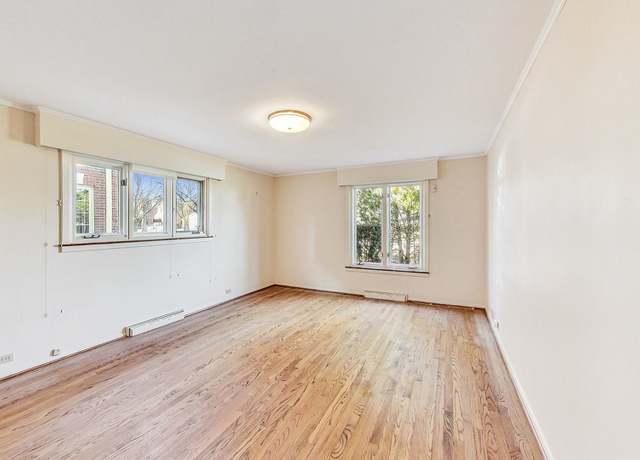
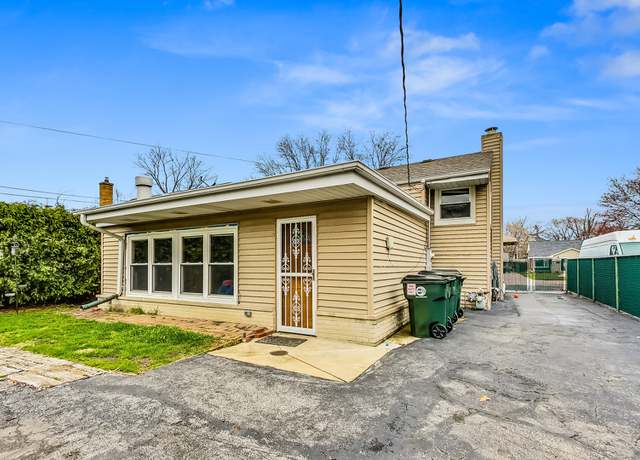
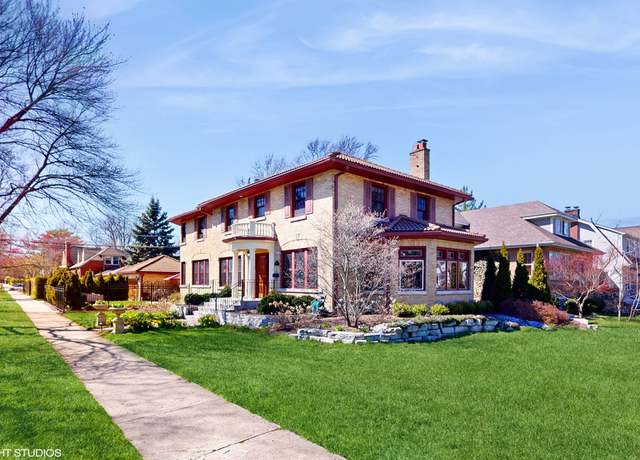
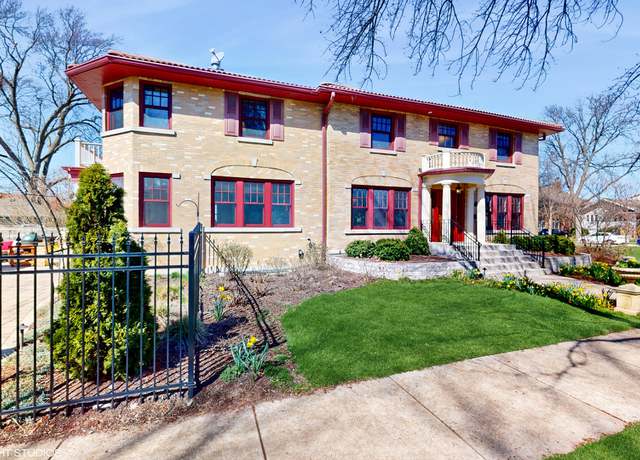
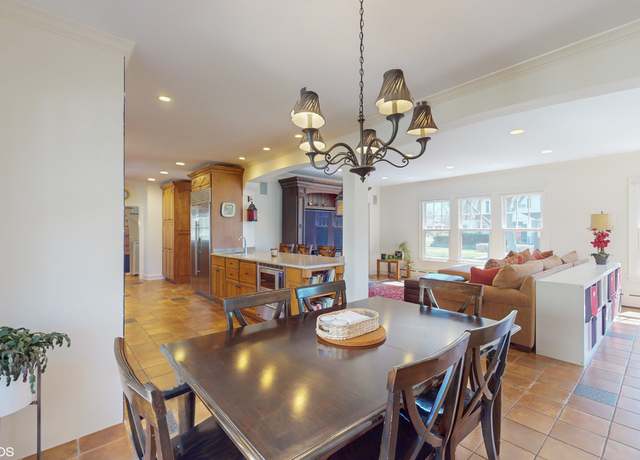
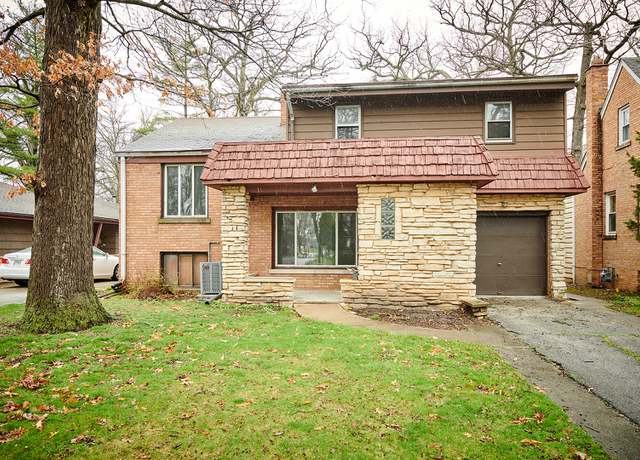
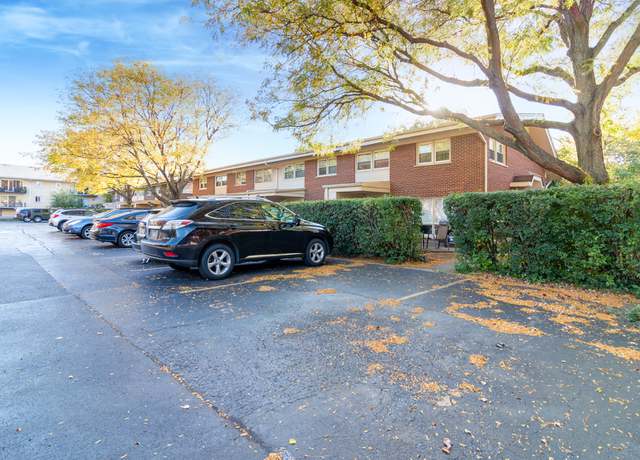
In the past month, 43 homes have been sold in Park Ridge. In addition to houses in Park Ridge, there were also 23 condos, 9 townhouses, and 4 multi-family units for sale in Park Ridge last month. Park Ridge is a moderately walkable city in Cook County with a Walk Score of 54. Park Ridge is home to approximately 37,642 people and 19,644 jobs. Find your dream home in Park Ridge using the tools above. Use filters to narrow your search by price, square feet, beds, and baths to find homes that fit your criteria. Our top-rated real estate agents in Park Ridge are local experts and are ready to answer your questions about properties, neighborhoods, schools, and the newest listings for sale in Park Ridge. Our Park Ridge real estate stats and trends will give you more information about home buying and selling trends in Park Ridge. If you're looking to sell your home in the Park Ridge area, our listing agents can help you get the best price. Redfin is redefining real estate and the home buying process in Park Ridge with industry-leading technology, full-service agents, and lower fees that provide a better value for Redfin buyers and sellers.
About us
Find us
Subsidiaries
Copyright: © 2024 Redfin. All rights reserved.
Updated January 2023: By searching, you agree to the Terms of Use, and Privacy Policy.
Do not sell or share my personal information.
REDFIN and all REDFIN variants, TITLE FORWARD, WALK SCORE, and the R logos, are trademarks of Redfin Corporation, registered or pending in the USPTO.
California DRE #01521930
Redfin is licensed to do business in New York as Redfin Real Estate. NY Standard Operating Procedures
New Mexico Real Estate Licenses
TREC: Info About Brokerage Services, Consumer Protection Notice
If you are using a screen reader, or having trouble reading this website, please call Redfin Customer Support for help at 1-844-759-7732.
 REDFIN IS COMMITTED TO AND ABIDES BY THE FAIR HOUSING ACT AND EQUAL OPPORTUNITY ACT. READ REDFIN'S FAIR HOUSING POLICY AND THE NEW YORK STATE FAIR HOUSING NOTICE.
 United States
 Canada