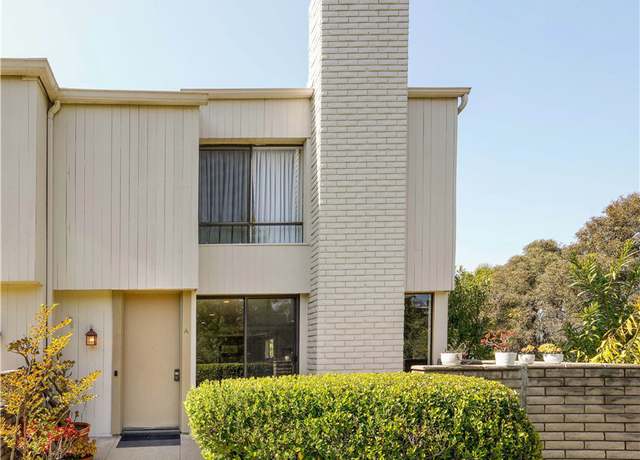
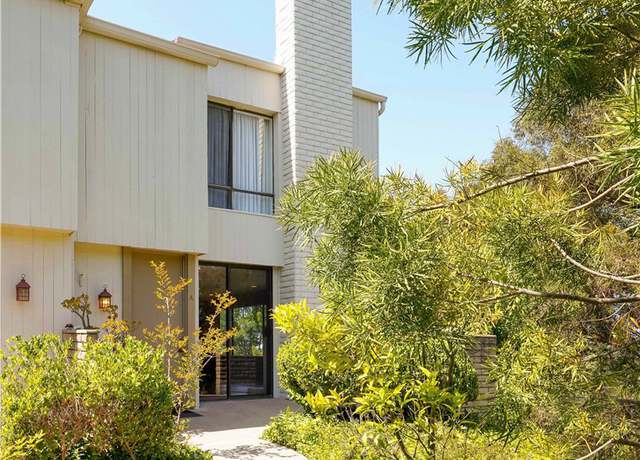
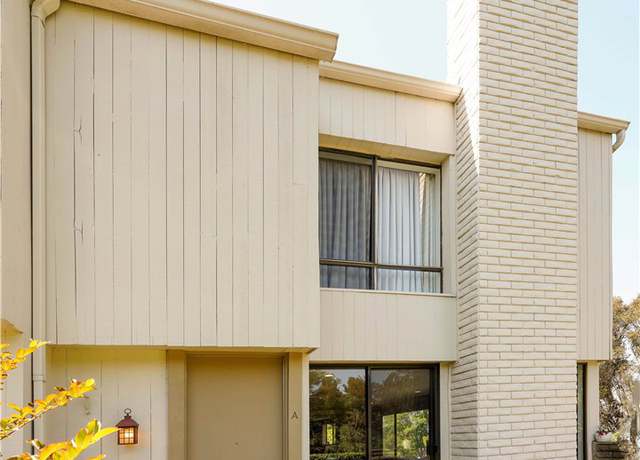
Nestled among majestic Pine Trees in the serene and idyllic “The Estates” Community, Welcome to this spacious 3 Bedroom and 3 Bath end-unit townhome. Come feel the cool breezes and allow the pastoral environment to ease your burdens. Amidst lush greenery, this bright and airy townhome is perfect for raising a family as well as hosting large social gatherings. Even the pickiest buyer will appreciate the expansive Master Bedroom Suite and the spacious bedrooms on the upper level as well as the open concept main level, with cozy kitchen, living and dining rooms. There is even a bonus room on the main level which could be used as an office, den or even FOURTH bedroom!! This townhom
1/49
$1,049,000
3 beds2.5 baths1,748 sq ft4.57 acres (lot)
3608 W Estates Ln Unit A, Rolling Hills Estates, CA 90274
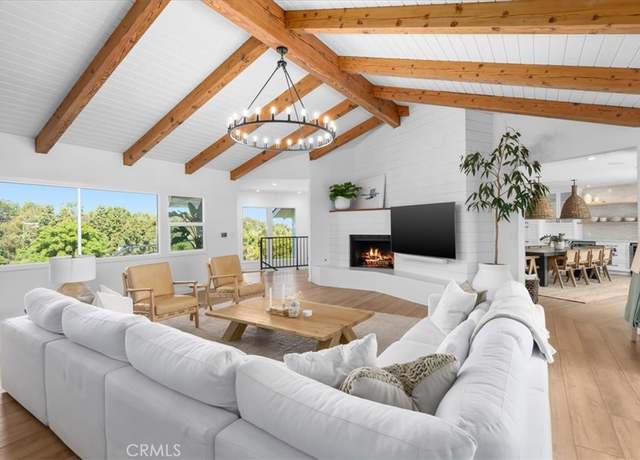
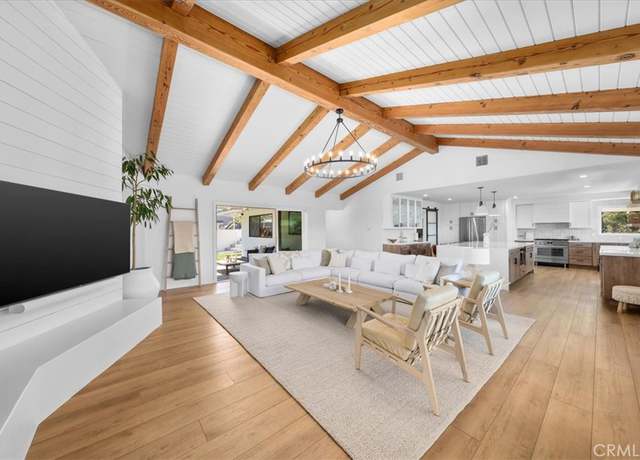
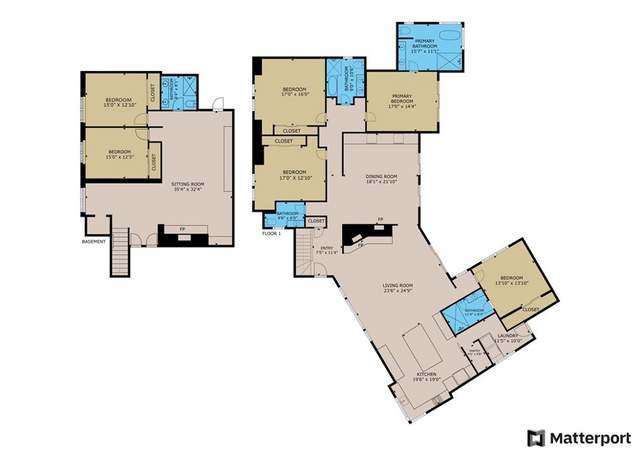
Tucked at the end of a cul-de-sac street in this highly desirable area of Rolling Hills Estates, 11 Shadow Lane has it all: privacy, a sizeable easy-living floor plan, beautifully landscaped yard with pool & sauna, city & mountains views, and proximity to all the Peninsula has to offer with easy access off the hill into the adjacent South Bay communities. If those reasons weren’t enough, the prestigious Palos Verdes School District offers strong public and private educational opportunities within a 5-minute drive. Extensively remodeled in 2021, owners have continued to refine the beauty and functionality of this home. The lush landscaping showcases a grassy yard with King
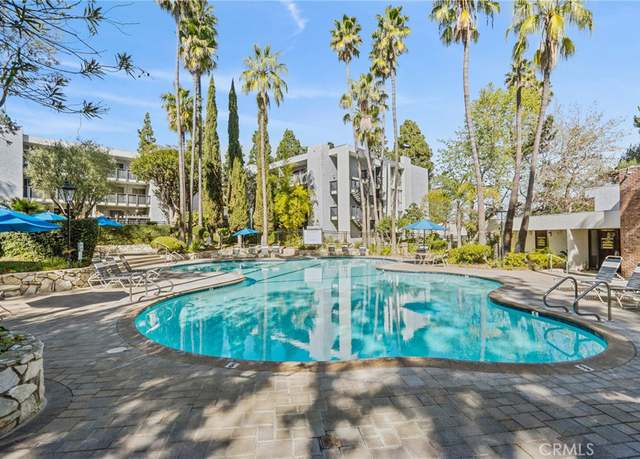
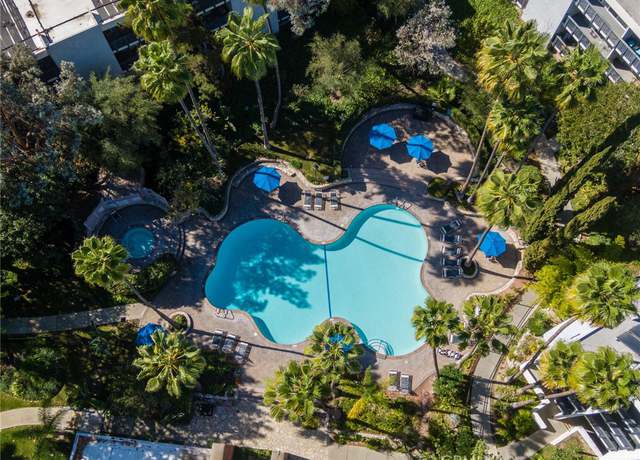
The Estates Community feels and lives like a vacation resort with all its amenities. This is a rare corner ground floor unit with 2 bedroom's and 2 bath's separated by the living room and kitchen area's offering privacy, which opens to a large outdoor patio for summer's barbecue's and entertaining. Features stone counters, new carpet and tiled bathrooms, recessed lighting, walk-in closets. Amenities; 2 Tennis Courts, pool, spa, brand new sauna, gym, large recreational building with a remodeled kitchen, fireplace, pool tables, ping pong, shower and dressing area. Surrounded by relaxing sounds of streams and water falls throughout the mature forested landscaping. The Estates Condominium's is
1/53
$630,000
2 beds2 baths951 sq ft
3602 W Estates Ln #116, Rolling Hills Estates, CA 90274
Welcome to 26361 Dunwood Road, found in the highly sought-after Rollingwood neighborhood! Step inside and be greeted by the inviting entry way and open floorplan, adorned with recessed lighting and vaulted ceilings that create a spacious and airy ambiance. Hardwood floors in the main living areas and gas fireplace add warmth and charm, while French doors invite abundant natural light and lead to the outdoor wood deck, perfect for al fresco dining and entertaining. The tastefully remodeled kitchen boasts granite countertops, double ovens, a kitchen island with cooktop, custom cabinetry and large pantry. The primary bedroom comes equipped with a gorgeous bay window and upgraded bathroom with
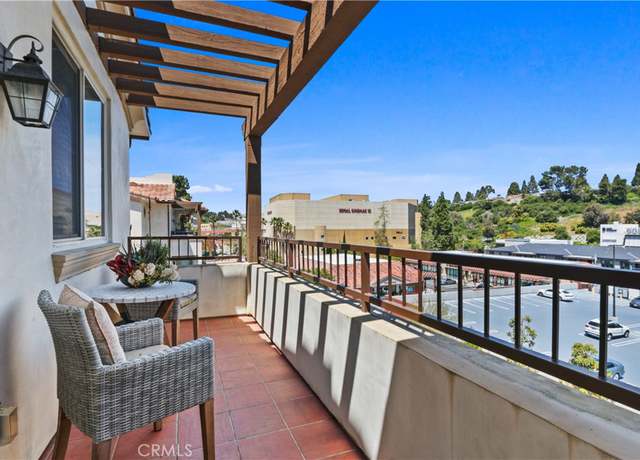
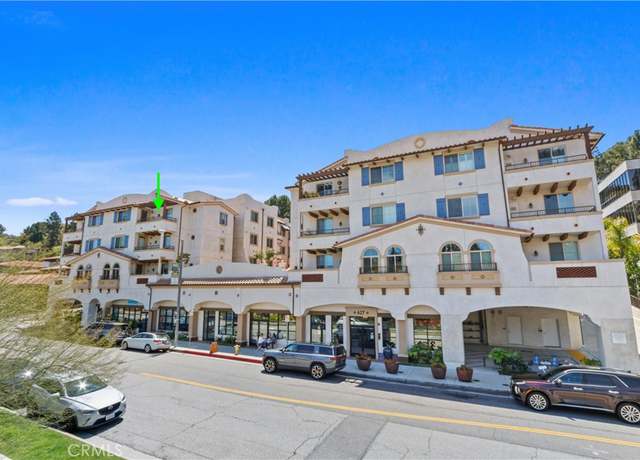
Welcome home to the best unit in the building in highly sought after La Collina! This gorgeous one bedroom one bath condo on the top floor shows brand new with it's clean and bright interior, and chef-ready kitchen with stainless steel appliances. Bask in the advantages of being in the most desirable location; larger sqft, only one shared wall, high ceilings and no one above you, uninhibited natural sunlight, and the elevator services your floor only and is shared with just one neighbor next door. The spacious open floor plan allows for comfort and style, and the large balcony is ready for a glass of wine to enjoy those South Bay sunsets. Other features include stackable washer and dryer in
1/20
$789,888
1 bed1 bath920 sq ft
627 Deep Valley Dr Unit P501, Palos Verdes Peninsula, CA 90274
Welcome to 5353 Middlecrest Road in the exclusive Ridgecrest area of Rancho Palos Verdes! This fabulous 5-bedroom, 4-bathroom estate is not to be missed! Perfectly located on a private cul-de-sac, this spacious home features a bright and open floor plan with PANORAMIC CITY AND MOUNTAIN VIEWS from the living areas and bedrooms. The flexible layout has 4 large bedrooms situated on one side of the house with a private suite located on the opposite end. 2 separate (brick and PV stone) fireplaces are brilliantly positioned in both dining and living areas creating a pleasant and warm atmosphere. The family room opens to a lush and expansive back yard, perfect for enjoyment and entertaining! Thi
$2,199,999
5 beds4 baths2,762 sq ft0.50 acre (lot)
5353 Middlecrest Rd, Rancho Palos Verdes, CA 90275
Discover luxurious living in the heart of the renowned Palos Verdes Peninsula with this tastefully updated corner-unit condo surrounded by lush landscaping and a tranquil community. Bathed in natural light, this spacious upstairs residence spans 1,071 sq. ft. , offering 2-beds, 2-baths, a seamless flow of elegant living spaces, and a balcony - all with expansive views of nature and vibrant foliage. When you step inside you will find a welcoming ambiance enhanced by upgrades, like laminate hardwood floors and neutral-tone paint throughout. The open-floor concept effortlessly connects the living room, kitchen, dining area, and balcony creating an ideal environment for both relaxation and ente
$690,000
2 beds2 baths1,071 sq ft
5927 Armaga Spring Rd Unit H, Rancho Palos Verdes, CA 90275
Welcome to your own slice of paradise perched atop the mesmerizing hills of Los Angeles! Behold this stunning Mid-century modern style residence boasting an incredible panoramic city light view from Malibu to LA Harbor that will leave you breathless. Step inside and prepare to be captivated by the seamless integration of indoor-outdoor living, where every corner of this home is designed to maximize the awe-inspiring vistas of downtown Los Angeles, mountains, and LA harbor. The heart of this 5 bedroom/3 bath home is a recently upgraded open kitchen featuring a sleek bar-top island, quartz countertops, skylight, walk-in pantry, stainless steel appliances and maple-lined cabinetry. With high v
Located at the top of the hill in Rancho Palos Verdes overlooking the magnificent Pacific ocean, come in and enjoy your new home, unit #301 at 28121 Highridge Road. Start by stepping through the front door into your amazing hallway entry with beautiful hardwood floors. After kicking off your shoes and setting down your keys, stroll into a large open concept space flooded with natural light and fling open your multiple sliding doors to savor the refreshing ocean breeze. The expanded kitchen boasts a sizable island and is attached to the large dining room and an impressive bar area that will easily accommodate all your guests and have you itching to entertain. Mornings couldn't be more relaxi
$889,000
2 beds2 baths1,338 sq ft
28121 Highridge Rd #301, Rancho Palos Verdes, CA 90275
Discover the pinnacle of luxury living in Rolling Hills Estates within the gated enclave of The Ranch. This exceptional single-level residence offers 4 bedrooms, 5 bathrooms with over 4,200 sq ft of living space on a 18,400 sq ft elevated corner lot. The home also includes a gym, office, pool, spa and a spacious backyard with serene ocean and Catalina views. Step inside to experience the spacious open-concept layout, boasting vaulted open-beam ceilings, skylights, and an abundance of windows, French doors and bifold doors that infuse the home with natural light. Entertain effortlessly in the newly reimagined great room featuring a large bay window, wet bar, and fireplace that seamlessly con
$4,500,000
4 beds4.5 baths4,234 sq ft0.42 acre (lot)
21 Misty Acres Rd, Rolling Hills Estates, CA 90274
Great location at top of hill with extra large deck on a large lot located in desirable Skyline Mobile Home Park. This spacious well maintained two bedroom home has laminate flooring throughout. Central heating and air. When entering the home the first thing you notice is the large open space floor plan with open kitchen. Country kitchen and bathroom have been upgraded. Large master bath. Included are refrigerator, range and shed. Skyline is a 55+ community offering many amenities such as pool, hot tub, billiard room with two pool tables, recreation room and lots of activities. Covered carport with room for two cars. Located across the street from Rolling Hills Shopping Center, close to res
$249,000
2 beds1.5 baths1,440 sq ft
2550 Pacific Coast Highway #243, Torrance, CA 90505
Dream Home with Ocean Views in Cresta Palos Verdes! If you are looking for a three bedroom townhome that feels more like a single-family home in the Palos Verdes area - this is an exceptional opportunity! Once you walk through the door, you are welcomed with a relaxing energy, perhaps it’s the storybook stone fireplace or the soft natural light pouring through picture windows or maybe the large patio! The kitchen sparkles with stainless steep appliances, a 26-bottle wine fridge, a large farm sink and is open to an eat-in area as well as a formal dining area. Upstairs you will find the primary bedroom suite with OCEAN VIEWS, lots of closet space and a Mediterranean inspired bathroom.
$1,200,000
3 beds2.5 baths1,720 sq ft11.28 acres (lot)
55 Cresta Verde Dr, Rolling Hills Estates, CA 90274
Beautifully remodeled single level 4 bedroom home located at the heart of the hill. Spanning 2,390 sf on a generous 13,324 sf corner lot, this lovely home creates the perfect blend of comfort and style. Spacious kitchen is a culinary haven, featuring sizeable center island with granite counters and stainless steel appliances. Open concept kitchen, eating and family room for large family gatherings and celebrations. Living room boasts large windows and sliding doors allowing abundant sunlight and pool views, anchored by a grand PV stone gas fireplace. Primary Suite includes sizeable en suite bedroom with sliding doors leading to pool area, plus separate office or 4th bedroom. Backyard is an
Welcome to Luxury 2-story condo at "Silver Spur Court" is located in the heart of Peninsula Center in Rolling Hill Estates featuring 2 bedrooms, 2.5 baths and 1600 SF of living space. Beautiful Spanish Colonial style courtyard living. Gourmet kitchen with granite counters, stainless steel appliances and microwave. Open floor concept with high ceilings in living room and kitchen. Hardwood floor at living room, staircase and dining area. Primary bedroom with big walk-in-closet, double sinks, big deep tub and separate shower. 2nd bedroom also has walk-in-closet and private bathroom. Laundry closet at upstairs. Tankless water heater. Gated 2- car parking & secured storage room.
$1,090,000
2 beds2.5 baths1,600 sq ft
961 Silver Spur Rd, Rolling Hills Estates, CA 90274
This unique industrial chic townhouse boasts 3 bedrooms, and 2 1/2 baths in 1736 sq ft. The handpainted polished concrete floors are throughout and are durable and easy to clean. There is an open concept filled with light affording a bright and airy feeling throughout! There are great treetop views with glittering lights of the South Bay Cities from the primary bedroom! There is a loft office with lots of storage in the primary bedroom and a bonus room in the garage! There is LED lighting throughout with a newer roof with dome lights, newer siding, and new pipes and underpinning in the garage. The terrace in front has a gas hookup for barbecue grilling and entertaining guests! There is
$995,000
3 beds2.5 baths1,736 sq ft2.90 acres (lot)
3623 W Hidden Ln Unit F, Rolling Hills Estates, CA 90274
Nestled in the coveted Rolling Hills Estates, this flat 16,553 square-foot lot offers a tremendous opportunity to build your dream home! Overlooking the fairways of Rolling Hills Country Club and the entire LA basin, the location is paramount for luxury living. Permit-ready plans are already approved and meticulously designed by notable architect Matt Schneider, AIA for a future 4-bedroom, 6-bathroom, 4,560 square-foot home, complete with top-of-the-line amenities. These plans are thoughtfully designed to relish in the expansive views from multiple vantage points throughout the home. The approved plans offer a streamlined path to your shovel-ready dream home. Outdoor enthusiasts will apprec
Discover modern living in this sleek renovated condominium featuring 3 bedrooms and 2 bathrooms. Freshly painted and brand new flooring flows seamlessly throughout the property, adding elegance and warmth. With upgraded electrical throughout the property, convenience and peace of mind are assured, washer and dryer in unit, while two remodeled bathrooms ensure every aspect of your home is tailored to your comfort and style. Step outside to the open patio deck, perfect for enjoying morning coffee or evening gatherings. The dining area complements the open layout, creating a cohesive space for entertaining. Experience the best of contemporary living in this stylish condominium. Walking distanc
$789,000
3 beds2 baths1,367 sq ft
5658 Ravenspur Dr #103, Rancho Palos Verdes, CA 90275
Nestled on Palos Verdes Drive East, this exquisite custom-built Spanish-style residence spans approximately 5400 square feet of living space, gracing a vast 20,000-square-foot lot that bestows unparalleled vistas of city lights, majestic mountains, and the iconic Los Angeles skyline. Originally constructed in 2012, this distinguished property makes its debut on the market, promising a blend of sophistication and serenity. Upon arrival, a spacious driveway welcomes guests with abundant parking for at least five cars, complemented by an expansive three-car garage designed to accommodate larger vehicles. Within the garage, a separate storage and workshop area awaits, seamlessly connected to th
$4,300,000
5 beds5.5 baths5,456 sq ft0.47 acre (lot)
27591 E Palos Verdes Dr E, Rancho Palos Verdes, CA 90275
TURN KEY single story home in the “Vista Verde “ tract in the southwest corner of Lomita . Homes rarely come on the market in this hidden gem of a neighborhood. Remodeled with lots of light . New kitchen and baths , crown molding and can lighting thru out . AC/ and central heat make it comfortable year round . Double door entry , vinyl plank floors , all new raised panel interior doors and hardware . New double Pane windows and sliding glass door . Plantation shutters throughout. Water filtration system . Deep jetted soaking tub . This all sits on a prime corner lot . A gardeners dream with raised planter boxes for your vegetable garden and an array of colorful flowers and pl
Proudly showcasing one of the most esteemed floorplans at RHCC, this phenomenal 5,200 square foot Modern Farmhouse estate located on the front row in the exclusive, gated Residences of Rolling Hills Country Club, is the one you’ve been waiting for! Set at 39 Chandler Ranch Road – on the premier street, within walking distance of the Clubhouse - this gorgeous 4-bedroom, 4.5 bath plus office + den home is impeccably positioned on the 15th fairway of RHCC’s David McLay Kidd championship layout. Sitting upon a generous 12,851 square foot lot, one of the property’s countless highlights is its unobstructed 180-degree views of the golf course and sparkling city lights. Desi
$6,950,000
4 beds5 baths5,203 sq ft0.30 acre (lot)
39 Chandler Ranch Rd, Rolling Hills Estates, CA 90274
Step into an exceptional living experience redesigned by award-winning architectural firm MCM group, and interior design firm Artfulnest. Their stylish reinvention of 4448 Via Pinzon is a harmonious blend of comfort, functionality, and luxury. Nearly new construction, every inch of this home has been rebuilt from the bare studs, including all-new main functions. Custom-made modern fittings throughout result in the epitome of sophistication and elegance. Details surrounding this home are an unmatched entertainer’s delight; beginning with it’s location! Located in highly desired Valmonte, access on/off the hill is a breeze, situated on a cul-de-sac with plentiful guest parking, st
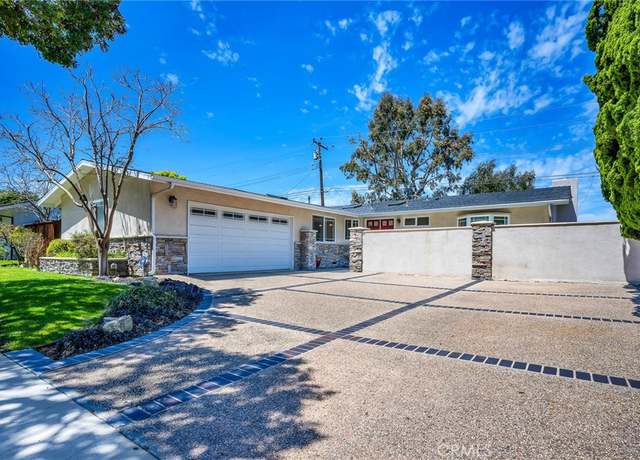
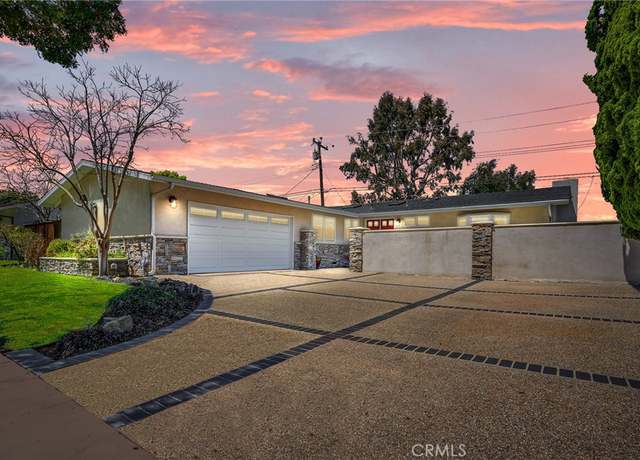
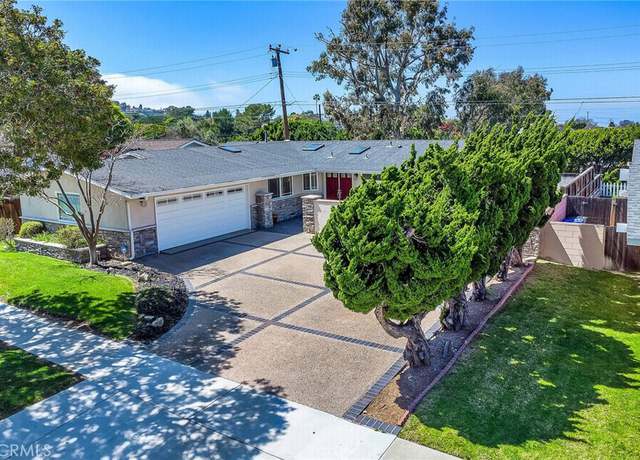
The views are endless! Almost 180 degrees. What a great place to watch the sunrise and the sunset. It's amazing. It has 4 bedrooms 3 bathrooms, a family room and a room that could be used as a play room or office. There is a very large laundry room with tons of storage space, new 3 zone central & air system, tankless water heater, skylights in the kitchen, and more! All the nature light is something to see. It is the last house on the street with a gated private driveway. This is a must see! * * ALL NEW FLOORS JUST PUT IN THIS WEEK!
Tranquility and timeless elegance converge in this exquisite custom estate nestled within Rolling Hills Estates' most coveted neighborhood and street. Step into this expansive 5-bedroom residence, where a graceful foyer leads to a refined living space seamlessly connected to a dining area and a breathtaking gourmet kitchen, ideal for both entertainment and family gatherings. The heart of this home is undeniably its expansive chef's kitchen, boasting Viking Appliances, a custom mosaic tile backsplash, a built-in banquette, and a walk-in pantry, inspiring culinary creativity for gatherings of any size. The main level also hosts a spacious primary bedroom suite offering tranquil canyon views,
$3,988,000
5 beds4 baths5,076 sq ft0.42 acre (lot)
4711 Sugarhill Dr, Rolling Hills Estates, CA 90274
Less than 2 miles off the Pacific Coastline sits 5832 Scotwood Drive in Rancho Palos Verdes. A luxurious Mediterranean-inspired home boasting four bedrooms, three and three quarter baths, a serene in-ground pool, and spa surrounded by lush landscaping. This custom-built gem features French doors, three cozy fireplaces, and an ocean view from the upper level. Situated on a tree-lined street near Highridge Park, this entertainer's paradise is perfect for those seeking the ultimate in comfort and style. This home offers a charming blend of elegance and modern amenities, making it an ideal retreat.
Enjoy spectacular panoramic ocean views from Catalina and up the coastline to Malibu. This oversized end unit offers ocean views from almost every room. Upon entering you will be welcomed by the inviting floor plan featuring an open living area with a warm and inviting fireplace, beamed ceilings, and custom builtin cabinets, spacious dining area with views opening directly onto a viewing deck. The kitchen features granite counters and bar seating with a cozy family room ideal for relaxing. The lower level offers three or four generous bedrooms each boasting coastal views. The expanded primary suite includes a sitting area or office, en suite bath with a soaking tub and shower plus a generou
MUST SEE! TURNKEY BEAUTIFUL LOMITA DUPLEX! This Remodeled Property is Located In A HIGHLY SOUGHT AFTER NEIGHBORHOOD. Perfect For An Investor or A Multi-Family Purchase! The 2 Story Unit Boasts 3 Bedrooms & 2 Bathrooms. It Has 1 Bedroom and 1 Bathroom located on The 1st Floor of This Unit. This Unit Also Has An Open Covered Patio Entertainment Area, Where You Have Gorgeous PANORAMIC VIEWS of Downtown Los Angeles! The Single Story Unit boasts 2 Bedrooms and 1 Bathroom. Relax In Your New EXTREMELY PRIVATE Backyard and Courtyard Area and Take In The Beautiful Views From There As Well! This Is TRULY AN ENTERTAINER'S DREAM! This Property Also Features An Extra Large Driveway, Large Enough F
Totally remodeled 2,929 sf home located in the desirable Victoria Knolls with nice backyard. First floor, entry level, features 3 bedrooms, 2.5 bathroom and a spacious living room with built in bar area and dining room with fireplace. Total remodeled kitchen, with granite counter tops, stainless appliances and sliding glass door to the backyard. Built in BBQ, partially covered patio in the backyard, great for entertaining. Large and very private master suite upstairs, large master bathroom with double sinks, jacuzzi tub, shower, large walk-in closet, consists of office, with built in desk for two, fireplace in the separate sitting area and balcony, with laundry room upstairs. Plenty of stor
This beautiful cottage like home is located in desirable Skyline Mobile Home Park, a 55+ community. Home was built in 2004 and includes a view of the city lights. When you enter this home you will notice all of the upgrades that have been made, such as new garbage disposal, kitchen faucet, range, dishwasher, microwave, ADA compliant toilet in master bathroom, walk in tub, lighting in the hall and laundry room, light ceiling fan in the bedroom, wall scone in guest bedroom, exterior lights outside in the driveway, new ceiling lights and recess lights in the kitchen and living room. This home shows “Pride of Ownership” and has been well maintained. High ceilings with oak style cabi
$275,000
2 beds2 baths897 sq ft
2550 Pacific Cost Highway #116, Torrance, CA 90505
Discover this extraordinary vacant land nestled within one of Rancho Palos Verdes' most prestigious private streets. Boasting over half an acre, this unique property offers an unparalleled opportunity with a captivating view of the iconic queen's necklace—a spectacle that will undoubtedly fulfill any entertainer's aspirations. Imagine bringing your dream home to life amidst breathtaking panoramas and the serenity of an award-winning school district. This is more than an investment; it's a chance to create your own retreat. The property comes with an approved Soils Report by the city of Rancho Palos Verdes, along with conceptual drawings for a remarkable 5,283 square foot, 6-bedroom Mi
This area's enrollment policy is not based solely on geography. Please check the school district website for more information.
Elementary schools
Middle schools
High schools
GreatSchools Summary Rating
9/10
Soleado Elementary School
Public, K-5
8/10
Cornerstone At Pedregal Elementary School
Public, K-5
8/10
Rancho Vista Elementary School
Public, K-5
8/10
Dapplegray Elementary School
Public, K-5
7/10
Silver Spur Elementary School
Public, K-5
Only showing 5 of
6 elementary schools.
School data is provided by GreatSchools, a nonprofit organization. Redfin recommends buyers and renters use GreatSchools information and ratings as a first step, and conduct their own investigation to determine their desired schools or school districts, including by contacting and visiting the schools themselves.Redfin does not endorse or guarantee this information. School service boundaries are intended to be used as a reference only; they may change and are not guaranteed to be accurate. To verify school enrollment eligibility, contact the school district directly.
What is transportation like in Rolling Hills Estates?
Rolling Hills Estates, California is known for its well-maintained roads, providing a smooth driving experience for car owners. Traffic levels are generally moderate, ensuring a relatively stress-free commute. While the city does not have its own public transportation system, it is well-connected with nearby cities through several highways and freeways. This makes it convenient for residents to travel to and from Rolling Hills Estates, California.
What types of properties are available in Rolling Hills Estates?
Rolling Hills Estates, California offers a variety of single-family home types, including ranch-style homes, contemporary homes, and Mediterranean-style homes. These homes can be found throughout the city, with some located in gated communities like The Ranch and The Terraces. Most properties in Rolling Hills Estates have three to five bedrooms and were built between the 1960s and 1990s. To explore different property types for sale in Rolling Hills Estates, California, use the 'Home type' filter located above the active listings. Customize your search by selecting options like single-family homes, condos, townhomes, and more.
What is life like in Rolling Hills Estates?
Rolling Hills Estates, California offers a serene living experience with its picturesque landscape of rolling hills and lush greenery. The region enjoys a mild Mediterranean climate, characterized by warm summers and cool winters. The area provides a range of job opportunities across various industries, including technology, healthcare, and education. Residents can engage in a variety of recreational activities, such as hiking and biking on the numerous trails, playing golf at the local courses, or exploring the local parks and nature reserves. The community also offers a vibrant arts scene, with opportunities to attend local art exhibits, concerts, and theater performances.
What are the schools and amenities like in Rolling Hills Estates?
Rolling Hills Estates, California, is a vibrant community offering a variety of public amenities to its residents. The city is home to several restaurants, providing a diverse range of culinary experiences. For those who enjoy outdoor activities, there are numerous parks within the city limits. Daily necessities can be conveniently purchased at local grocery stores. Additional amenities include a public library, tennis courts, and equestrian trails, all contributing to the high quality of life in Rolling Hills Estates, California.
In the past month, 5 homes have been sold in Rolling Hills Estates. In addition to houses in Rolling Hills Estates, there was also 1 condo, 7 townhouses, and 0 multi-family units for sale in Rolling Hills Estates last month. Find your dream home in Rolling Hills Estates using the tools above. Use filters to narrow your search by price, square feet, beds, and baths to find homes that fit your criteria. Our top-rated real estate agents in Rolling Hills Estates are local experts and are ready to answer your questions about properties, neighborhoods, schools, and the newest listings for sale in Rolling Hills Estates. Our Rolling Hills Estates real estate stats and trends will give you more information about home buying and selling trends in Rolling Hills Estates. If you're looking to sell your home in the Rolling Hills Estates area, our listing agents can help you get the best price. Redfin is redefining real estate and the home buying process in Rolling Hills Estates with industry-leading technology, full-service agents, and lower fees that provide a better value for Redfin buyers and sellers.

 REDFIN IS COMMITTED TO AND ABIDES BY THE FAIR HOUSING ACT AND EQUAL OPPORTUNITY ACT. READ REDFIN'S FAIR HOUSING POLICY AND THE NEW YORK STATE FAIR HOUSING NOTICE.
 United States
 Canada