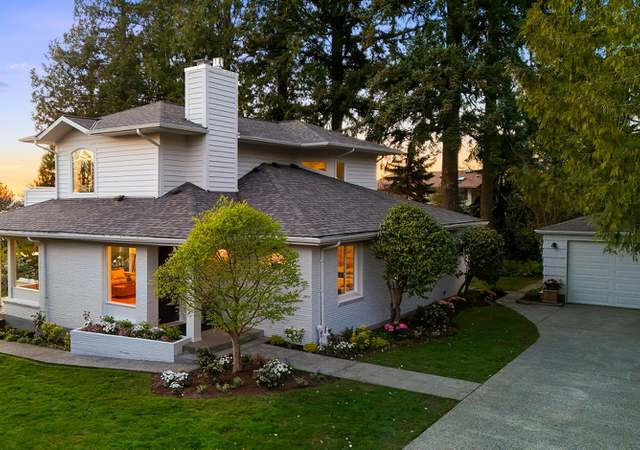
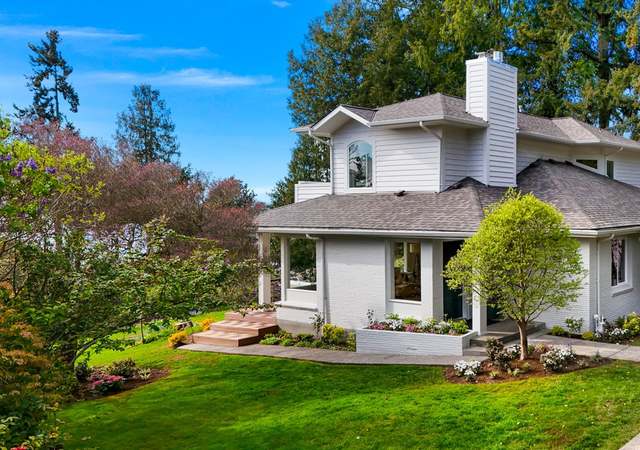
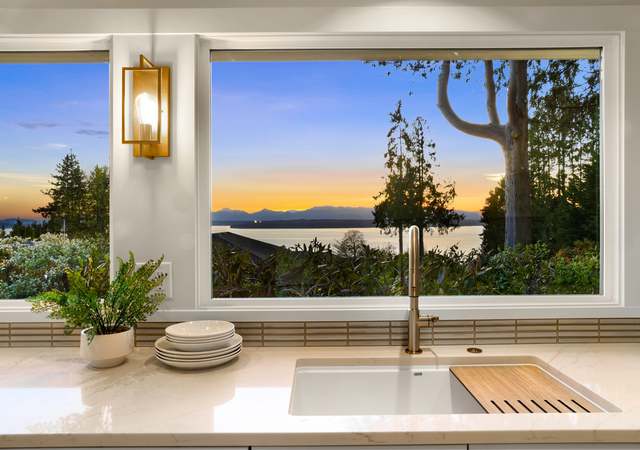
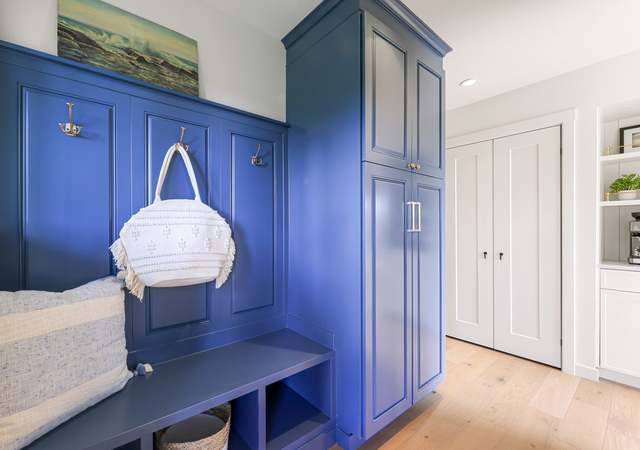
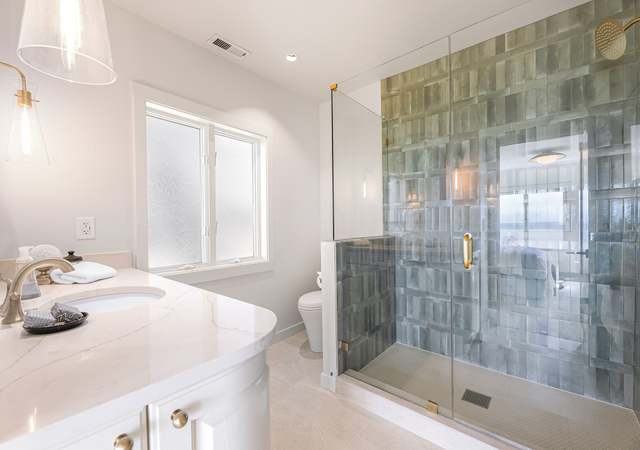
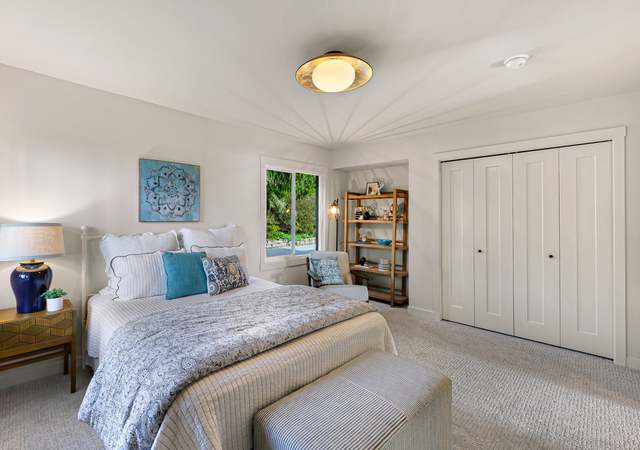
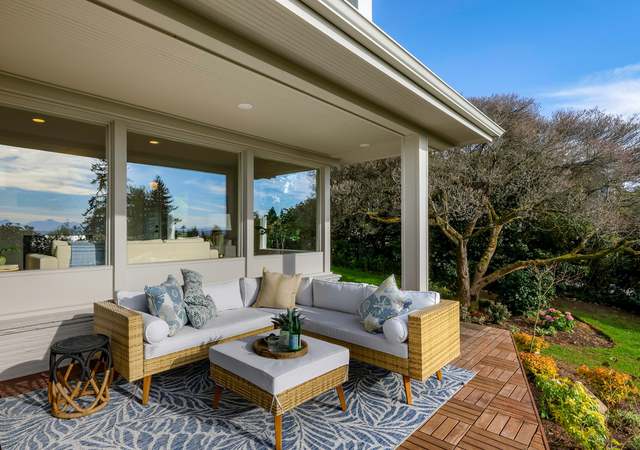
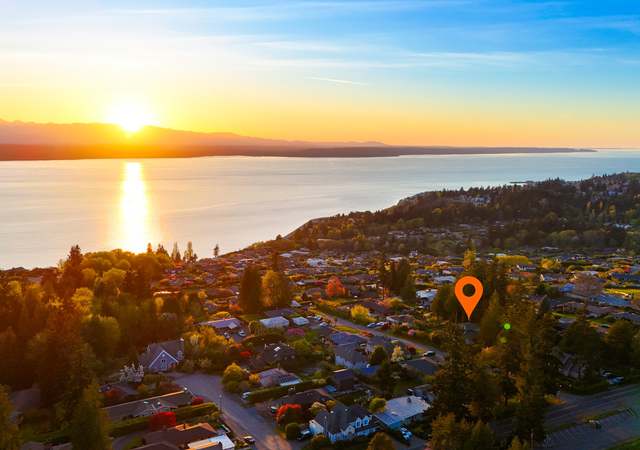
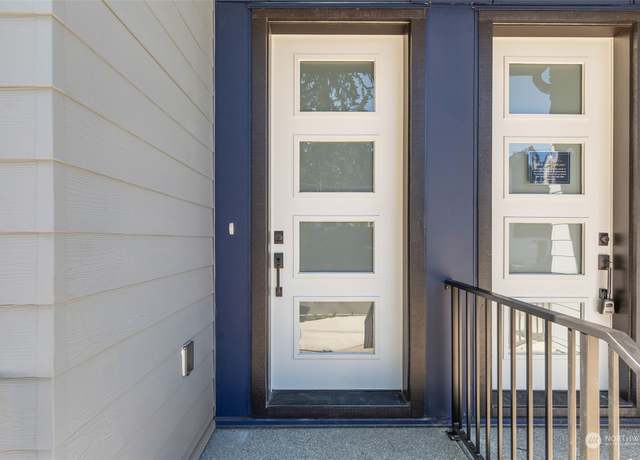
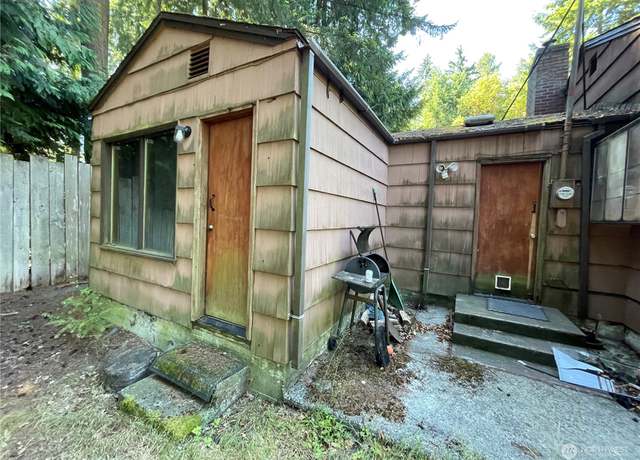
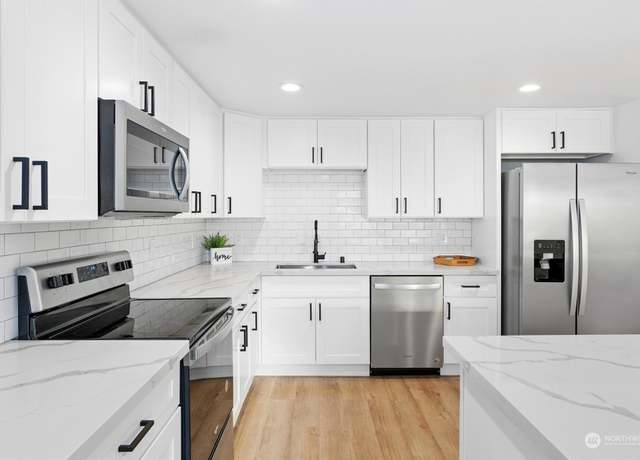
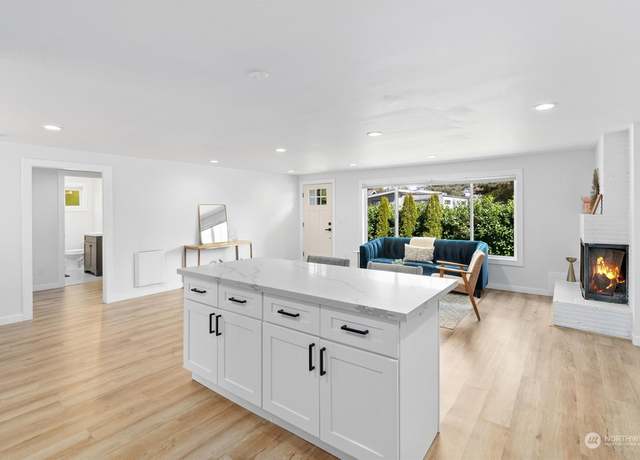
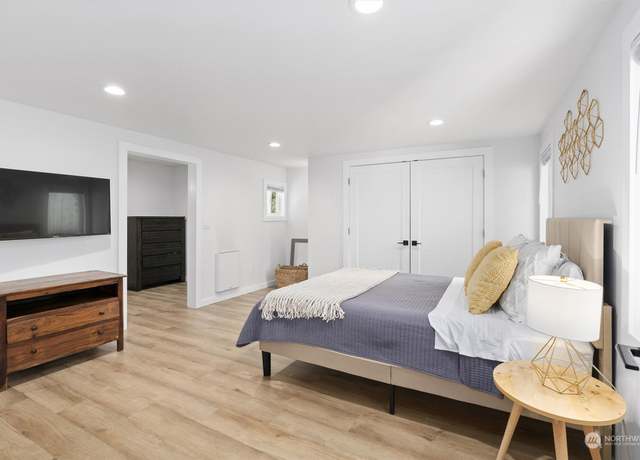
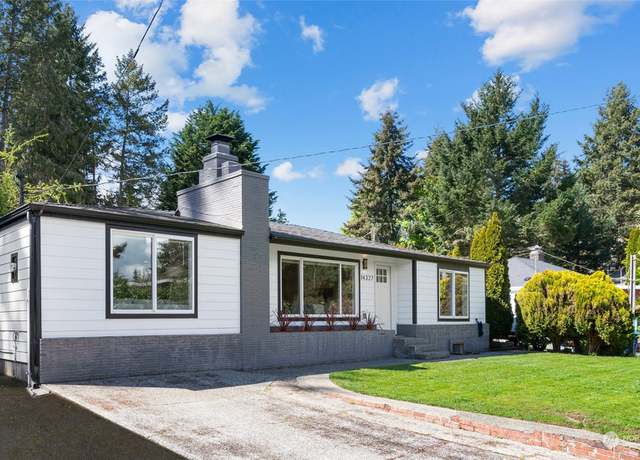
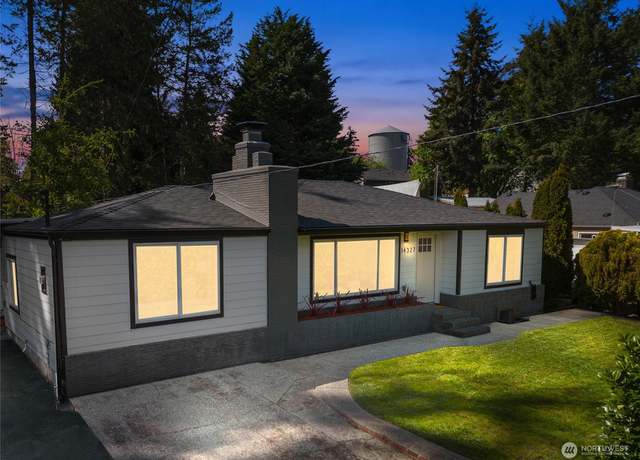
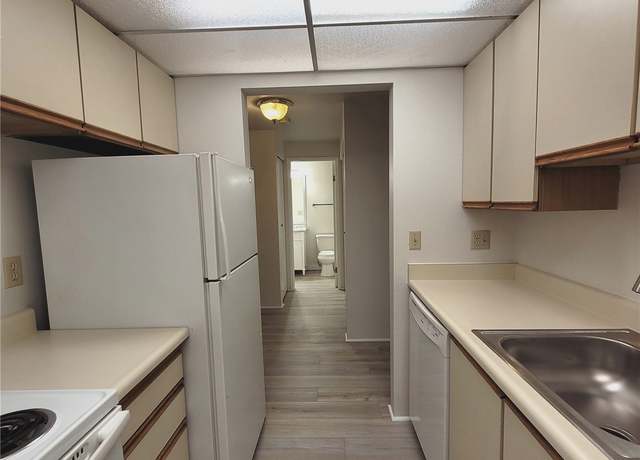
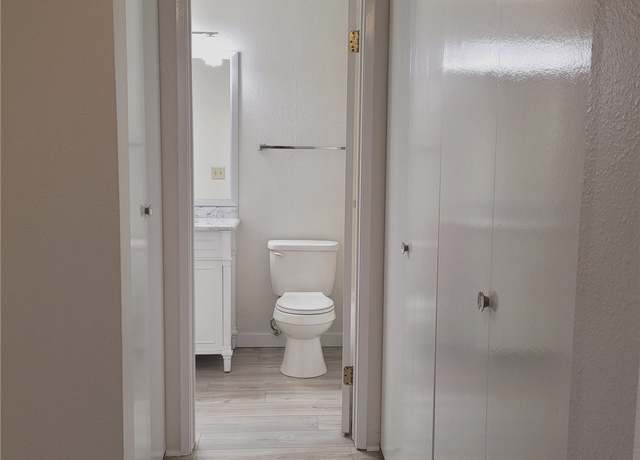
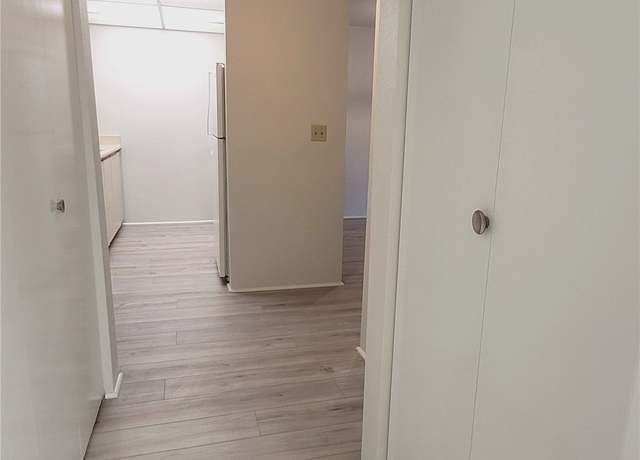
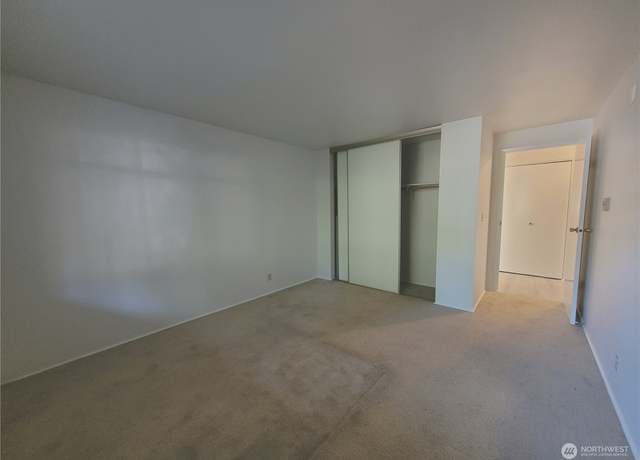
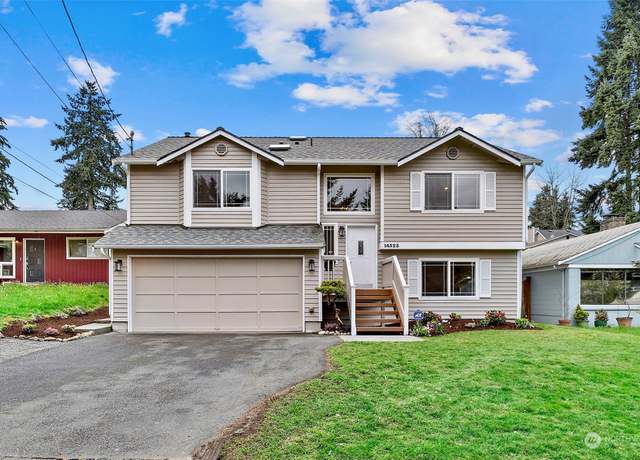
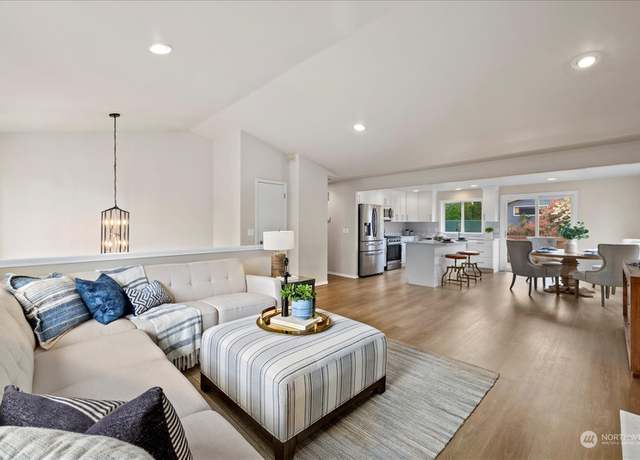
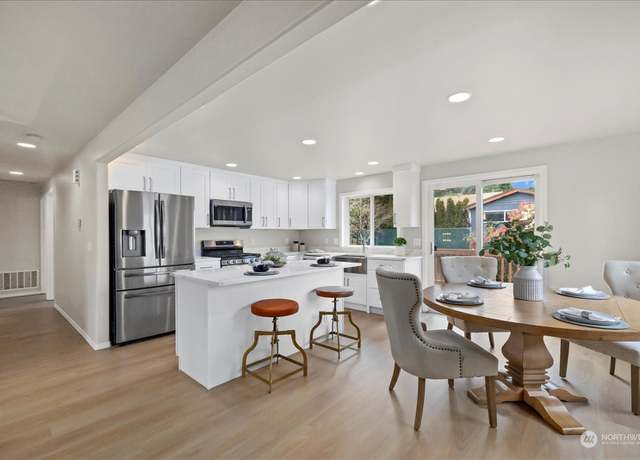
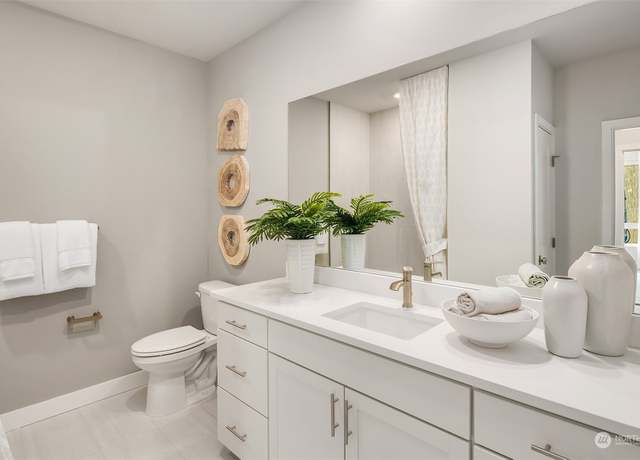
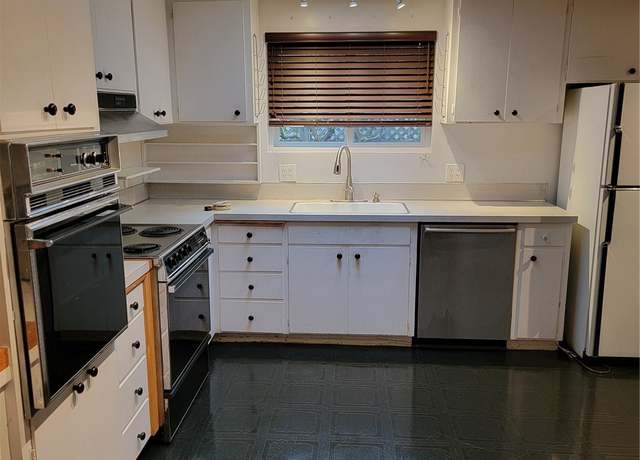
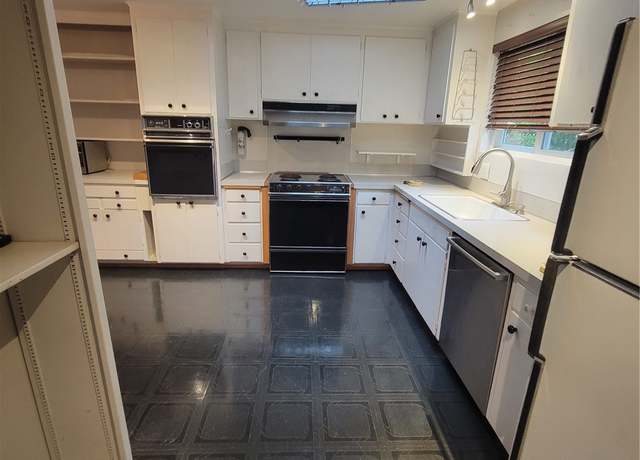
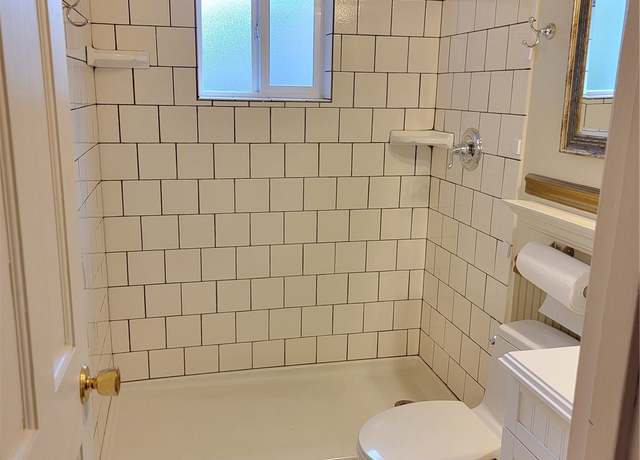
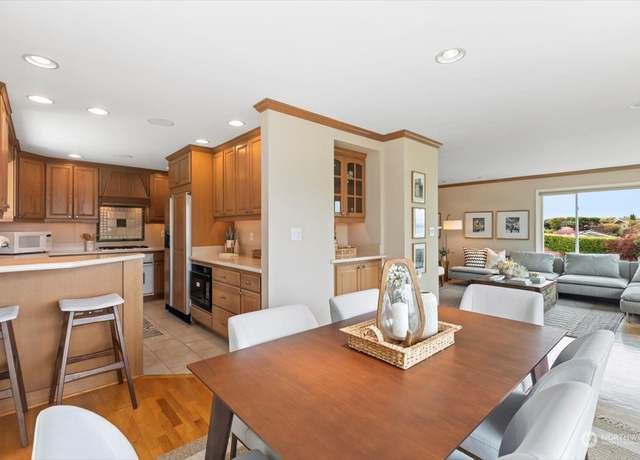
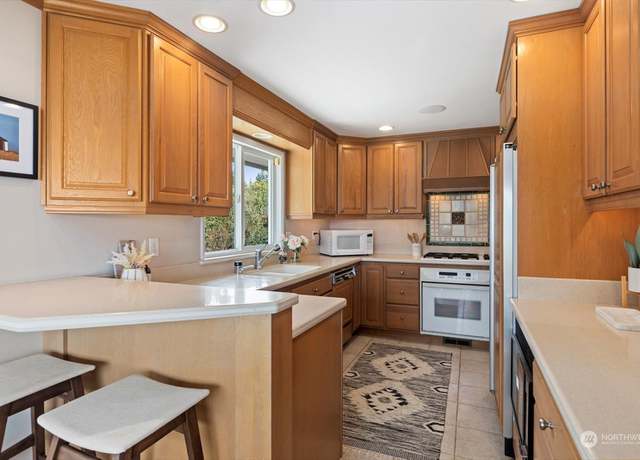
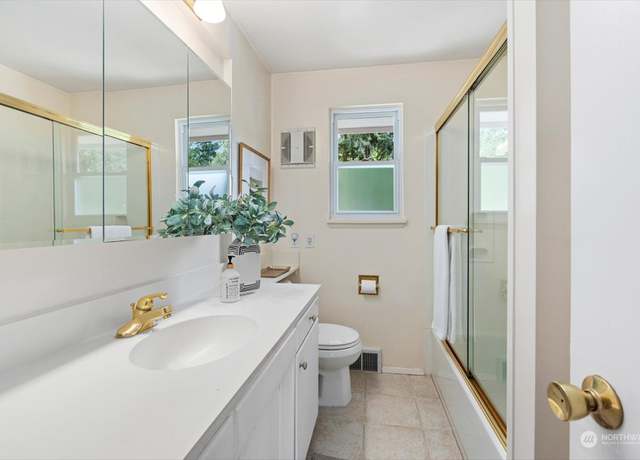
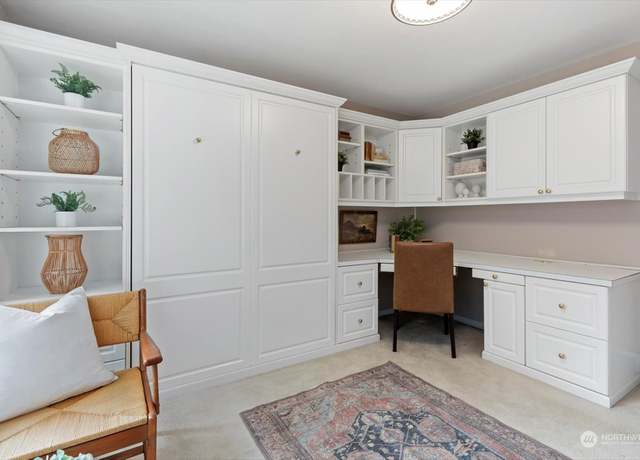
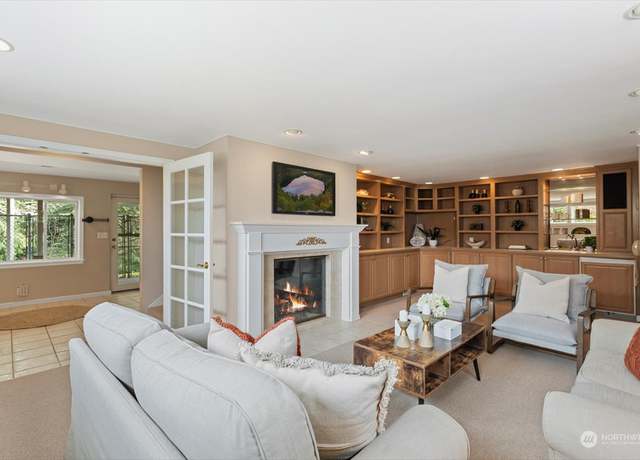
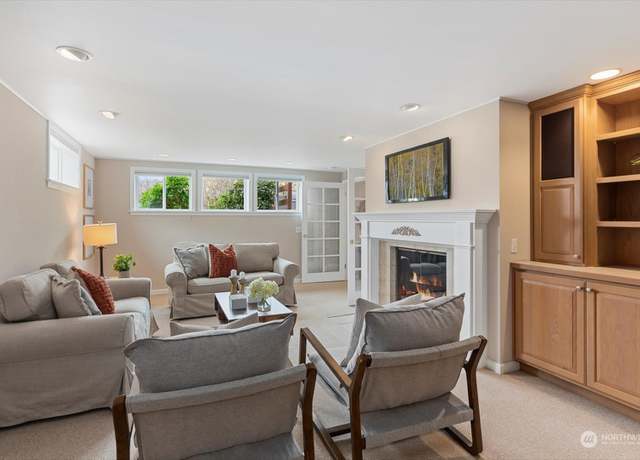
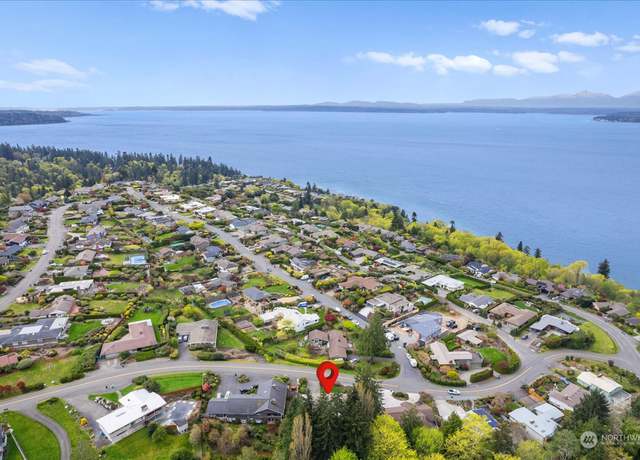
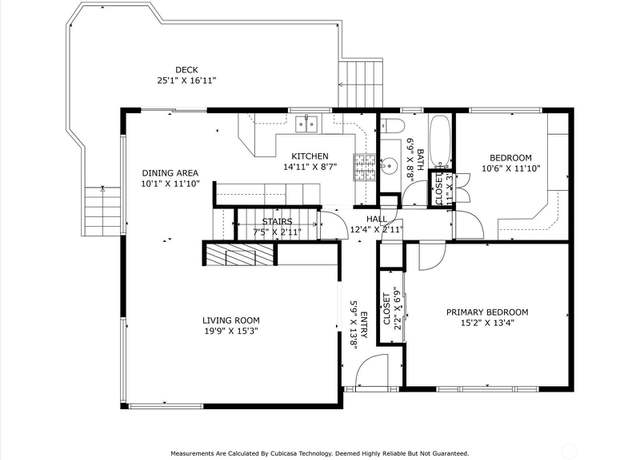
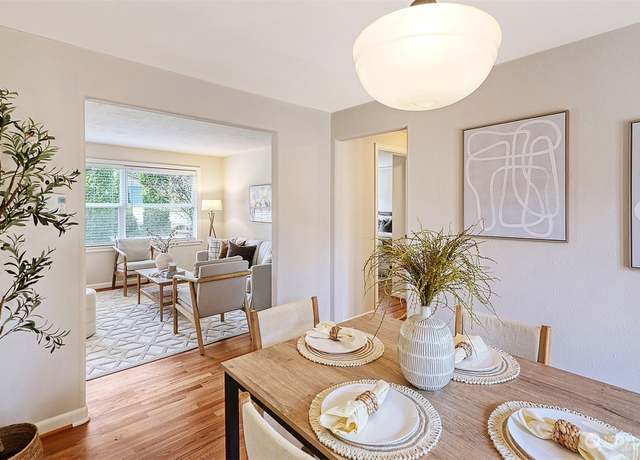
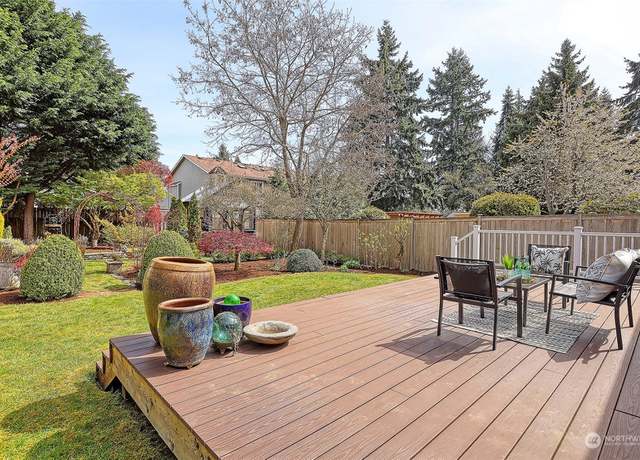
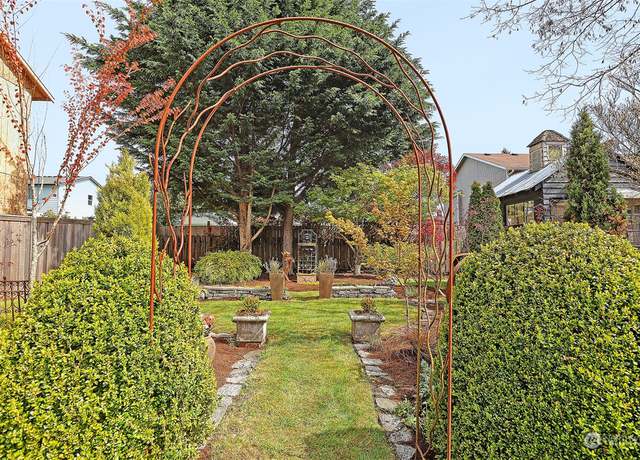
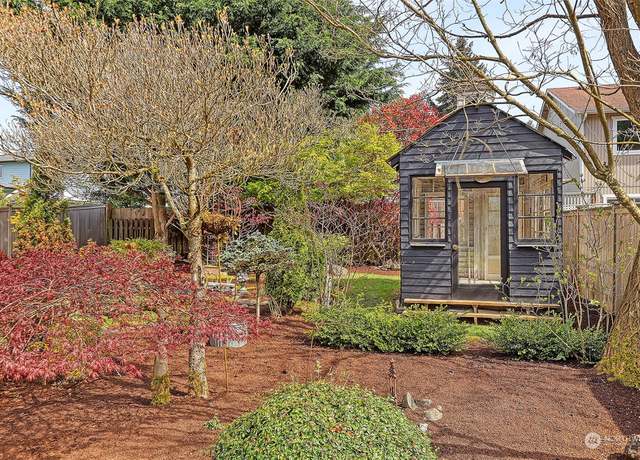
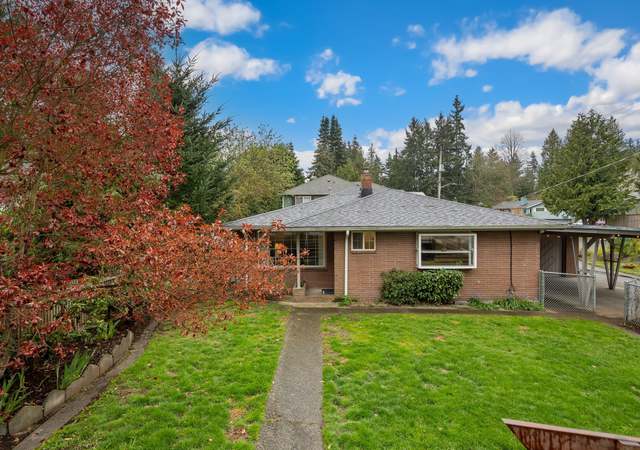
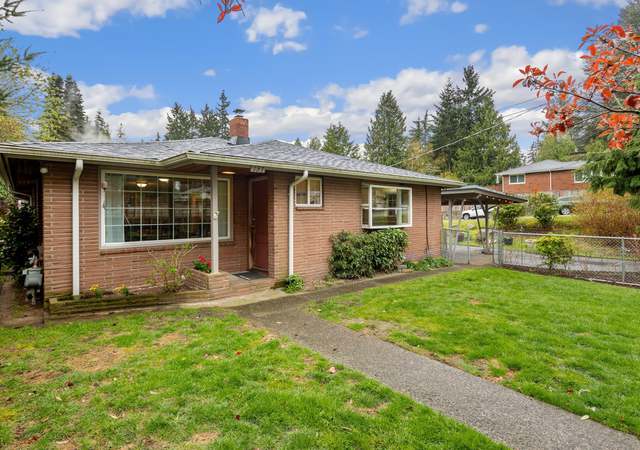
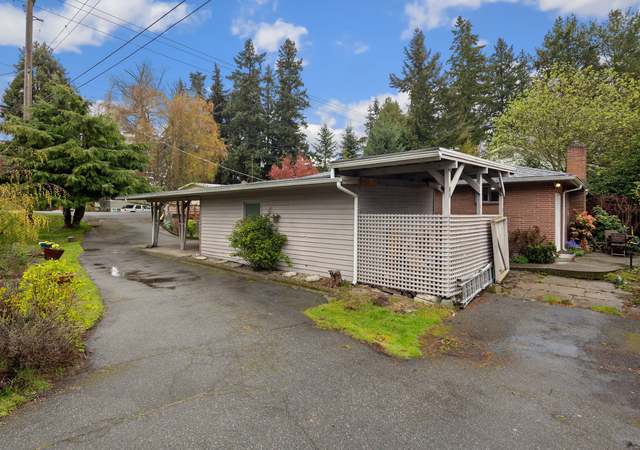
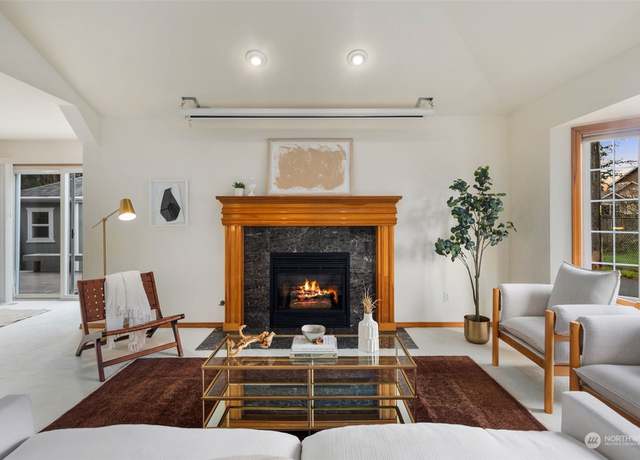
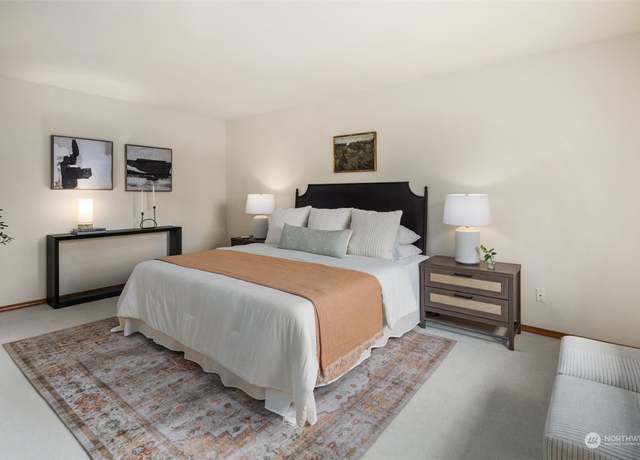
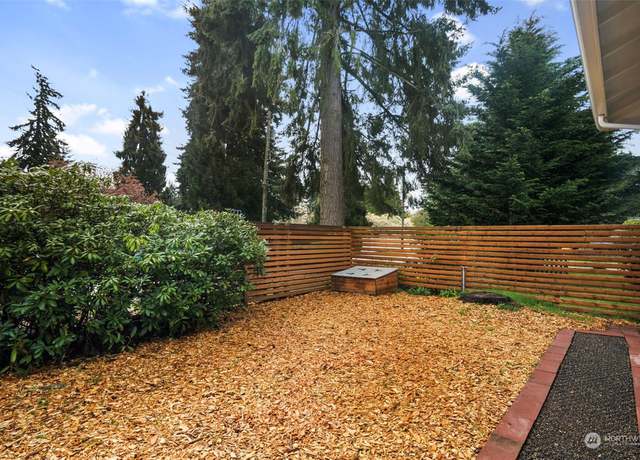
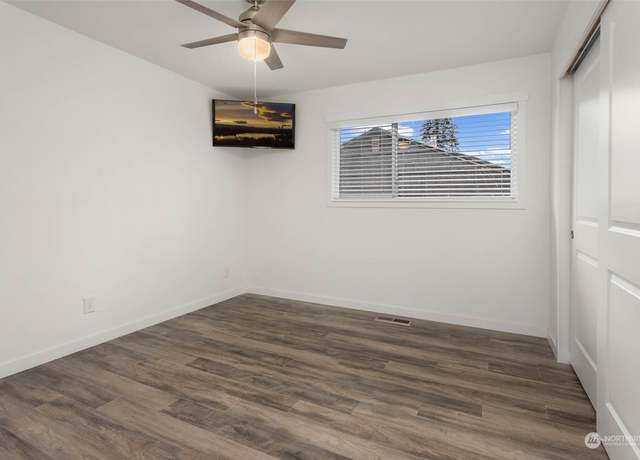
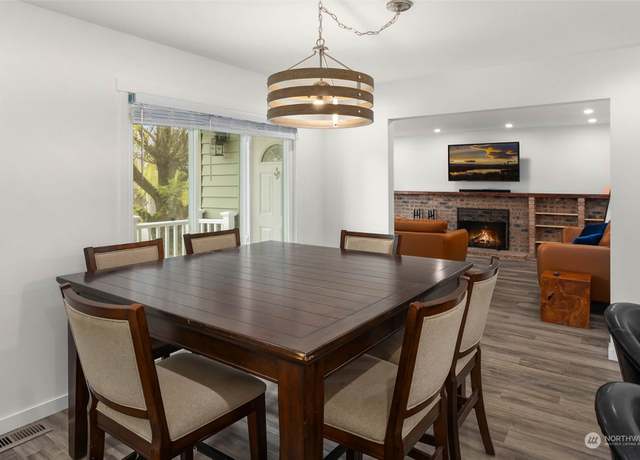
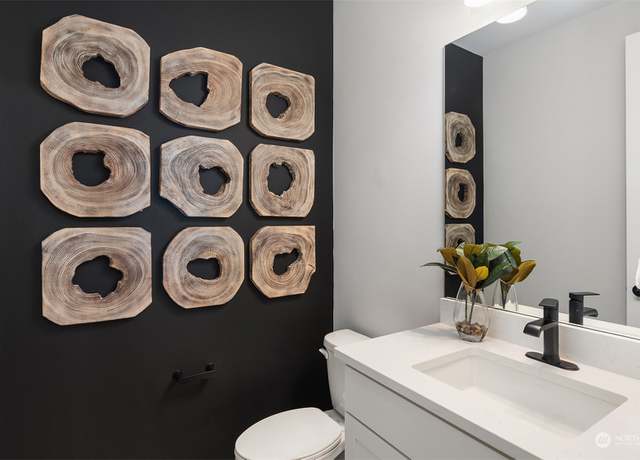
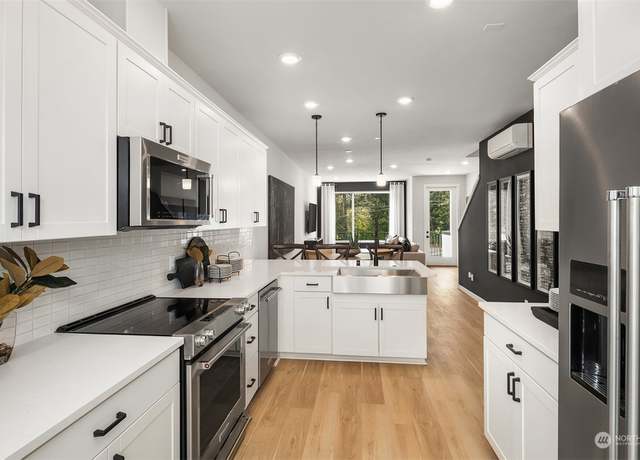
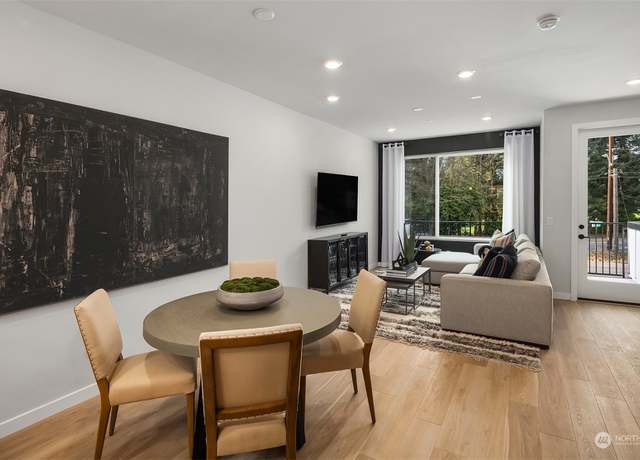
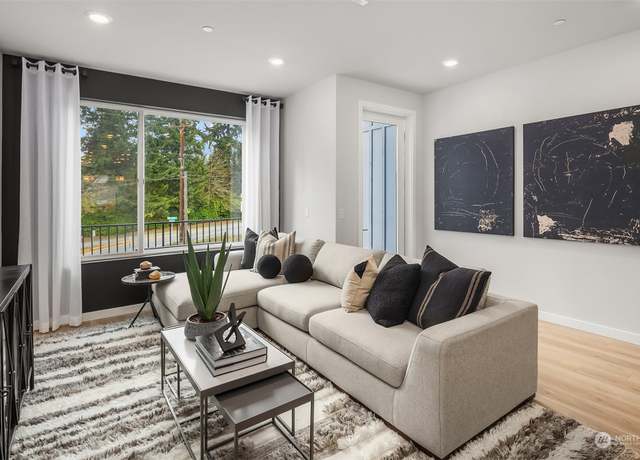
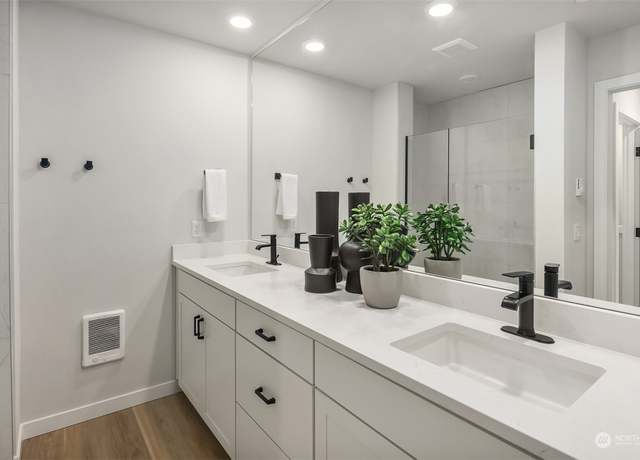
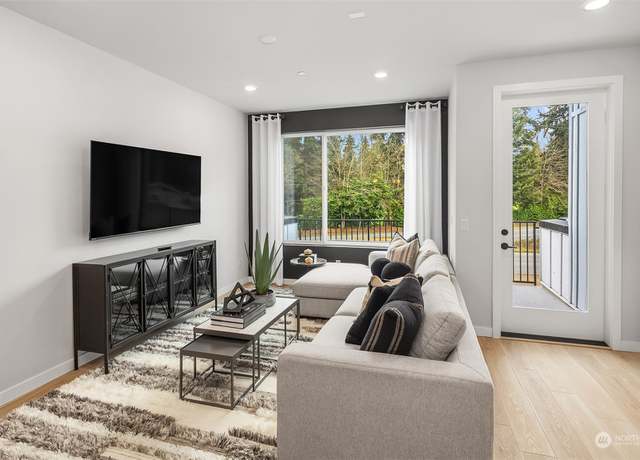
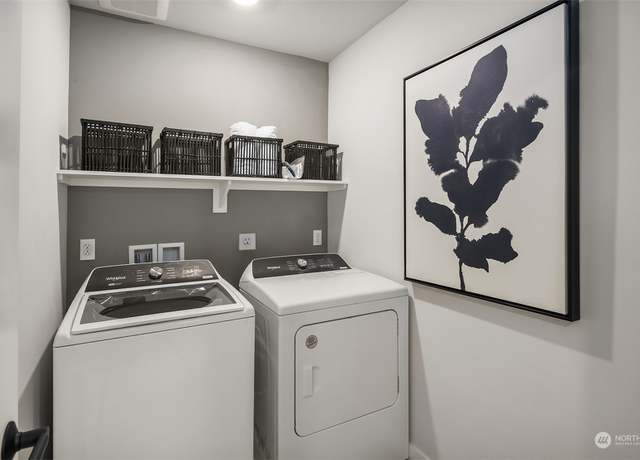
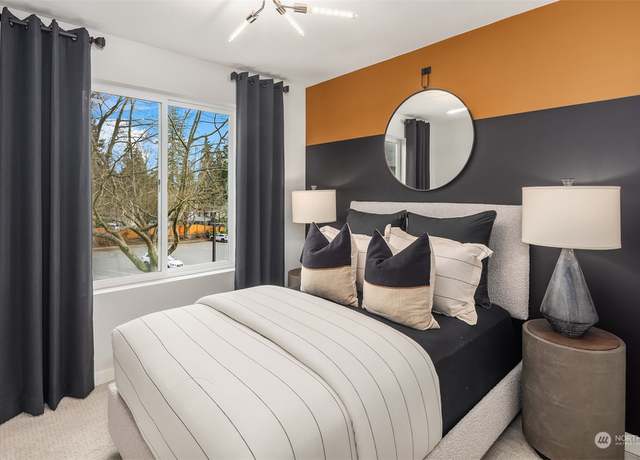
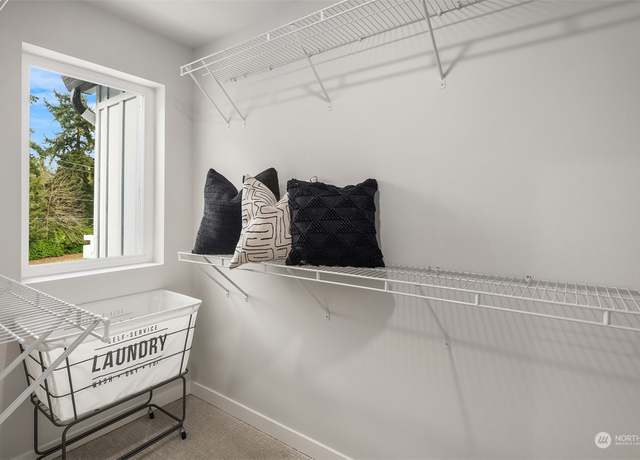
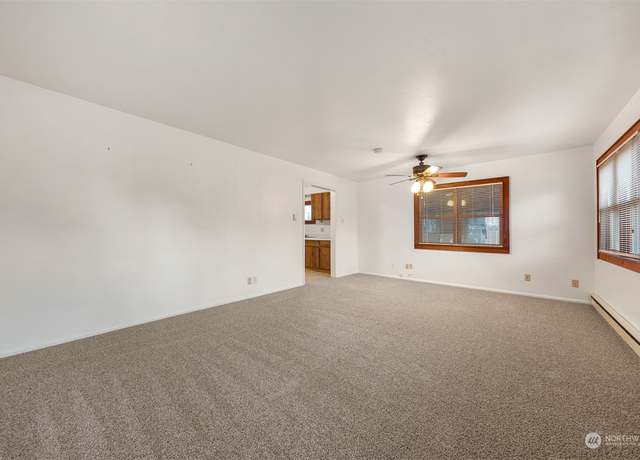
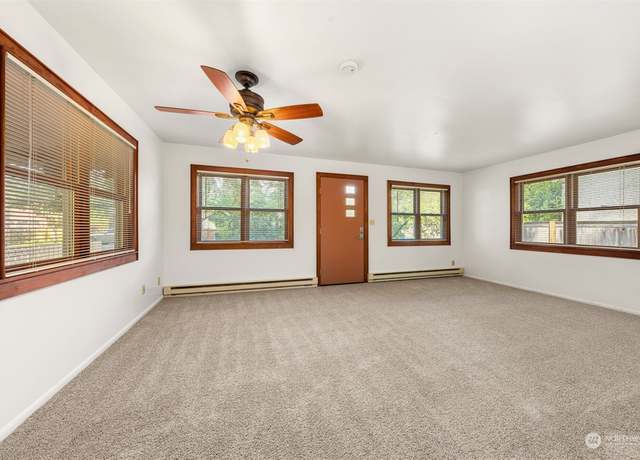
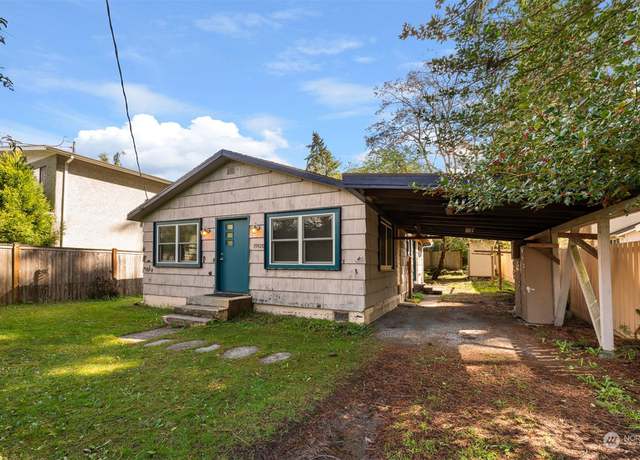
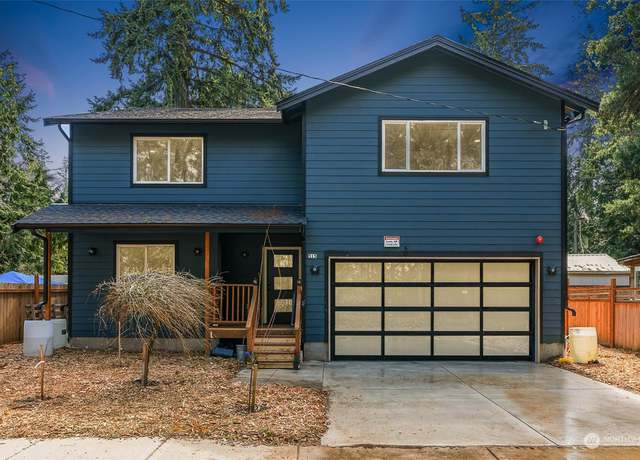
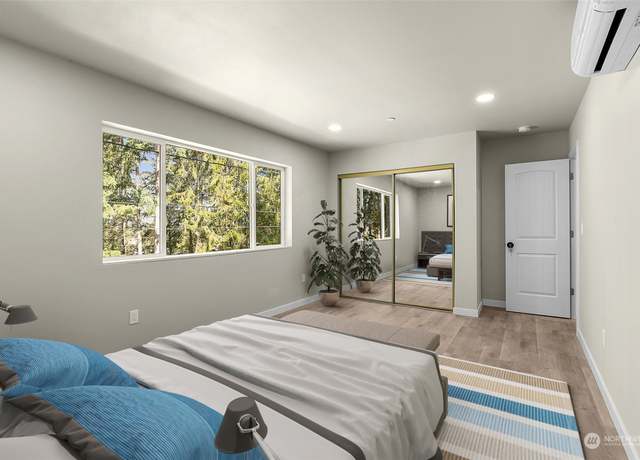
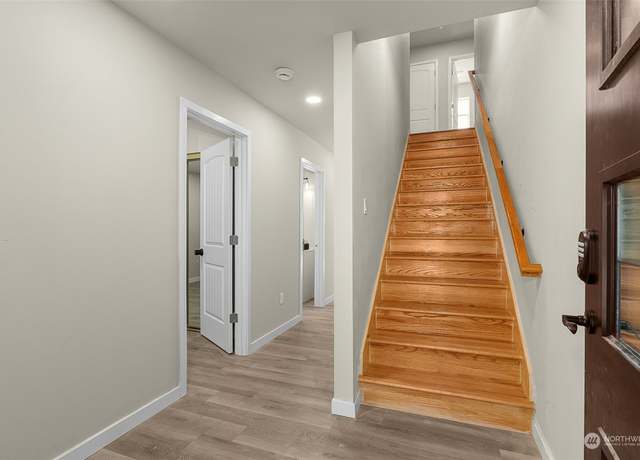
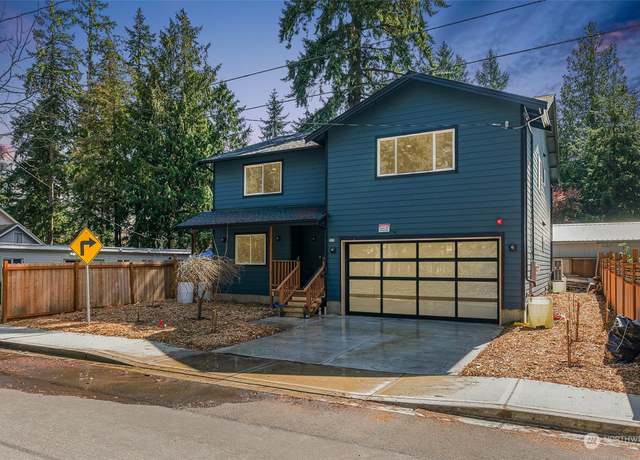
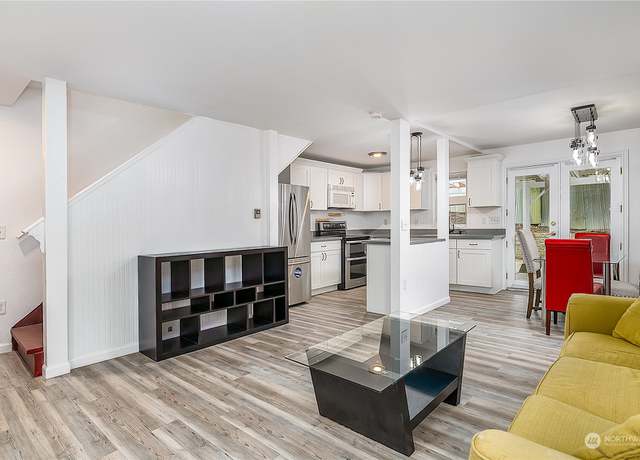
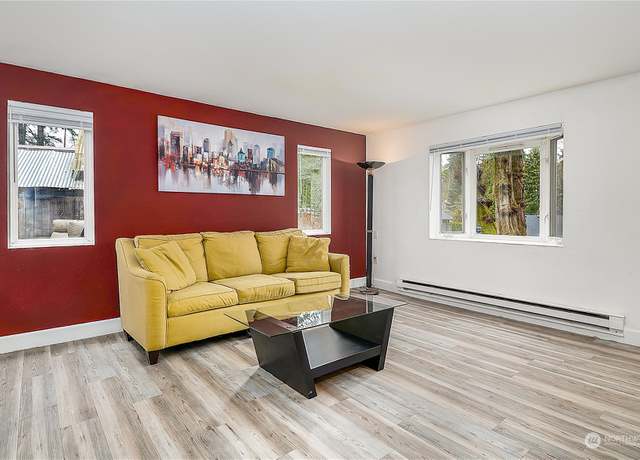
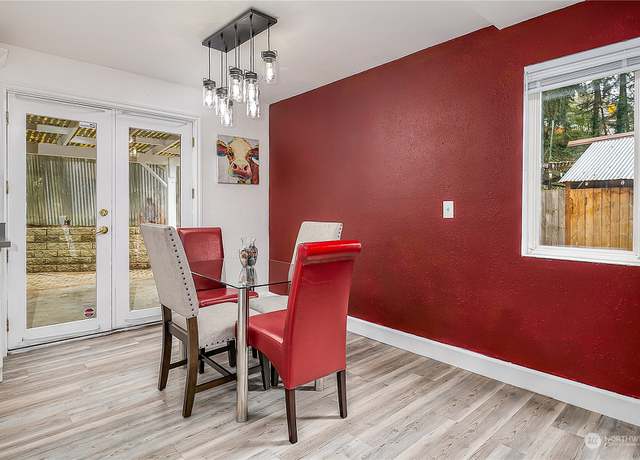
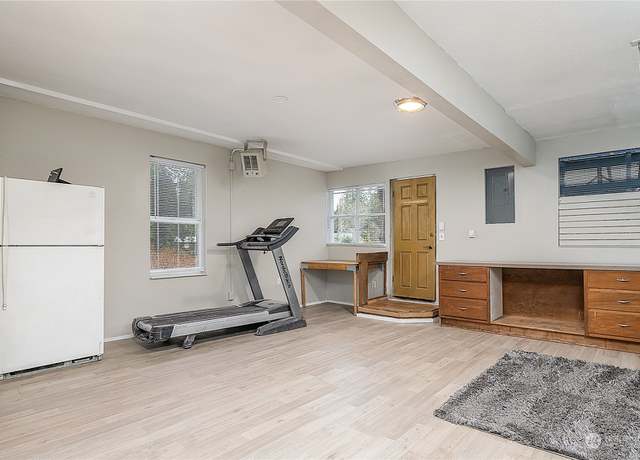
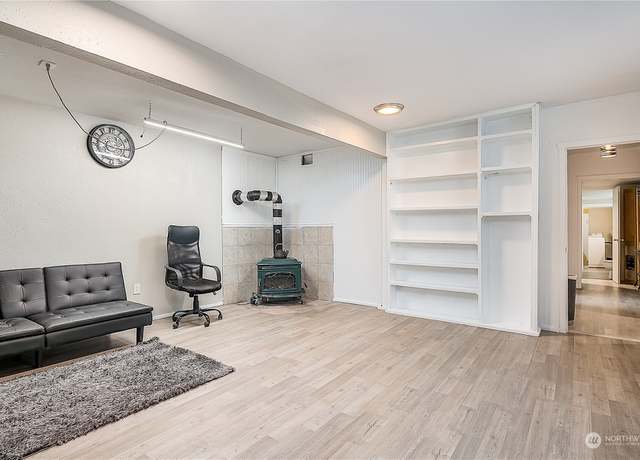
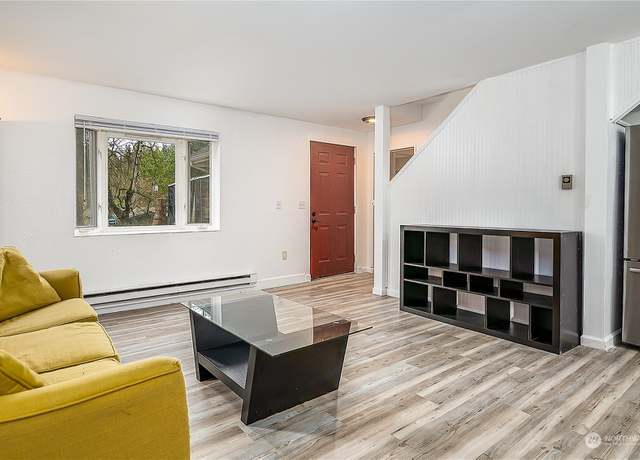
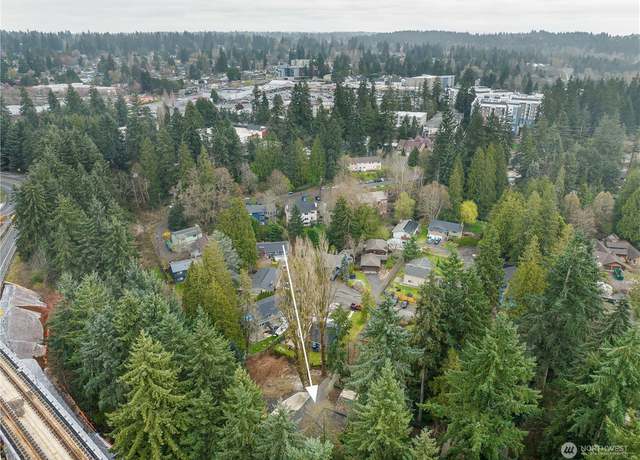
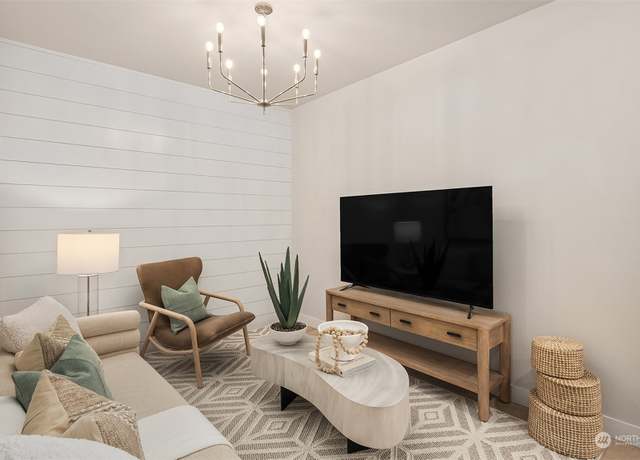
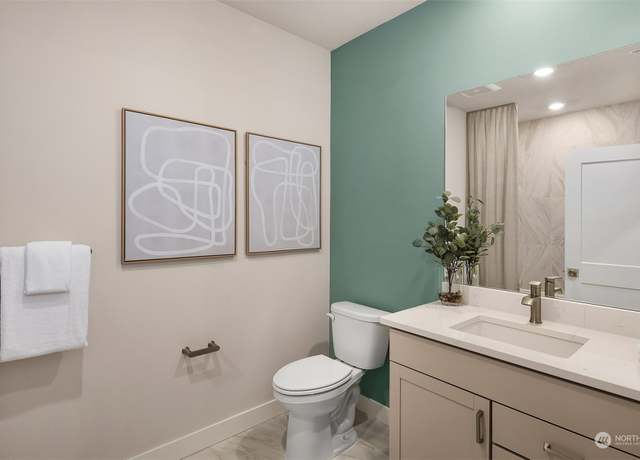
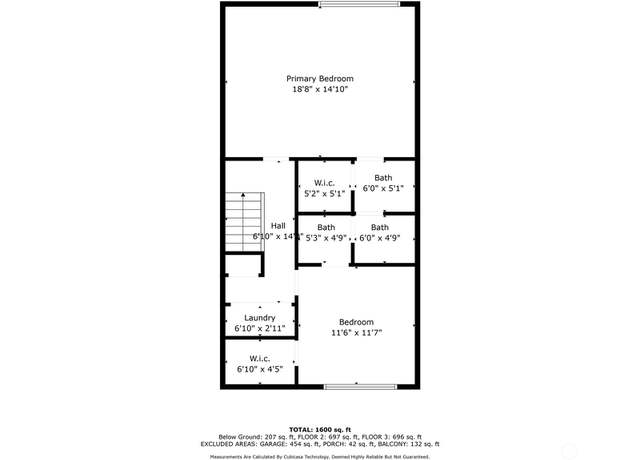
A beautifully renovated home in the highly sought after Northside Garden area of Richmond Highlands. This home has been brought to life through innovative design and thoughtfully curated design elements. Feels like a brand-new home while offering charm and exquisite details around every corner. An entertainer's dream with a large, covered main floor patio and second floor deck both offering breathtaking views of the Olympic Mountains and Puget Sound. This ½ acre (double lot) is a gardener’s paradise, with mature landscaping that offers beauty with every season. This home is tailor-made for those who appreciate both comfort and luxury in the beautiful Pacific Northwest. No HOA d
1/41
$2,100,000
3 beds2 baths2,221 sq ft0.53 acre (lot)
1024 NW 178th St, Shoreline, WA 98177
Listing provided by NWMLS as Distributed by MLS Grid
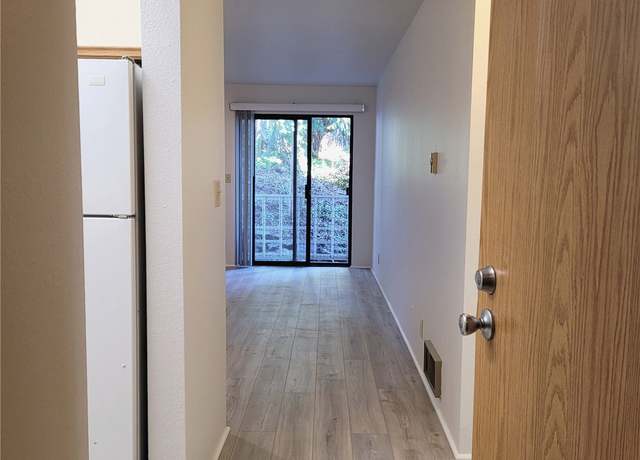
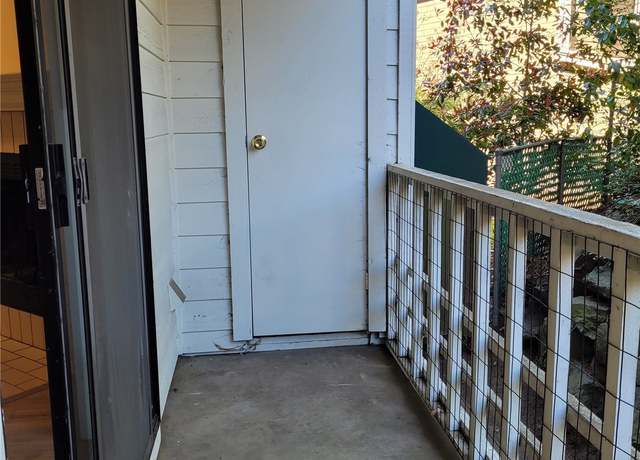
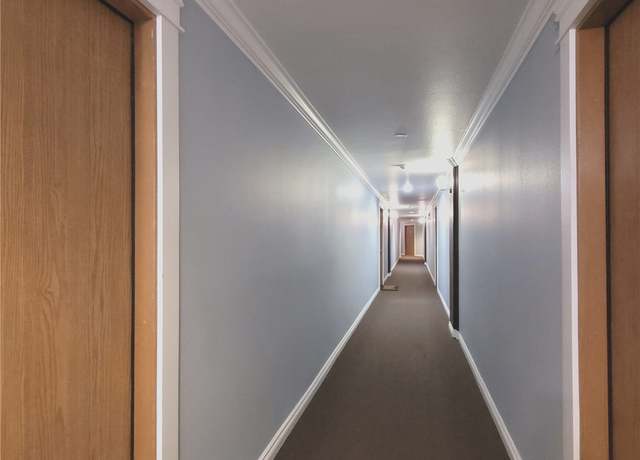
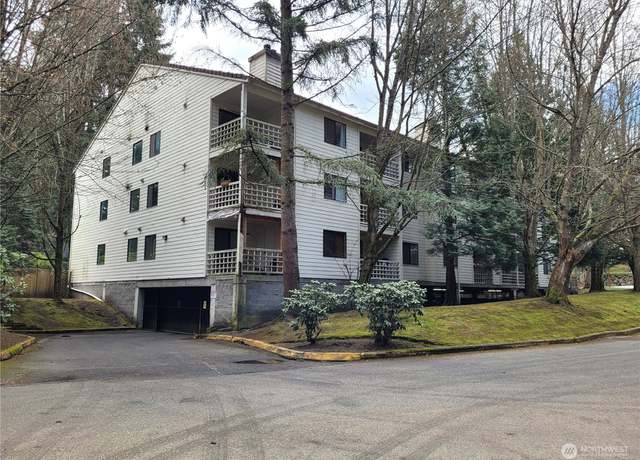
Echo Lake Waterfront 1 bed condo with private lake access and 125' of lakefront property to enjoy. With summer arriving, kayak or paddle board or just enjoy the quiet park-like setting. A wood burning fireplace for those colder nights, maintained by HOA and a private patio for the urban gardener. Close to transit center, Costco, I-5 access, the Interurban Trail and Light Rail stations opening in Shoreline August 2024! An easy commute however you choose to travel, auto, bus, train or bicycle. No rental cap, pet friendly and move-in ready with ceramic tile flooring, stainless steel appliances and in unit washer/dryer. A well run HOA with low HOD's.
1/15
$305,000
1 bed1 bath592 sq ft
1126 N 198th St Unit B106, Shoreline, WA 98133
Listing provided by NWMLS as Distributed by MLS Grid
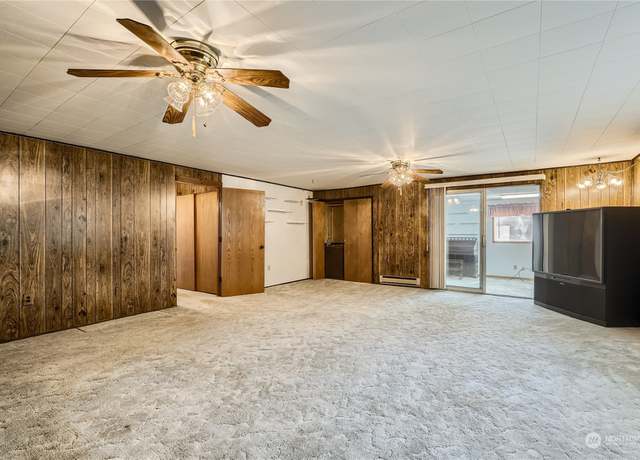
Fantastic Shoreline home with a lot to offer. Enter to find oak hardwood floors & a wood burning fireplace in the spacious living room. Updated kitchen with Quartz counters, stainless steel appliances, farm sink and great access to the deck & fully fenced back yard. Bonus 2nd living room flex space with access from kitchen or main living room. Detached 2 car garage with power, skylights, driveway parking & alley access! Bonus 2nd level 3rd bedroom or office. New exterior paint, newer roof and double pane vinyl windows.
1/31
$724,950
3 beds1 bath1,330 sq ft7,680 sq ft (lot)
15715 Burke Ave N, Shoreline, WA 98133
Listing provided by NWMLS as Distributed by MLS Grid
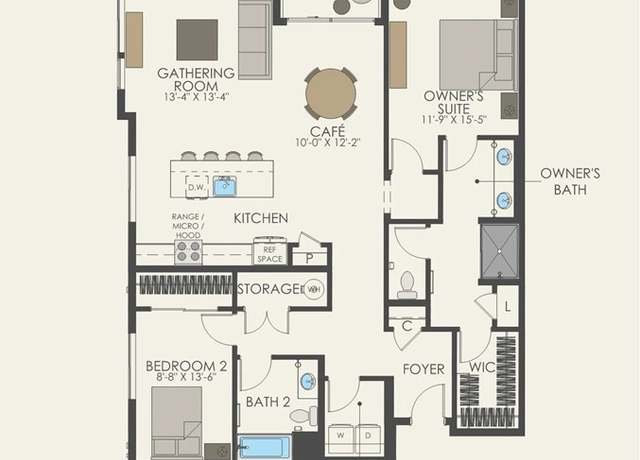
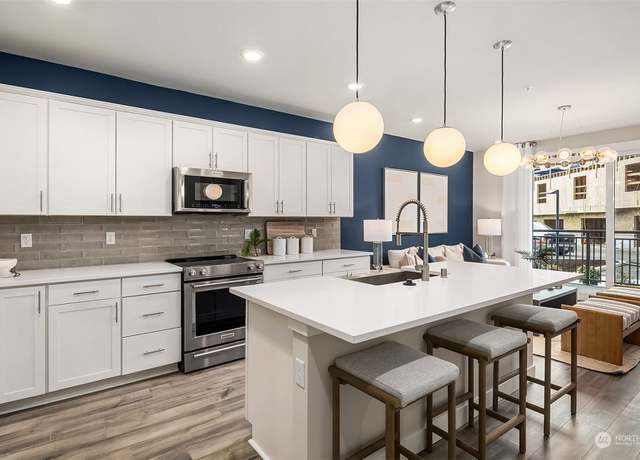
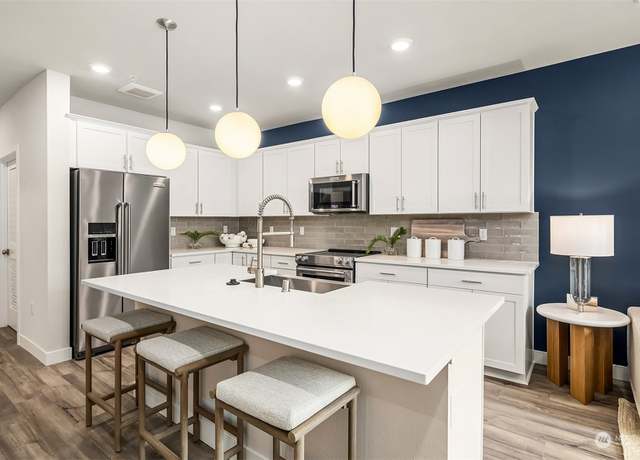
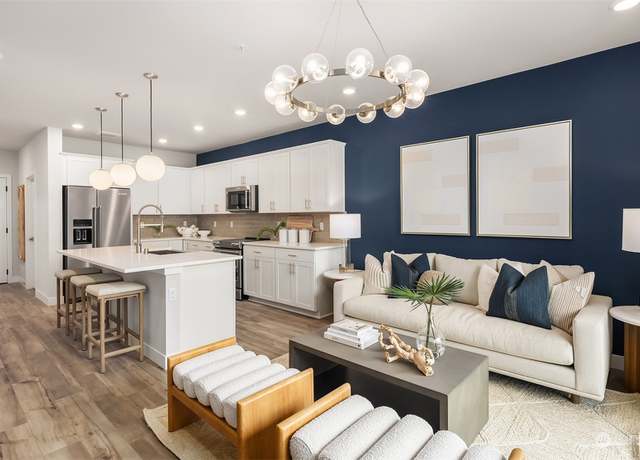
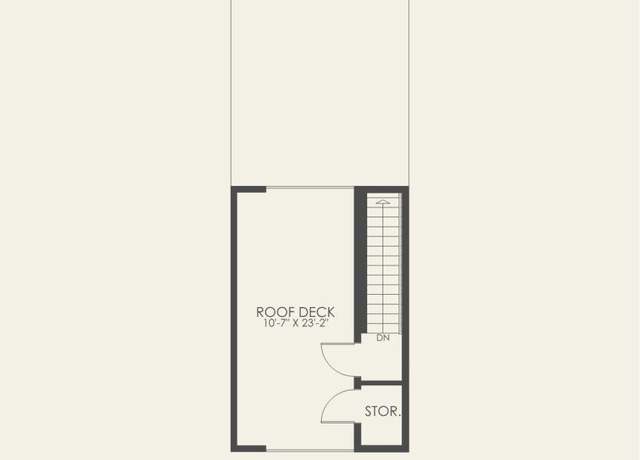
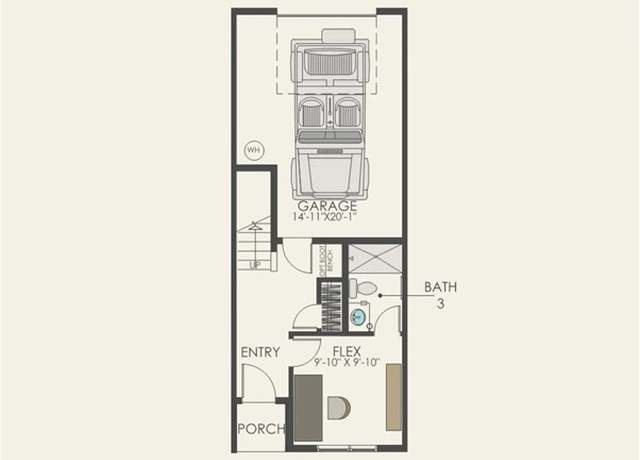
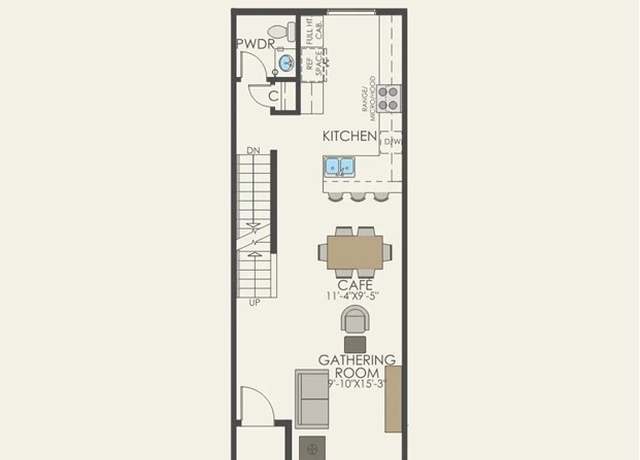
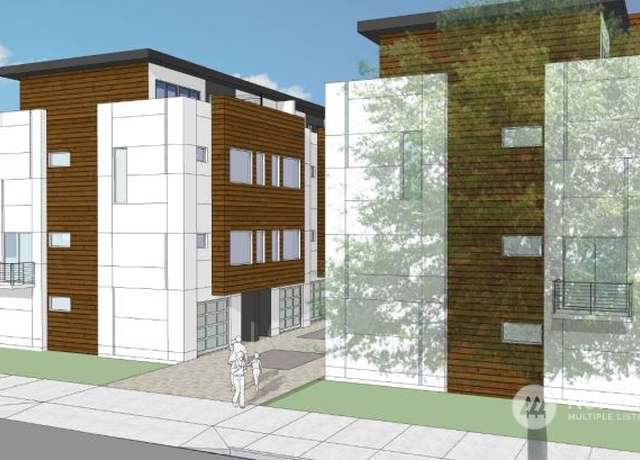
Welcome to 5 Degrees! This townhome community features modern architecture, with exceptional interior designer finishes & extensive new home warranty. Enjoy your private ROOF TOP DECK. Open-concept living space. Oversized windows to usher in the sunlight, gathering room opening up to the designer kitchen with eat-in counter space. Lower floor provides access to the two-car garage and storage space. Upper level w/ primary bdrm w/ ensuite, secondary bdrm, full bath. Walk in laundry room. Stunning interior designer package included, colors may vary from photos. Move in August/August/October or sooner. Buyer must register their broker on the first visit by completing a Guest Registration
1/30
$734,990
2 beds2.5 baths1,462 sq ft2,016 sq ft (lot)
2117 N 148th St Unit B, Shoreline, WA 98133
Listing provided by NWMLS as Distributed by MLS Grid
Discover this exceptional home amidst majestic evergreens, designed to fulfill every adults’ treehouse fantasy with sophistication. Flexible spaces on entry level seamlessly transform to create a modular floor plan adapted to your unique needs. Upstairs, an expansive entertaining area awaits, evoking a treetop retreat. Gourmet kitchen, featuring stainless appliances, open-floor dining & living area leads onto a deck enveloping lush greenery. Fenced yard w/ garden space beckons outdoor relaxation. The bright street level, with separate entrance, offers endless possibilities for creative pursuits, ideal for large artist studio, home business or multi-colleague office. Conveniently
1/32
$775,000
2 beds3 baths2,100 sq ft5,040 sq ft (lot)
20311 3rd Ave NW, Shoreline, WA 98177
Listing provided by NWMLS as Distributed by MLS Grid
Like-new 4 bedroom townhouse shines with sleek modern design and exceptional finishes throughout. This well maintained home features attached garage, open concept living area and gourmet kitchen featuring stainless, energy-efficient appliances, quartz counters and large breakfast bar. Private back deck off kitchen, generous sized bedrooms and thoughtful storage throughout add to this home's appeal. Enjoy the convenience of laundry on the top floor and comfort of mini split heating and cooling. Ample parking, EV ready and close to award winning schools, parks, restaurants and Light Rail Station. No HOA. Welcome home!
1/35
$749,900
4 beds3 baths1,742 sq ft1,117 sq ft (lot)
228 NE 180th St Unit B, Shoreline, WA 98155
Listing provided by NWMLS as Distributed by MLS Grid
DO NOT DISTURB TENANTS!!! Calling all Builders & Developers! Here's your chance to seize a golden opportunity on this 10,500 sqft MUR-45 lot! The property is currently in the final review cycle with the city and is ideally located just 2 blocks from the brand new Shoreline N185th Light Rail Station, set to launch on 8/30. With new sidewalks, roundabouts, and a new 4-way traffic signal in place, this lot primed for development. Plans are in place for 7 modern townhouses, each featuring 2 BD, a bonus room, 2.5 bathrooms, breathtaking rooftop deck, & a spacious 1-car garage, totaling 1,650 sqft of contemporary living space. Currently, the property hosts a charming 2BD single-family
1/5
$1,850,000
1 bed1 bath1,880 sq ft0.24 acre (lot)
219 NE 185th St, Shoreline, WA 98155
Listing provided by NWMLS as Distributed by MLS Grid
Value in land! Potential 7-unit development in highly desirable Shoreline. 17,039 sqft of land. (Zoned R18 x . 39 acres = 7units). Neighboring homes valued at $1.2+ mil. GREAT development potential near (0.9 miles east of) future N 145th StreetLight Rail Station. 4 bed, 2 bath house currently rents $2,750/mo. Keep home rented until development is started. Located by all major conveniences, freeway, light rail station, and award-winning Shoreline schools. Do NOT disturb tenants.
1/40
$1,200,000
4 beds2 baths1,920 sq ft0.39 acre (lot)
2342 NE 145th Street Pl, Shoreline, WA 98155
Listing provided by NWMLS as Distributed by MLS Grid
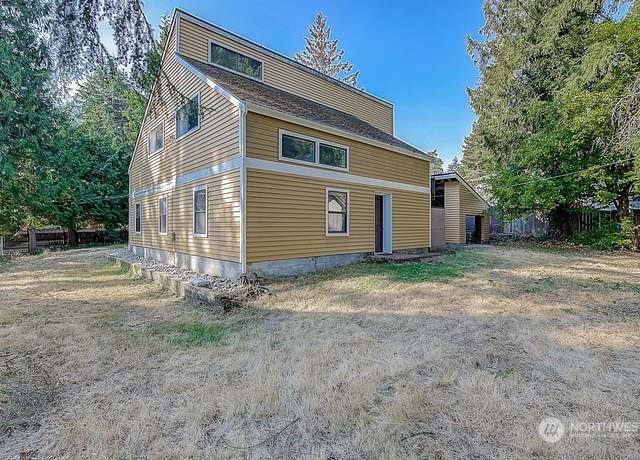
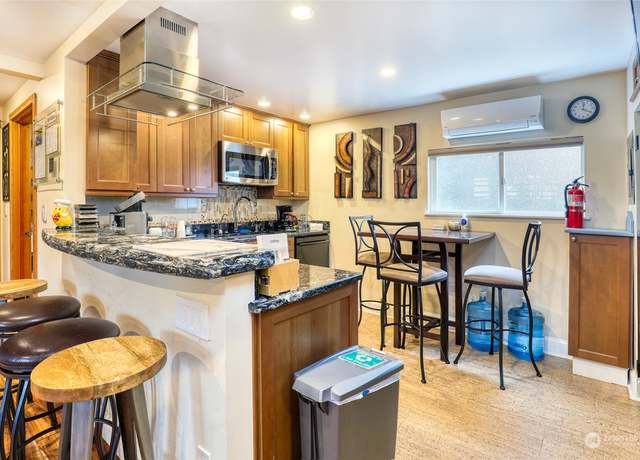
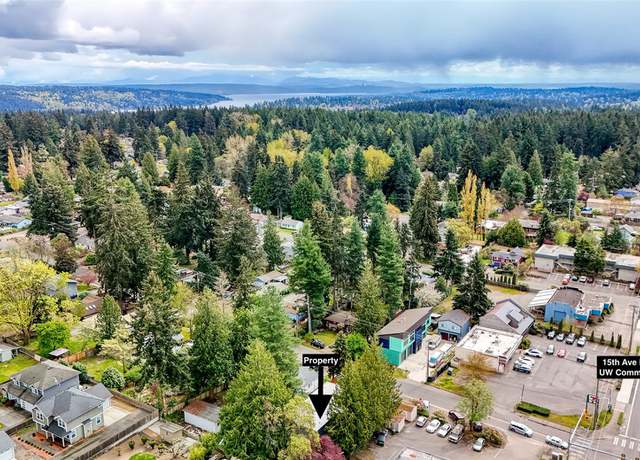
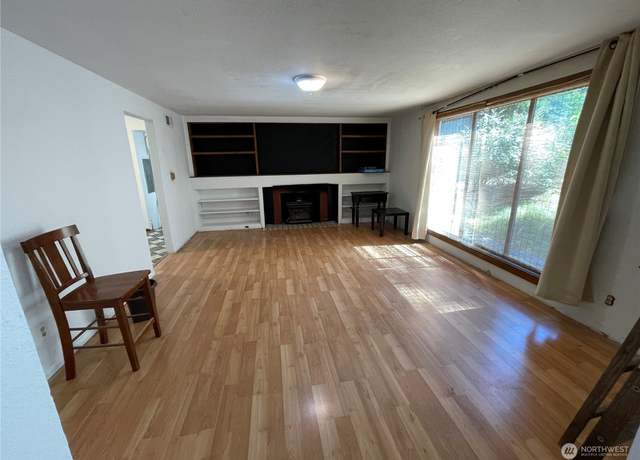
Amazing investment! This fantastic quadruplex welcomes owner occupants & landlord-investors! Effectively built 1995 and thoroughly updated by the builder/owner. Easy Light Rail access, 15th Avenue commuting to UW, and North City restaurants and shopping. Units 1 & 2 currently combined as single office unit and have luxury appointments throughout. Also, a pellet stove, mini-split, in-floor heating, low voltage panel w/ rack system and lots of high-speed cabling. Space for a 2nd kitchen available in Unit 2. Two upper floor residential units (unit 3 updated), outbuilding storage with security, Nat Gas Generator, Tankless Hot Water Htr, decks, patio, bike rack, 12 tandem parking spa
1/34
$1,555,000
8 beds4 baths3,183 sq ft9,086 sq ft (lot)
1510 NE 170th St, Shoreline, WA 98155
Listing provided by NWMLS as Distributed by MLS Grid
Attention Developers, rare 13,560 SF redevelopment property in Shoreline. Currently improved with a 1946 site-built 3-bed, 1-bath house. Demo and start fresh, or rehab the house and potentially add an ADU in the huge backyard. Currently, a friend of the family is occupying the property and will vacate at closing. Please do not disturb occupant, drive-by okay. Buyer has option to join community club w/ park and tennis court, $250 annually. Approx. 1 block to new Shoreline Place a mixed-use development and the Town and Country Market. Short distance to transit with easy access to I5 and Highway 99.
1/17
$600,000
3 beds1 bath1,290 sq ft0.31 acre (lot)
806 N 153rd Pl, Shoreline, WA 98133
Listing provided by NWMLS as Distributed by MLS Grid
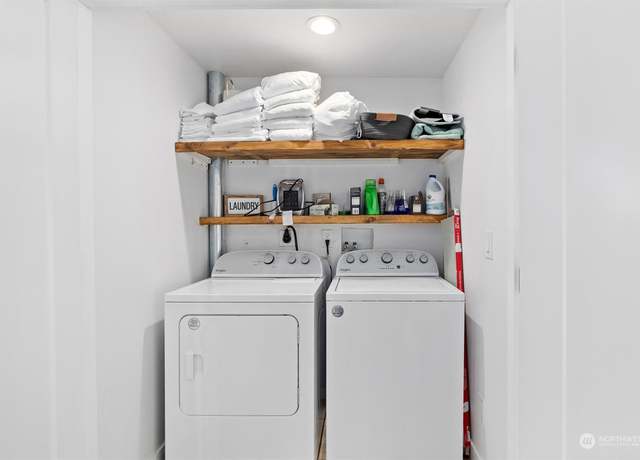
Welcome to an extraordinary find in North Seattle! This rarely available large rambler home boasts a spacious open floor plan, perfect for modern living and entertaining. Expansive kitchen with vast quartz counters offering ample space for culinary creations. Retreat to the primary bedroom, complete with its own en-suite bathroom for added comfort and convenience. With modern updates throughout and a total of 4 bedrooms, this home exudes both style and functionality. Outside, explore the potential for a DADU in the back offering endless possibilities. Located in the vibrant Bitter Lake neighborhood, this home is a true gem blending comfort, convenience, and endless potential. Don't miss the
1/35
$979,000
4 beds3 baths1,989 sq ft8,540 sq ft (lot)
14327 Fremont Ave N, Seattle, WA 98113
Listing provided by NWMLS as Distributed by MLS Grid
Back on Market 16,877 sq ft on 2 adjoining R48 lots with 2 RENTAL HOMES INCOME & Great Tenants. * Zoned R48 for 14+ Townhome/19 flats Site * (w/ 50' height limit) See MF Renderings. "XLNT OPPTY for Future Builder Resale or DEVELOPE/ BUILD yourself" -Why not get appreciation on approx $11 million in retail sales rather than the just the current value? Great 1031 Replacement property. NEAR LIGHT RAIL. Lots 14514 & 14520 31st Ave NE) are being sold together for $2,300,000. Best comps MLS #1555771- small 6 unit site sold in 2020 for $1mil & our previous failed sale. Drive by ok, PLEASE DO NOT GET OUT OF CAR OR DISTURB TENANTS. MOTIVATED SELLER. Taxes and Lot sq foot
1/14
$2,300,000
2 beds1 bath720 sq ft0.39 acre (lot)
14520 31st Ave NE, Shoreline, WA 98155
Listing provided by NWMLS as Distributed by MLS Grid
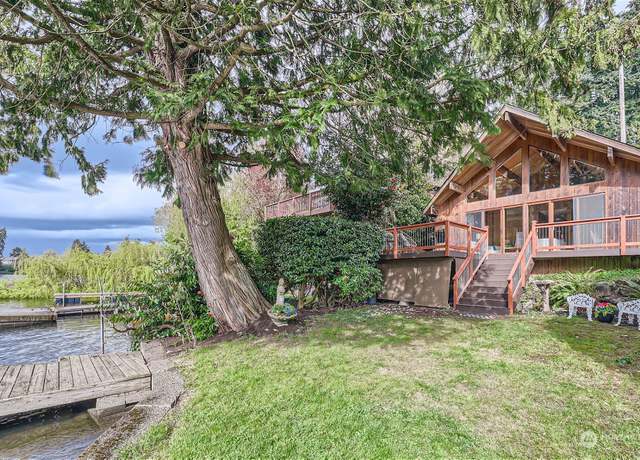
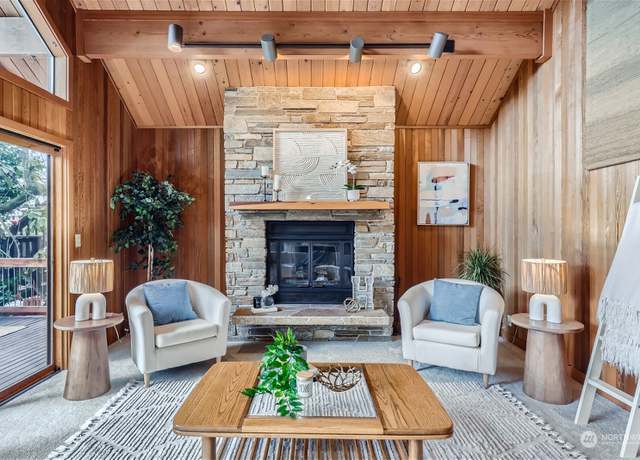
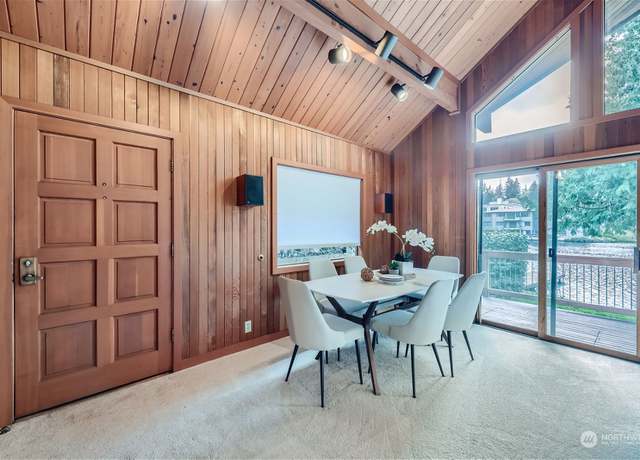
Your lakeside paradise awaits! Nestled on the shores of Echo Lake. Charming A-Frame 2 bdrm 2 bth home offers a rare opportunity to own a piece of waterfront heaven. Enjoy your own beachfront & private dock, perfect for boating, fishing, & swimming. The home features dramatic vaulted ceilings, a stone fireplace with a mahogany mantle and floor-to-ceiling window wall w/ beautiful lake views from the living room, dining room and kitchen. Step out onto the spacious deck, ideal for entertaining or simply relaxing in the tranquil surroundings. Lovely primary suite with large closet and 3/4 bath. Minutes to I-5, light-rail, transit center, interurban trail, shopping, restaurants. Don&rs
1/29
$799,990
2 beds2 baths1,180 sq ft3,010 sq ft (lot)
19275 Stone Ave N, Shoreline, WA 98133
Listing provided by NWMLS as Distributed by MLS Grid
Newly updated 1 bed 1 bath 1st floor unit condo at Forest Villa in Shoreline. New LVP flooring throughout (except bedroom) & completely re-painted. New vanity & flooring in bath + re-glazed tub. Living room w/ lovely wood fireplace plus balcony access. Generously sized bedroom w/ large closet. In-unit washer & dryer for your convenience. Secured building w/ lobby & elevator, sport court, plus secure parking w/ a reserved space in gated common garage. Additional storage available on east facing private balcony. Plenty of guest parking. HOA dues include W/ S/G. Great central location near shopping, grocery stores, Shoreline Community College, restaurants, schools, and
1/37
$339,999
1 bed1 bath580 sq ft
700 N 160th St Unit A101, Shoreline, WA 98133
Listing provided by NWMLS as Distributed by MLS Grid
Discover your oasis just blocks away from the N 145th Street Light Rail station, with easy access to I-5 and Hwy 99. Embrace the convenience: with gyms, shopping, and prestigious Lakeside private schools K-12 nearby. You will find 5 spacious bedrooms, 3 baths, a modern open kitchen boasting stainless steel appliances and elegant quartz countertops, a dedicated laundry room with cutting-edge washer/dryer, a spacious garage, recently replaced roof and tranquil-fenced private yard. Unwind by the charming fireplace, entertain on the BBQ deck, indulge in gardening in the expansive backyard, or have fun in the recreation room complete with a wet bar. Experience comfort and convenience in this cap
1/31
$1,174,950
5 beds3 baths2,430 sq ft5,250 sq ft (lot)
14323 Meridian Ave N, Seattle, WA 98133
Listing provided by NWMLS as Distributed by MLS Grid
Enjoy an open concept floorplan with 2 bedrooms, 2 bath, private balcony and luxury finishes. The large kitchen with tons of cabinet space, large windows boasting lots of natural light, and an Owner's suite with a walk-in closet. It can't get much better than this! Condo living allows for a low-maintenance lifestyle with an elevator, landscaped grounds and quick access to restaurants, supermarkets, bars and more nearby! Also enjoy a feeling of security with secured building and underground parking access (for purchase). Delivery date to be late spring, 2024. Buyer must register their broker on the first visit by completing a Guest Registration Form. Taxes not yet assessed. Underground parki
1/6
$712,472
2 beds2 baths1,487 sq ft
14598 Westminster Way N #201, Shoreline, WA 98133
Listing provided by NWMLS as Distributed by MLS Grid
Enjoy an open concept floorplan with 2 bedrooms, 2 bath, private balcony and luxury finishes. The large kitchen with tons of cabinet space, large windows boasting lots of natural light, and an Owner's suite with a walk-in closet. It can't get much better than this! Condo living allows for a low-maintenance lifestyle with an elevator, landscaped grounds and quick access to restaurants, supermarkets, bars and more nearby! Also enjoy a feeling of security with secured building and underground parking access (for purchase). Delivery date to be late spring, 2024. Buyer must register their broker on the first visit by completing a Guest Registration Form. Taxes not yet assessed. Underground parki
1/6
$721,747
2 beds2 baths1,487 sq ft
14598 Westminster Way N #211, Shoreline, WA 98133
Listing provided by NWMLS as Distributed by MLS Grid
Enjoy an open concept floorplan with 2 bedrooms, 2 bath, private balcony and luxury finishes. The large kitchen with tons of cabinet space, large windows boasting lots of natural light, and an Owner's suite with a walk-in closet. It can't get much better than this! Condo living allows for a low-maintenance lifestyle with an elevator, landscaped grounds and quick access to restaurants, supermarkets, bars and more nearby! Also enjoy a feeling of security with secured building and underground parking access (for purchase). Delivery date to be late spring, 2024. Buyer must register their broker on the first visit by completing a Guest Registration Form. Taxes not yet assessed. Underground parki
1/6
$740,985
2 beds2 baths1,487 sq ft
14598 Westminster Way N #101, Shoreline, WA 98133
Listing provided by NWMLS as Distributed by MLS Grid
Condo new construction! Enjoy 955 sf of luxury! Features include an open concept living room/kitchen with quartz island, NO CARPET, KitchenAid appliances, spacious primary suite with walk-in closet and luxury bath, flex space with privacy french doors, large laundry/utility room with washer and dryer. Located within a modern, secure, elevator building. Enjoy the abundance of natural light along with your private balcony. Conveniently located in Shoreline with easy access to downtown, shopping and restaurants. Home complete late summer. Buyer must register their broker on the first visit by completing a Guest Registration Card. Taxes not yet assessed. Garage parking available for purchase.
1/12
$598,196
1 bed1 bath955 sq ft
14598 Westminster Way N #406, Shoreline, WA 98133
Listing provided by NWMLS as Distributed by MLS Grid
Condo new construction! Enjoy 1,1186 sf with 2 bedrooms / 2 full baths plus a living room and an office/den. Features include an open concept living room/kitchen with quartz island, NO CARPET, KitchenAid appliances, spacious primary suite with walk-in closet and luxury bath, 2nd bedroom with full bath, laundry/utility room with washer and dryer. Located within a modern, secure, elevator building. Enjoy the abundance of natural light along with your private balcony. Conveniently located in Shoreline with easy access to downtown, shopping and restaurants. Home complete late summer. Buyer must register their broker on the first visit by completing a Guest Registration Card. Taxes not yet asses
1/5
$667,418
2 beds2 baths1,186 sq ft
14598 Westminster Way N #404, Shoreline, WA 98133
Listing provided by NWMLS as Distributed by MLS Grid
Corner lot home features 4 bedrooms, 2.5 baths, 1 car attached garage. Mature trees and fully fenced yard. Situated near schools, bus lines, and amenities. There are two fireplaces, a large main room and primary bedroom suite with clawfoot tub and separate shower on the second floor. Large deck for entertaining and gatherings. U[pgraded bathrooms and French doors to deck.
1/23
$889,920
4 beds2.5 baths2,160 sq ft6,996 sq ft (lot)
1504 NE 166th St, Shoreline, WA 98155
Listing provided by NWMLS as Distributed by MLS Grid
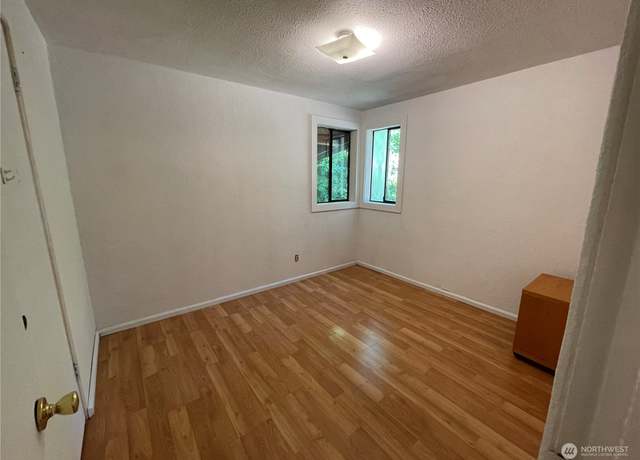
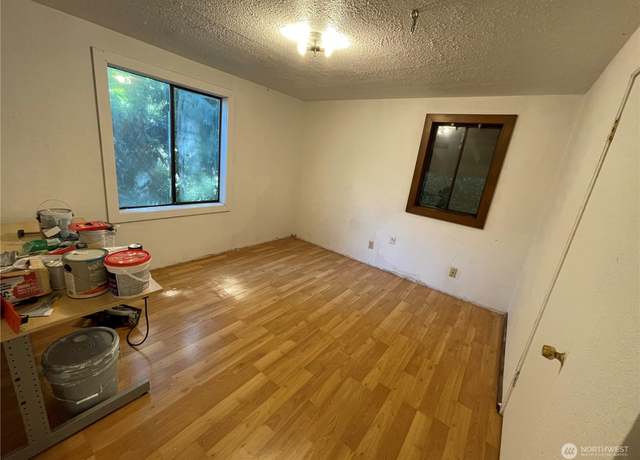
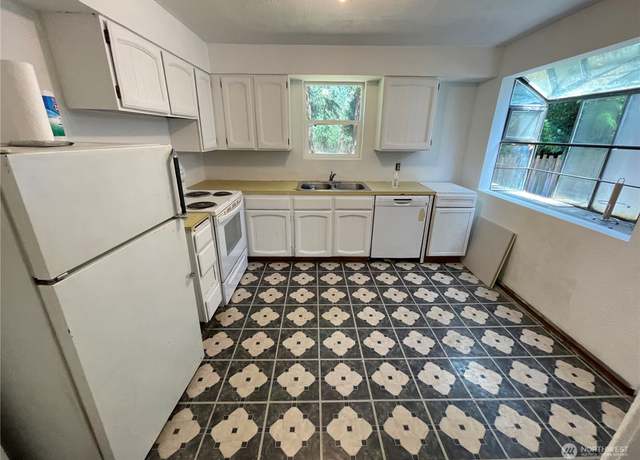
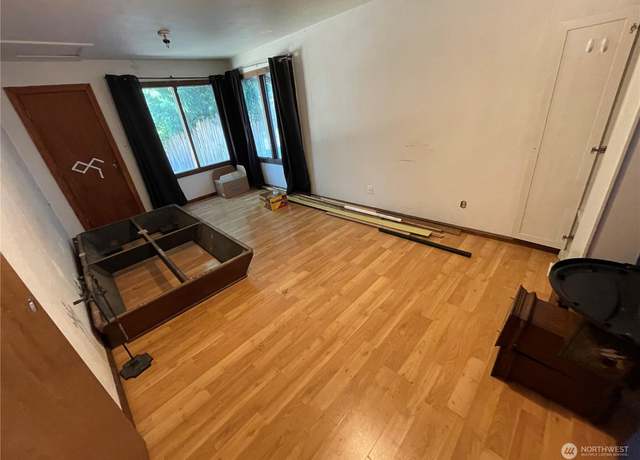
First time on market in 54 years! Location Location Location!!! Prime location which is close to light rail, I-5, Lake Washington. Although a 2 Bed 1 bath there is plenty of room to get creative and add additional rooms. Large lot has RV / Boat parking, RV Dump, nice grassy yard and room for a garden.
1/28
$825,000
2 beds1 bath1,740 sq ft8,160 sq ft (lot)
17835 24 Pl NE, Shoreline, WA 98155
Listing provided by NWMLS as Distributed by MLS Grid
BOLD PRICE CORRECTION! Well. .. a girl's gotta try! Here's your chance to land yourself a home in coveted Innis Arden w/ protected Sound & mountain views & buried power lines. .. affordable price for IA! Grab it! The SW windows & west facing deck allow for endless hours of storm watching, sunsets, cargo ships, cruise-liners, sailing regattas. .. you will never be bored in this NW paradise! Abundant natural light drenches the main living areas. In good condition w/ room to customize with your personal touches over time. Lush backyard is a natural oasis. 2 built-out offices w/ murphy beds allow for flexible uses. Condo alternative, no shared walls! Floorplan allows for poten
1/36
$1,600,000
4 beds2 baths2,320 sq ft0.57 acre (lot)
1250 NW 175th St, Shoreline, WA 98177
Listing provided by NWMLS as Distributed by MLS Grid
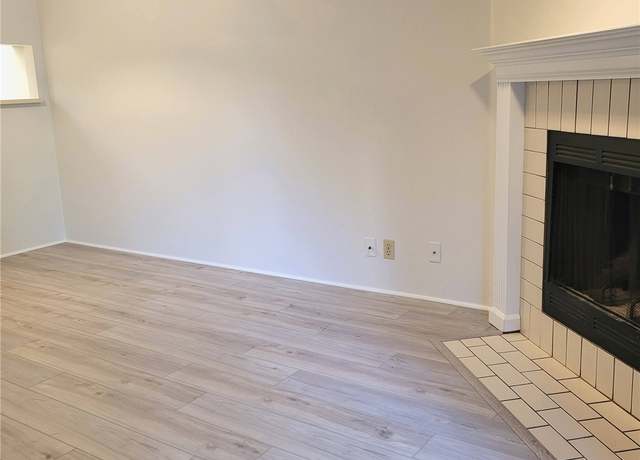
It sounds like you've found quite a gem in Shoreline! This updated rambler with its charming features like refinished hardwood floors and a newer kitchen is a delight to walk into. And with a fully fenced backyard boasting mature landscaping and a greenhouse, it's like having your own little oasis right at home. Plus, an expansive deck for entertaining friends adds to the appeal. The location offers the best of both worlds: close proximity to amenities like Shoreline Community College, Shorewood Park, and Shorewood High School, while also being conveniently situated for the new light rail, making commuting a breeze. It is a wonderful place to call home!
1/24
$650,000
2 beds1 bath870 sq ft6,857 sq ft (lot)
16742 Linden Ave N, Shoreline, WA 98133
Listing provided by NWMLS as Distributed by MLS Grid
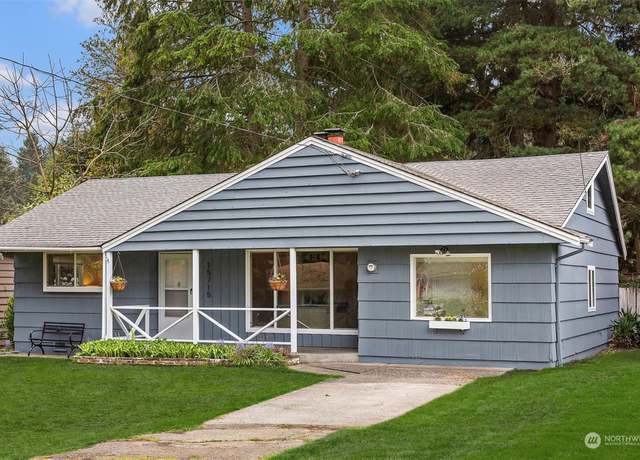
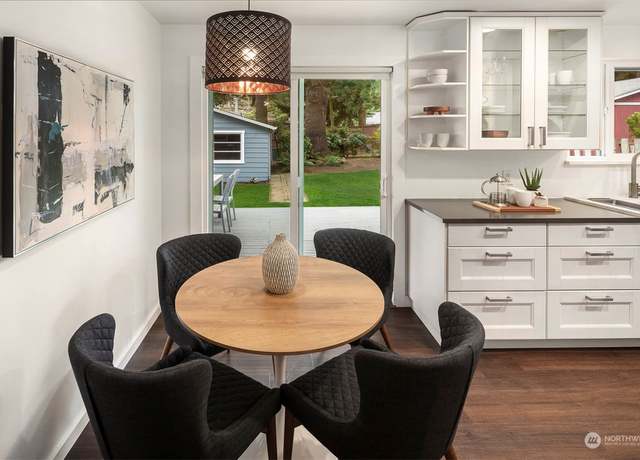
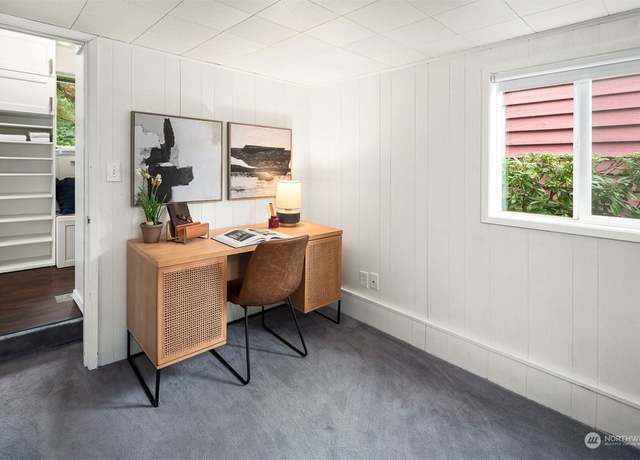
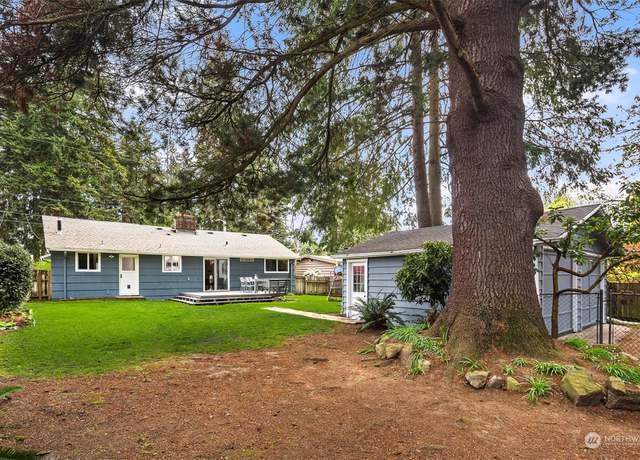
Welcome to this charming and generously-sized brick rambler nestled in a picturesque Shoreline neighborhood. Inside, you'll find hardwood floors throughout the open living and dining room that seamlessly connects to the kitchen with an eat-in area. Two generous bedrooms with hardwood floors share a full bath. 3rd room can be a primary bedroom with en suite ¾ bath or double as a family room with its wood burning stove. A separate utility room adds convenience, while the garage and carport provide ample parking options. With RV parking available, this home caters to all your needs. New roof in 2022! Enjoy easy access to transportation, I-5, shopping centers, and the acclaimed Shoreline
1/24
$749,995
3 beds2 baths1,730 sq ft5,603 sq ft (lot)
137 N 200th St, Shoreline, WA 98133
Listing provided by NWMLS as Distributed by MLS Grid
Your turn key home is here! Highly sought after Shoreline modern 2 story. .. .Prepared to be wowed upon the grand 2 story entrance you will find a circular floor plan featuring a chefs style kitchen w/ island, double ovens, gas range & Abundant of cabinets & countertops all overlooking your perfect family room with eating space. Huge dining & living room with high ceiling & gas fireplace. Upstairs you will find your spacious master suite with a 5 piece bath & walk in closet. Along with 2 more bedrooms & full bath. Cap the perfect evening on your west facing deck with new lawn, creating a serene oasis. New outbuilding for storage or a studio & 2 car
1/23
$1,195,000
3 beds2.5 baths2,950 sq ft8,110 sq ft (lot)
20121 Fremont Ave N, Shoreline, WA 98133
Listing provided by NWMLS as Distributed by MLS Grid
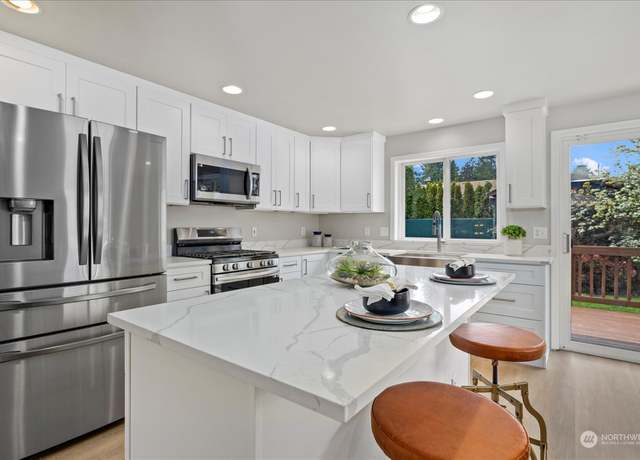
This 3-bedroom 2-bathroom home in Shoreline is a standout property, with its completely remodeled exterior and interior features. New metal roof, gutters, siding, windows, and doors. The kitchen features shaker cabinetry, quartz countertops, flooring, lighting, and appliances. The ample off-street parking can store a large RV, boat, or a few cars. This property has a large detached storage shed that can serve as an art studio, shop, office, playroom, or for future finished space or DADU potential. Exceptional schools are a stone's throw. The Briarcrest park with a new water spraying playground for all to enjoy-coming soon. The seller has included a 1-yr EXTENDED HOME WARRANTY on structure,
1/23
$797,777
3 beds2 baths1,260 sq ft8,150 sq ft (lot)
15529 26th Ave NE, Shoreline, WA 98155
Listing provided by NWMLS as Distributed by MLS Grid
Welcome to 358 Degrees by Pulte Homes! This community is close proximity to top schools, fun restaurants, shopping & recreation. The 16.03 floor plan boasts 1st floor bedroom w/ ensuite bath; main level great room open to entertainer's kitchen w/ bar seating, abundance of cabinet space, and large balcony. Upper-level features gracious primary suite w/ vaulted ceilings, upscale bath & large walk-in closet. Perfect secondary bedroom, full bath and laundry room complete the space. Bright white cabinetry, matte black fixtures, luxury vinyl plank flooring, dual mini splits. Buyer must register their broker on the first visit by completing a Guest Registration Card. All pictures are o
1/21
$728,571
3 beds3.5 baths1,574 sq ft
14542 Westminster Way N, Shoreline, WA 98133
Listing provided by NWMLS as Distributed by MLS Grid
Welcome to 358 Degrees by Pulte Homes! This community is close proximity to top schools, fun restaurants, shopping & recreation. The 16.03 floor plan boasts 1st floor bedroom w/ ensuite bath; main level great room open to entertainer's kitchen w/ bar seating, abundance of cabinet space, and large balcony. Upper-level features gracious primary suite w/ vaulted ceilings, upscale bath & large walk-in closet. Perfect secondary bedroom, full bath and laundry room complete the space. Bright white cabinetry, matte black fixtures, luxury vinyl plank flooring, dual mini splits. Buyer must register their broker on the first visit by completing a Guest Registration Card. All pictures are o
1/21
$728,021
3 beds3.5 baths1,574 sq ft
14540 Westminster Way N, Shoreline, WA 98133
Listing provided by NWMLS as Distributed by MLS Grid
Tranquility base has landed. Beautiful Shoreline home well located for shopping and commuting. Move in ready. New carpet. Apply your own vision about how you want the property to develop with the existing house or whatever could be next on the lot. Edmonds, Shoreline, Lynnwood, Costco all so close. Transit options with the Aurora Village Transit Center just blocks away. Driving commute with easy access to I-5, I-405, Hwy 99. Back half of lot might support a DADU. Buyer to confirm to own satisfaction if DADU is a possibility.
1/27
$499,000
2 beds1 bath850 sq ft5,400 sq ft (lot)
19920 Linden Ave N, Shoreline, WA 98133
Listing provided by NWMLS as Distributed by MLS Grid
Stunning new Shoreline home offers 8 bedrooms (!) and 4 full baths! Setup perfectly for use an an Airbnb OR Mid-Term Rental, with tons of flexibility in an inviting, liveable layout. 6 Bedrooms upstairs with three full baths, tons of natural light, all LVP floors and high-end bath and kitchen fixtures. Quartz countertops and backsplashes, mirrors with lighting effects in baths, TONS of cabinet space in the kitchen, all stainless appliances, ductless Mini-Splits in EACH bedroom. State of the art electric service panel with GFI's throughout the home, interior fire/sprinkler system, coded entry for each bedroom. This home is setup to produce income and allow for maximum flexibility! Superb loc
1/35
$1,700,000
8 beds4 baths3,700 sq ft3,602 sq ft (lot)
515 N 155th St, Shoreline, WA 98133
Listing provided by NWMLS as Distributed by MLS Grid
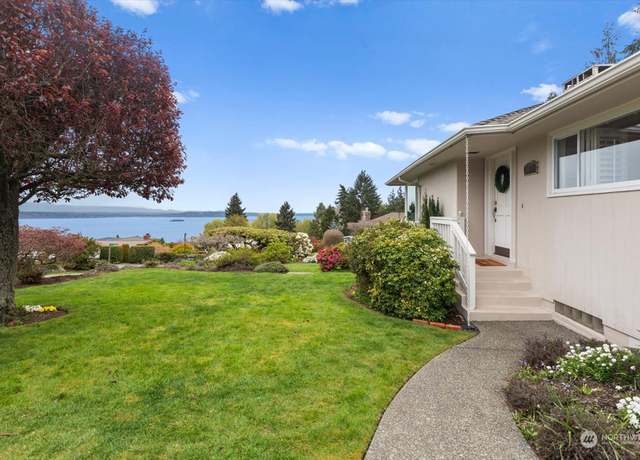
Beautiful, custom home with Olympic Mountain and Puget Sound views from almost every room. This extensively remodeled home includes a kitchen with professional Sub-Zero/Wolf appliances and walk in pantry, 3 upstairs bedrooms with en-suite baths, a separate office and family room. This beach house promotes indoor and outdoor living with an abundance of natural light, multiple decks/patios and manicured yard space with artificial turf. Expansive unfinished daylight basement with roughed-in bath, potentially a MIL apartment, home business space, private gym, recreation room, or movie theater. Walking distance to 3 parks, beaches, coffee shop, restaurants, Richmond Beach library and the Cabin
1/40
$1,895,000
4 beds3.5 baths3,760 sq ft5,400 sq ft (lot)
19494 Richmond Beach Dr NW, Shoreline, WA 98177
Listing provided by NWMLS as Distributed by MLS Grid
Welcome to this secluded home in Shoreline a hub of convenience to downtown Seattle with the link light rail. This gated sanctuary greets you at this unique home surrounded by nature, privacy and solitude yet minutes from everything and the upcoming light rail. Family room, laundry room, office (or bedroom. ) Freshly painted. Huge rec room is a blank slate for your vision with endless possibilities. The flag lot on the right is also being conveyed in the sale. Bring your vision and even look to expand on this already great property by adding bath/shower, completely enclosed 2 car garage and ADU. This move in ready home has lots of possibilities.
1/27
$750,000
4 beds1.5 baths1,920 sq ft0.31 acre (lot)
20043 12th Ave NE, Shoreline, WA 98155
Listing provided by NWMLS as Distributed by MLS Grid
Enjoy an open concept floorplan with 2 bedrooms, 2 bath, view of greenspace from balcony, and a flex room. The large kitchen with tons of cabinet space, large windows boasting lots of natural light, an Owner's suite with a walk-in closet, and your own private balcony. It can't get much better than this! Condo living allows for a low-maintenance lifestyle with an elevator, landscaped grounds and quick access to restaurants, supermarkets, bars and more nearby! Also enjoy a feeling of security with secured building and underground parking access. Delivery date to be late spring, 2024. Buyer must register their broker on the first visit by completing a Guest Registration Form. Taxes not yet ass
1/14
$662,982
2 beds2 baths1,332 sq ft
14598 Westminster Way N #309, Shoreline, WA 98133
Listing provided by NWMLS as Distributed by MLS Grid
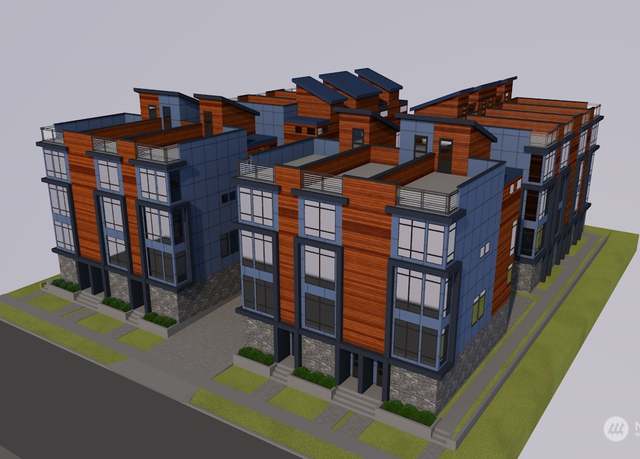
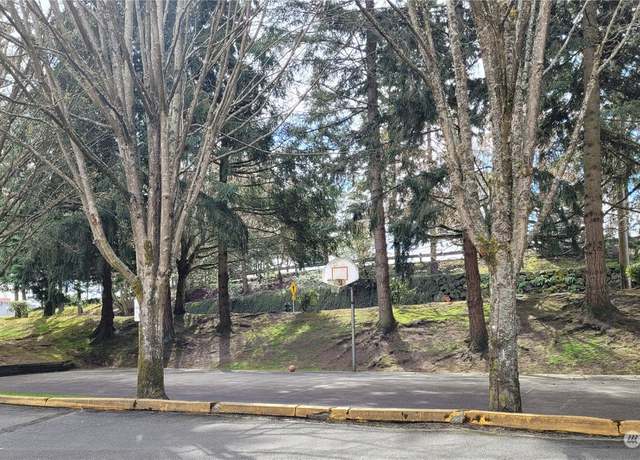
Builder alert! Value on the land. Situated near the picturesque Interurban bike trail and conveniently close to the future light rail station anticipated to open in 2024, these proposed 12 unit townhouses are poised to offer modern living in the heart of Shoreline. Each unit boasts 3 bedrooms, 3 bathrooms, and a spacious 2-car garage, totaling 2770 sqft of contemporary living space. The current lot has two charming 3BD single-family houses, providing an opportunity to generate rental income while awaiting final approvals for new construction. Don't miss this chance to invest in a thriving community with access to both urban amenities and natural beauty. The listing includes both parcels of
1/7
$2,750,000
3 beds1 bath2,120 sq ft0.37 acre (lot)
14545 Whitman Ave N, Shoreline, WA 98133
Listing provided by NWMLS as Distributed by MLS Grid
Charming mid-century home with open concept layout + exquisite renovations throughout. Interior spaces are bright with a stylish + modern color palette. Two living areas are accented by inviting fireplaces. Stunning kitchen features tasteful quartz counters, striking white cabinets + stainless appliances. Private primary bedroom with ensuite. Two full baths are expertly updated. Fantastic outdoor space with fenced + terraced backyard. Patio provides ideal spot for entertaining in warmer months. Towering trees create idyllic + secluded natural setting. Recent electrical, plumbing, roof + A/C. Located in highly regarded Shoreline School District, near major commuter routes, dining + parks.
1/34
$949,900
3 beds2 baths1,780 sq ft8,375 sq ft (lot)
20121 7th Ave NE, Shoreline, WA 98155
Listing provided by NWMLS as Distributed by MLS Grid
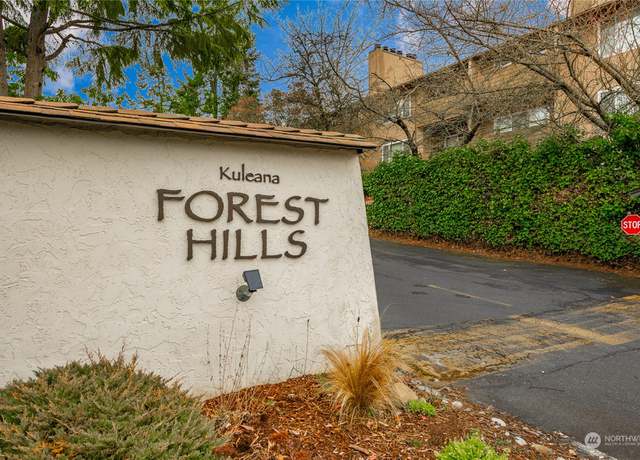
Welcome to Kuleana's Forest Hills, a hidden treasure near North City. This tastefully update unit has great room concept with expansive windows in the LR provide ample of natural light. Access your own private deck through the sliders from the LR to enjoy your territorial views. Updated kitchen has eating area & open to the DR. You get privacy w/ no building behind you in the great rm area & primary bdrm upstairs. Spacious primary bdrm w/ walk-in closet & bth. Not only do you get a 2-car garage, it is also attached! Extra rm downstairs on the garage level for office, exercise or movie room. Upgraded electrical w/ enough room for EV charger. All apps stay, upstairs laundry
1/38
$499,995
2 beds1.5 baths1,369 sq ft
1723 NE 179th St Unit D8, Shoreline, WA 98155
Listing provided by NWMLS as Distributed by MLS Grid
Based on information submitted to the MLS GRID as of Thu Apr 18 2024. All data is obtained from various sources and may not have been verified by broker or MLS GRID. Supplied Open House Information is subject to change without notice. All information should be independently reviewed and verified for accuracy. Properties may or may not be listed by the office/agent presenting the information. Some IDX listings have been excluded from this website.
This area's enrollment policy is not based solely on geography. Please check the school district website for more information.
Elementary schools
Middle schools
High schools
GreatSchools Summary Rating
9/10
Meridian Park Elementary School
Public, K-5
9/10
Aldercrest Annex Home Exchange
Public, K-8 • Choice school
8/10
Briarcrest Elementary School
Public, K-5
8/10
Parkwood Elementary School
Public, K-5
7/10
Cascade K-8 Community School
Public, K-8 • Choice school
Only showing 5 of
12 elementary schools.
School data is provided by GreatSchools, a nonprofit organization. Redfin recommends buyers and renters use GreatSchools information and ratings as a first step, and conduct their own investigation to determine their desired schools or school districts, including by contacting and visiting the schools themselves.Redfin does not endorse or guarantee this information. School service boundaries are intended to be used as a reference only; they may change and are not guaranteed to be accurate. To verify school enrollment eligibility, contact the school district directly.
Homes for sale in Shoreline have a median listing price of $775K. Some of these homes are Hot Homes, meaning they're likely to sell quickly.
What are some of the most popular neighborhoods in Shoreline?
Popular neighborhoods include Hillwood, North City, Northgate, Madrona, Richmond Beach, Richmond Highlands, Ridgecrest, Broadview, Haller Lake, and Bitter Lake.
Shoreline, Washington boasts a well-structured transportation system with several modes of travel. The city is served by King County Metro and Sound Transit, providing public transportation options for residents. For those who prefer driving, traffic levels can vary, with peak hours often seeing higher congestion. Additionally, Shoreline is conveniently located near Interstate 5, offering easy access to major highways for car users. Learn more on our Shoreline city guide.
What types of properties are available in Shoreline?
Shoreline, Washington offers a variety of single-family home types, including ranch-style homes, split-level homes, and contemporary homes, among others. These homes can be found throughout Shoreline, Washington, with ranch-style homes typically built in the 1950s and 1960s, split-level homes built in the 1970s and 1980s, and contemporary homes built in recent years. To explore different property types for sale in Shoreline, Washington, use the 'Home type' filter located above the active listings. Customize your search by selecting options like single-family homes, condos, townhomes, and more.
What is life like in Shoreline?
Shoreline, Washington offers a unique living experience with its picturesque landscape that includes stunning views of the Puget Sound and surrounding mountains. The region experiences a mild climate with cool, wet winters and warm, dry summers. Job opportunities are abundant, with a variety of industries thriving in the area, including technology, healthcare, and education. Residents can enjoy a wide range of activities, such as exploring the numerous parks and trails, engaging in water sports, and participating in local community events and festivals. The city also boasts a vibrant arts and culture scene, with plenty of opportunities to explore and support local artists and performers.
What are the schools and amenities like in Shoreline?
Shoreline, Washington is a city rich in public amenities that enhance the quality of life for its residents. The city boasts an array of restaurants offering diverse culinary experiences. Numerous parks are scattered throughout the city, providing open spaces for relaxation and recreation. Grocery stores are conveniently located, ensuring easy access to daily necessities. Additional amenities such as libraries, fitness centers, and educational institutions are also readily available to all residents.
In the past month, 53 homes have been sold in Shoreline. In addition to houses in Shoreline, there were also 19 condos, 23 townhouses, and 2 multi-family units for sale in Shoreline last month. Shoreline is a moderately walkable city in King County with a Walk Score of 50. Shoreline is home to approximately 52,179 people and 16,984 jobs. Find your dream home in Shoreline using the tools above. Use filters to narrow your search by price, square feet, beds, and baths to find homes that fit your criteria. Our top-rated real estate agents in Shoreline are local experts and are ready to answer your questions about properties, neighborhoods, schools, and the newest listings for sale in Shoreline. Our Shoreline real estate stats and trends will give you more information about home buying and selling trends in Shoreline. If you're looking to sell your home in the Shoreline area, our listing agents can help you get the best price. Redfin is redefining real estate and the home buying process in Shoreline with industry-leading technology, full-service agents, and lower fees that provide a better value for Redfin buyers and sellers.


 REDFIN IS COMMITTED TO AND ABIDES BY THE FAIR HOUSING ACT AND EQUAL OPPORTUNITY ACT. READ REDFIN'S FAIR HOUSING POLICY AND THE NEW YORK STATE FAIR HOUSING NOTICE.
 United States
 Canada