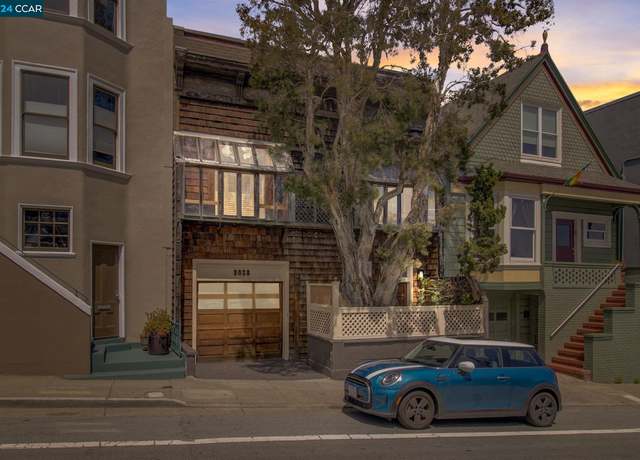
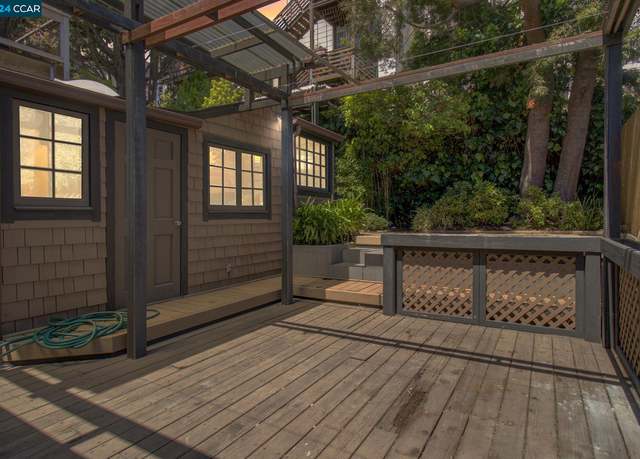
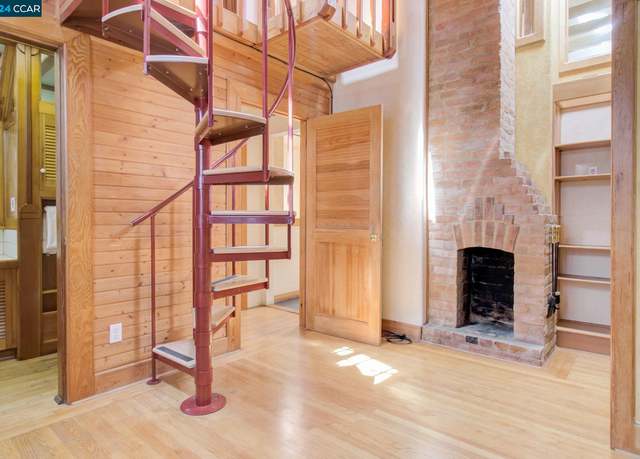
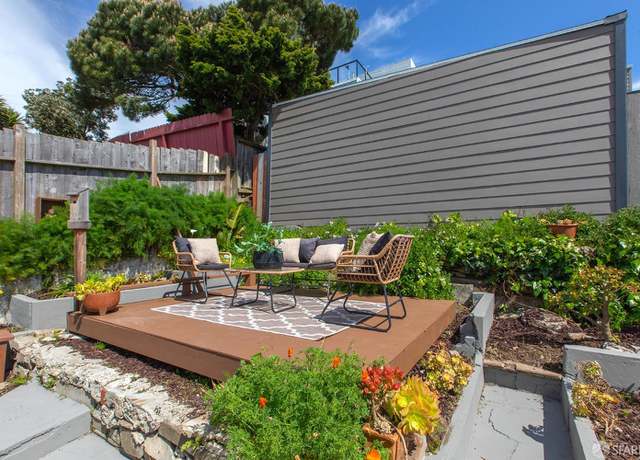
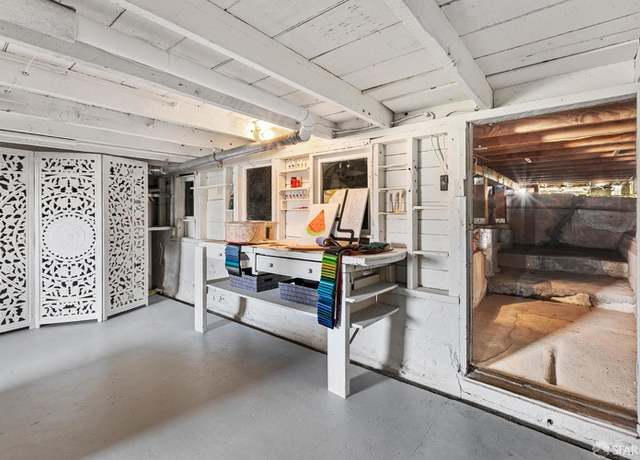
JUMP ON THIS ONE! Great single family home near the upper Castro featuring three bedrooms, loft, unfinished basement space including an attached garage. Front door has private gated entry. Owner has created a truly unique, one-of-a-kind space replete with copious hand cut woodwork rooms, storage and finishes! Garage has small custom work space and automatic garage door opener. A portion of the living space is an attached studio in back with a seperate entrance which has income generating potential. The backyard is a sweet oasis with complete privacy, multiple deck areas and mature landscape. Bring your imagination and create a masterpiece of your own creation! Fantastic opportunity in a pri
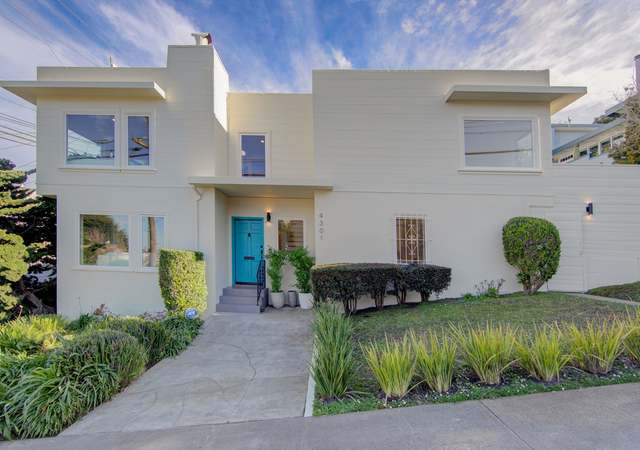
Welcome to 4301 Cesar Chavez Street, where timeless elegance meets modern convenience in the heart of San Francisco. This exquisite property offers a rare opportunity to own a home on a corner lot in coveted Noe Valley. Recently renovated, this home includes three bedrooms, two bathrooms, and plenty of luxurious living space. Step inside to discover an open-concept floor plan adorned with designer finishes, and an abundance of natural light that creates an inviting atmosphere. The gourmet kitchen is a chef's dream, equipped with top-of-the-line appliances, custom cabinetry, and spacious counter tops perfect for culinary creations and entertaining guests. The adjoining dining area seamlessly
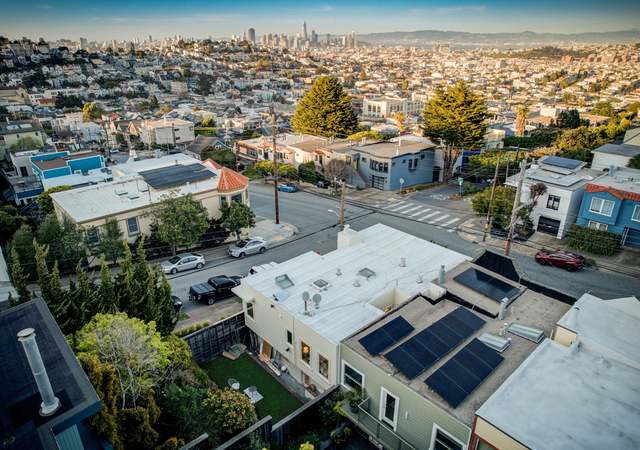
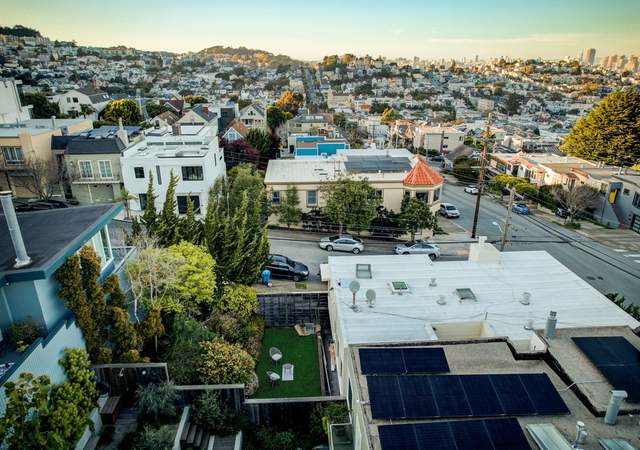
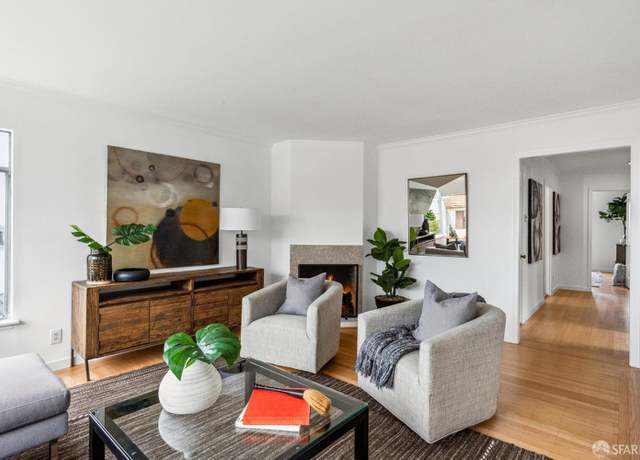
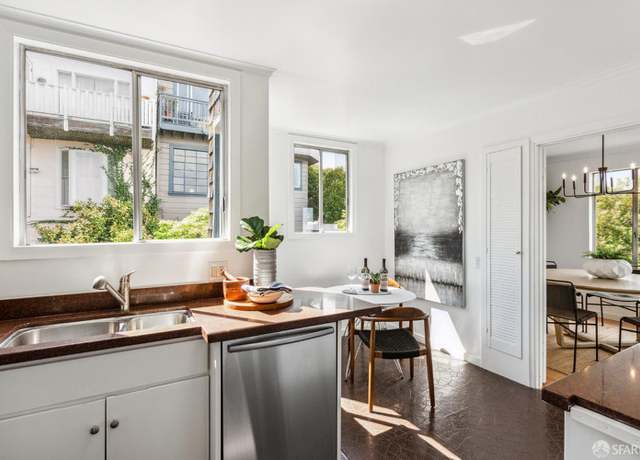
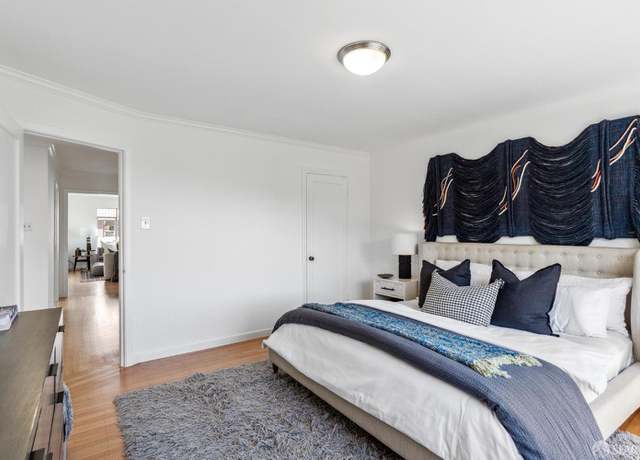
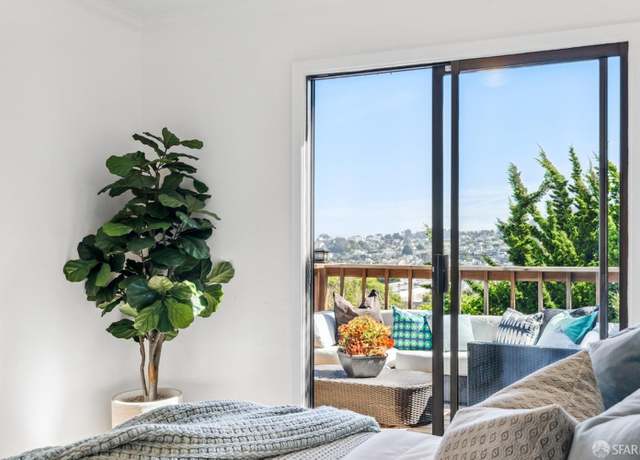
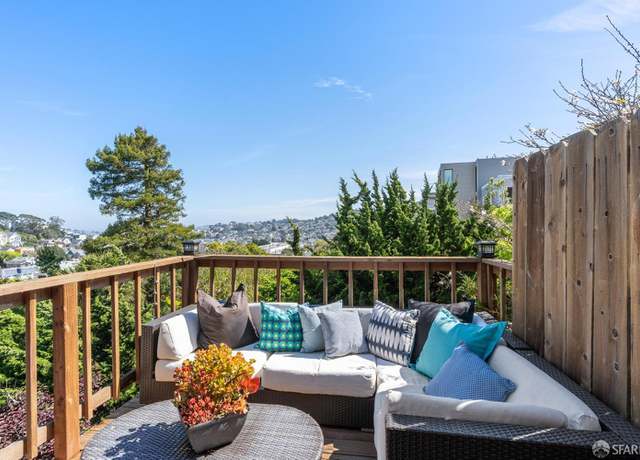
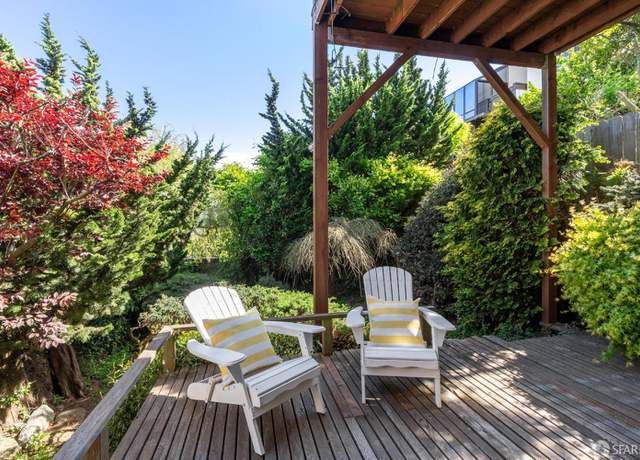
Introducing 260 Ordway, a renovated residence showcasing three captivating decks with breathtaking San Francisco views. This meticulously designed property features 3bd and 2ba. The upper level welcomes you with an open dining area seamlessly connected to a renovated kitchen boasting new stainless steel appliances, a fresh sink, and a chic brushed brass faucet atop Calacatta white quartz countertops. The spacious living room, illuminated by recessed lighting, offers a cozy retreat. Two generous bedrooms and a remodeled bathroom with black hardware and a white marble vanity complete this level. The ground level hosts the primary bedroom with an ensuite bathroom, a walk-in closet, a luxurious
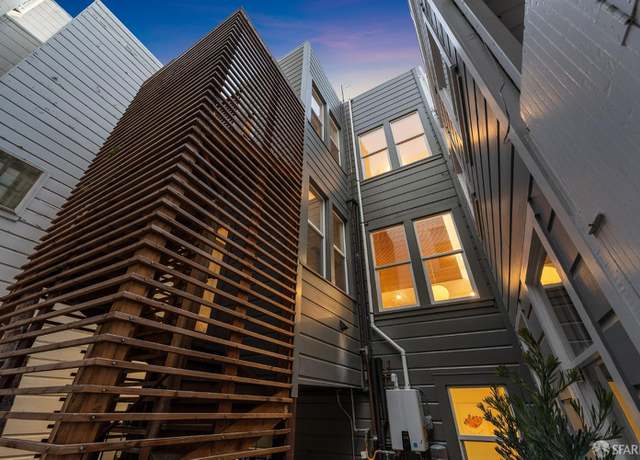
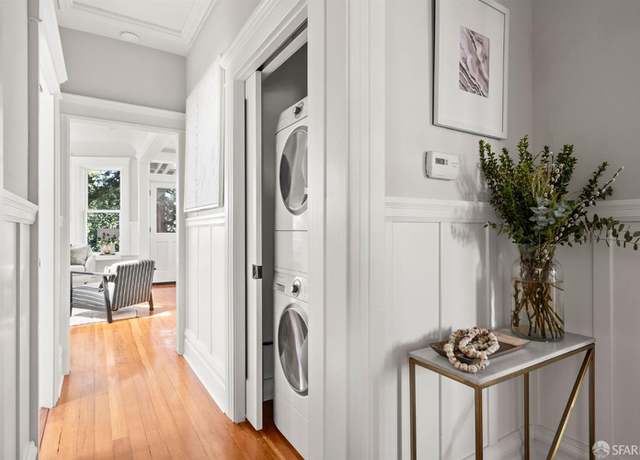
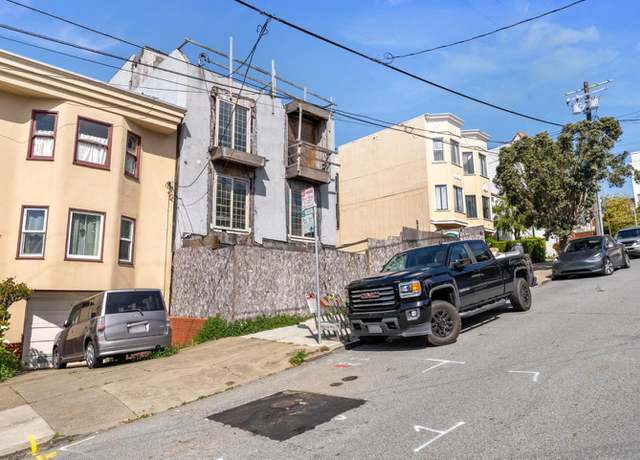
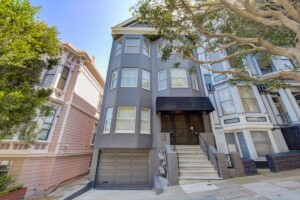
Don't miss this fantastic opportunity in the heart of the Marina! This fab 2-unit, vacant building has fully approved plans for expansion which includes 4 floors, an elevator and deck. Each unit has the potential to be 2 levels. Permit is approved and paid for. The existing flats feature 2 bedrooms and 1 split bathroom with a spacious living room with a wood-burning fireplace and a charming formal dining room. There are generous closets throughout, a balcony off the primary bedrooms, and laundry. There is an existing 1312 sq. ft garage with a large storage room and a backyard. This may also be an opportunity for 2 partners to purchase and convert to condominiums. Enjoy the best of the Marin
1/57
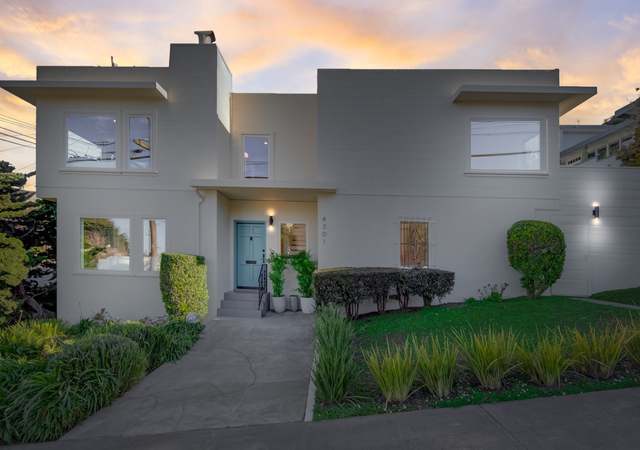
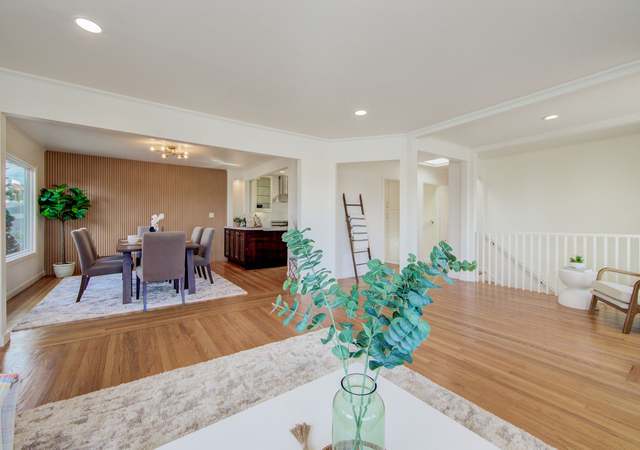
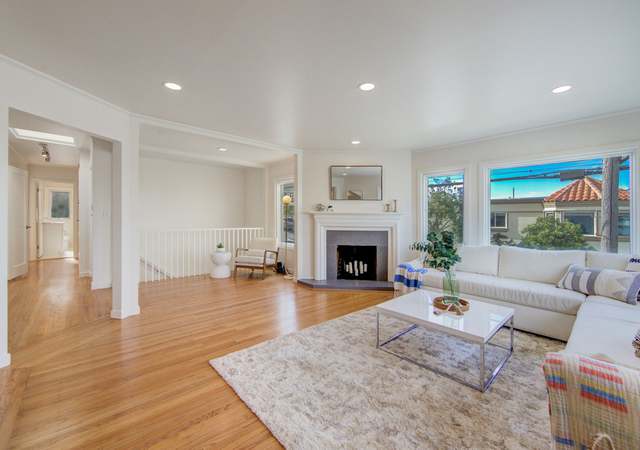
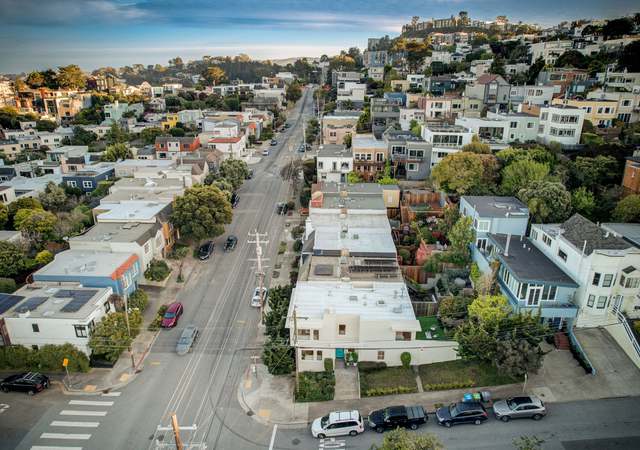
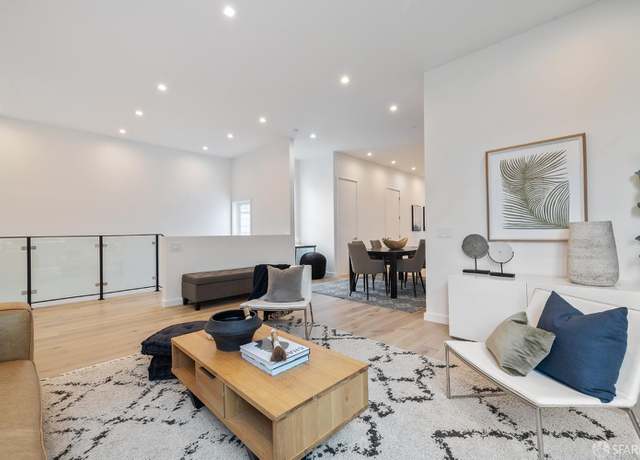
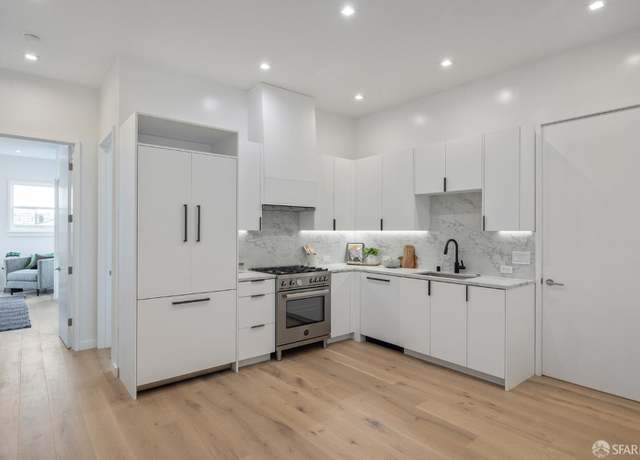
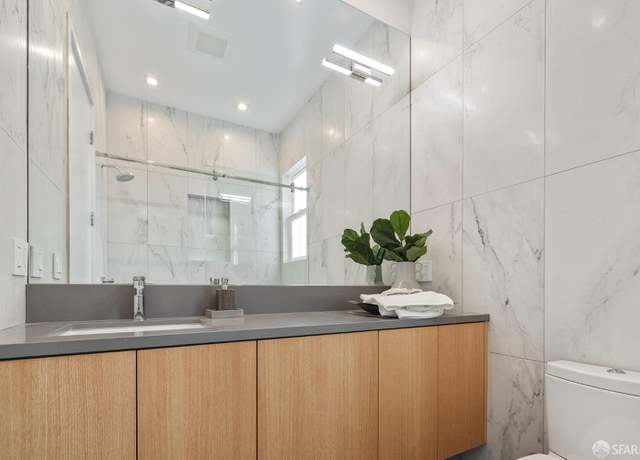
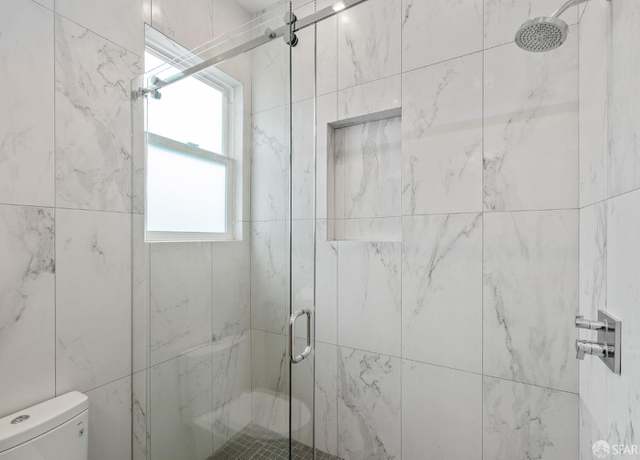
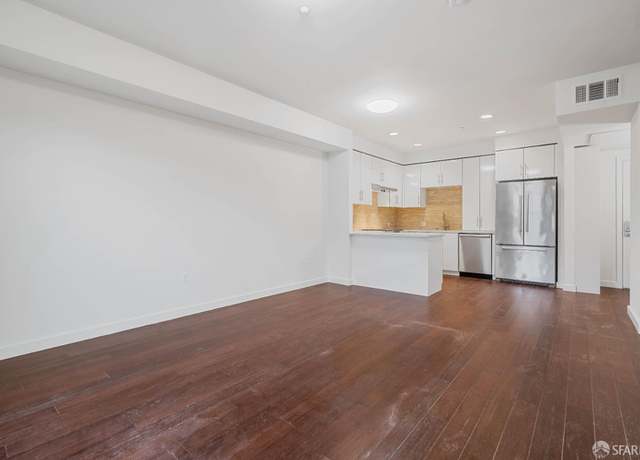
$2,850,000
4 beds— baths2,900 sq ft2,163 sq ft (lot)
3240 - 3242 Divisadero St, San Francisco, CA 94123
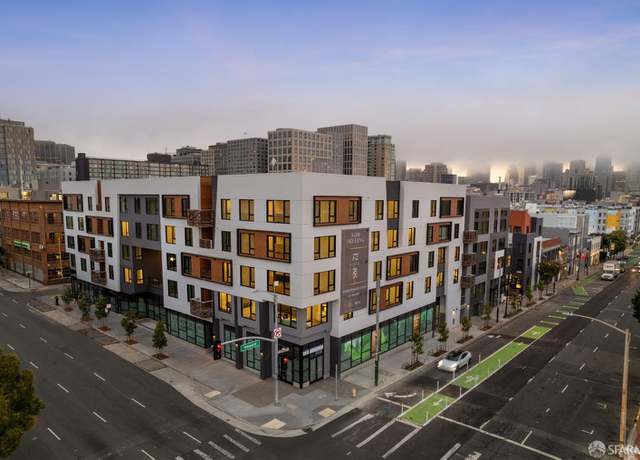
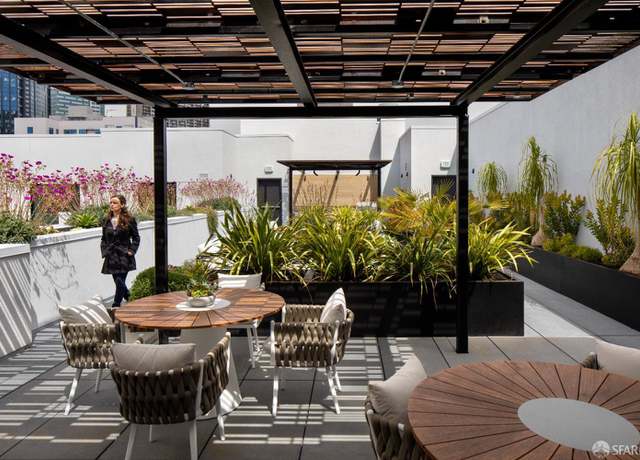
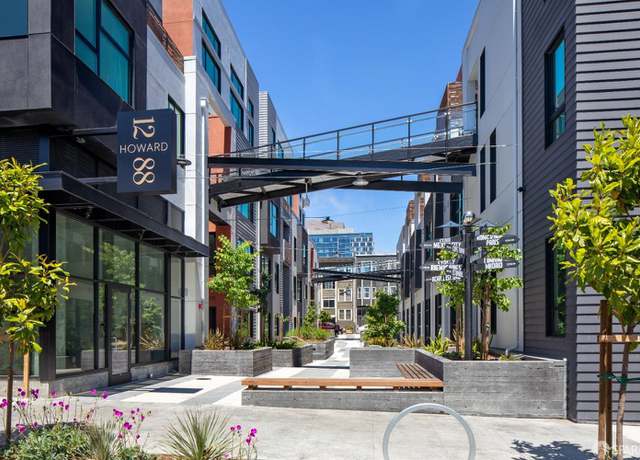
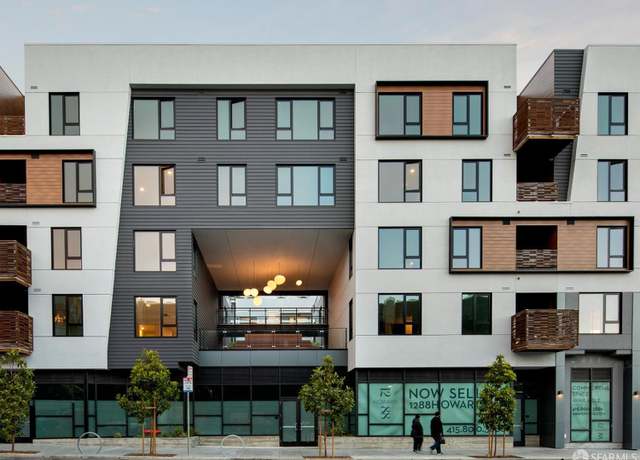
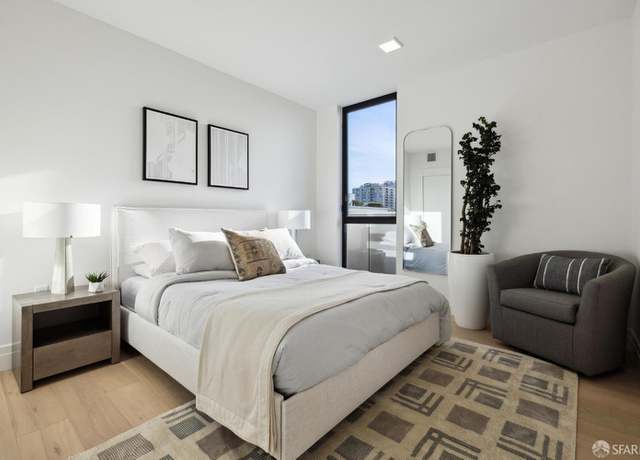
Elegant & opulent design in this corner 2-bedroom, 2-bathroom with den home with walls-of-glass and soaring with sunlight and city skyline views. A lush outdoor courtyard is situated just outside the door. The primary bedroom and ensuite is beautifully designed with dual vanity, 20-inch wall surround tile, and an all-glass over-sized shower enclosure. 1288 Howard is a thoughtfully conceived & luxuriously appointed new condominium complex that brings you the best of SoMa, Hayes Valley, & The Theater District. Residences are designed for how people live, work, entertain and relax. Choose what fits your lifestyle from studios/junior, one-, and two-bedroom flats, artist-style l
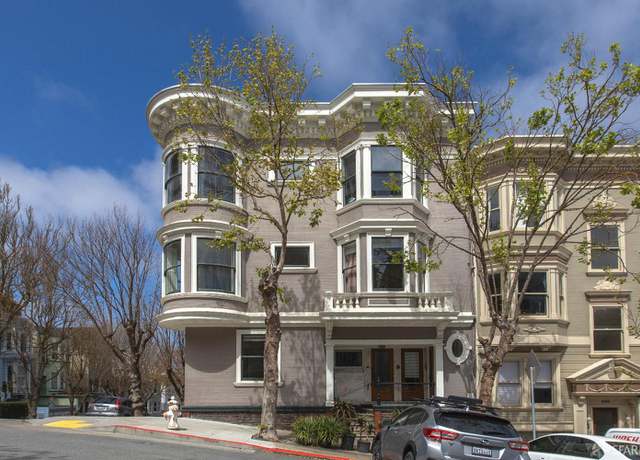
This Liberty Hill Victorian gem boasts downtown views and a resort-style backyard oasis. With a coveted 98 WalkScore, this home epitomizes urban luxury and convenience. Step inside to discover a spacious living room adorned with a south facing bay window, perfect for soaking in natural light. The formal dining room features a marble wood-burning fireplace, setting the stage for memorable gatherings. A chef's kitchen awaits, complete with marble counters, ample storage, and a skylit breakfast nook with custom built-in seating. Entertain effortlessly as the kitchen opens to a large, sun-drenched Ipe deck, ideal for al fresco dining and relaxation. Upstairs, the primary suite beckons with down
Top floor and totally remodeled! Massive four-bed, three-bath home in the heart of Hayes Valley. Expansive full-floor flat in a trophy building with tall ceilings, great light, and views of downtown! The modern, open plan layout includes a chef's kitchen with Euro-style cabinets, gleaming quartz counters, and Bertazzoni counter-depth, cabinet-finish appliances. Bathrooms offer walk-in showers and a deep soaking tub, surrounded by designer tile and spa-like fixtures. Spacious, well-lit bedrooms include a large primary suite with generous closet space and a luxurious bath with dual sink vanity. Additional amenities include in-unit laundry, in-floor radiant heat beneath wide-plank white oak, a
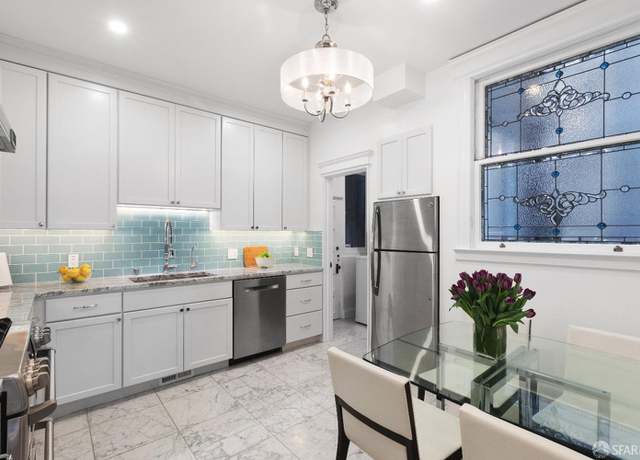
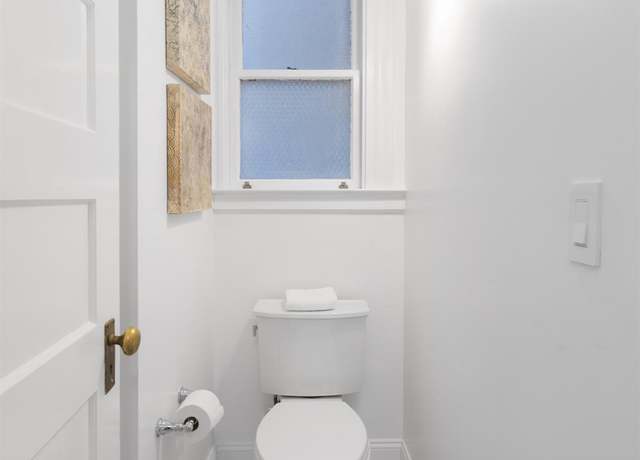
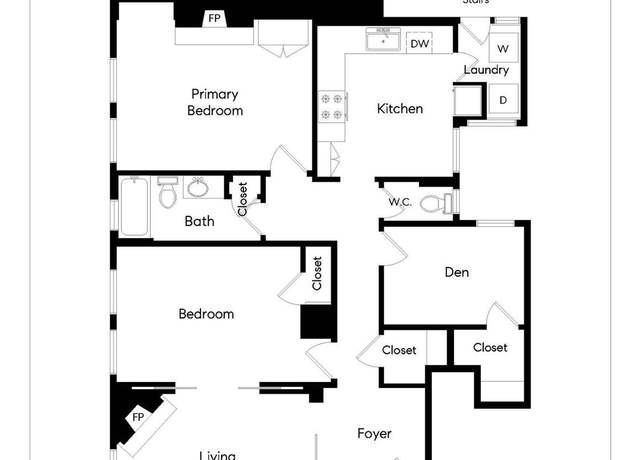
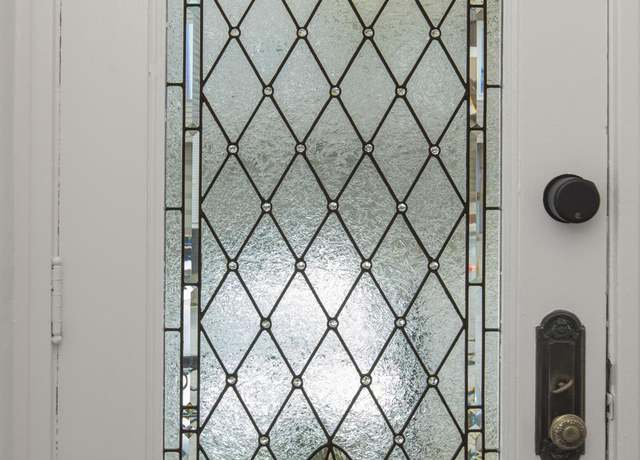
Awash in light from its expansive windows, this beautiful home has been thoughtfully updated for modern living while preserving its beautifully-crafted leaded glass windows, original molding and well-kept hardwood floors. The classic Edwardian floor plan offers a spacious living room with a charming tiled fireplace. Ideally appointed for entertaining, the elegant chef's kitchen boasts stainless steel appliances, marble counters and abundant cabinetry. The sunny, generous primary and guest bedrooms have soaring windows and ample closet space. The luxurious bath with deep soaking tub and marble vanity basks in the light of a lovely stained glass window; there is also a convenient powder room
Discover the allure of owning this charming 4 bedroom 2 bath Ocean Beach home. This two-story tunnel home bathes in natural sunlight, enhanced by new luxury vinyl flooring that elevates the ambiance throughout. On the main level, find two spacious bedrooms, a large sunroom, a welcoming living room with a wood-burning fireplace, and a dining room that flows effortlessly into the kitchen. The kitchen features a new Blanco sink, stainless steel appliances, and is beautifully accented with new quartz counters and backsplash. The lower level boasts additional living space with a family room, bedroom and a full bath. Step outside to find a spacious backyard complete with a detached shed, ideal fo
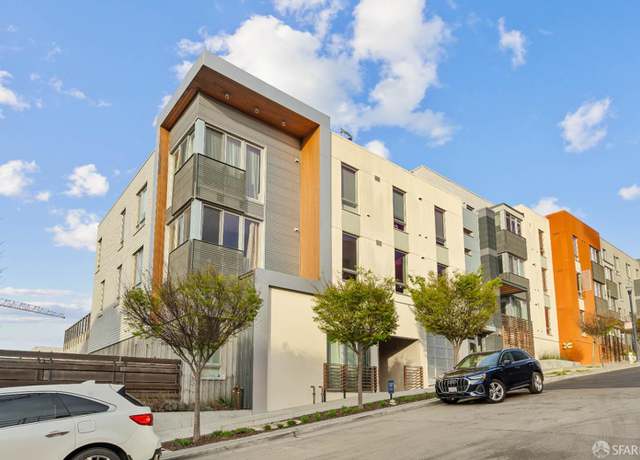
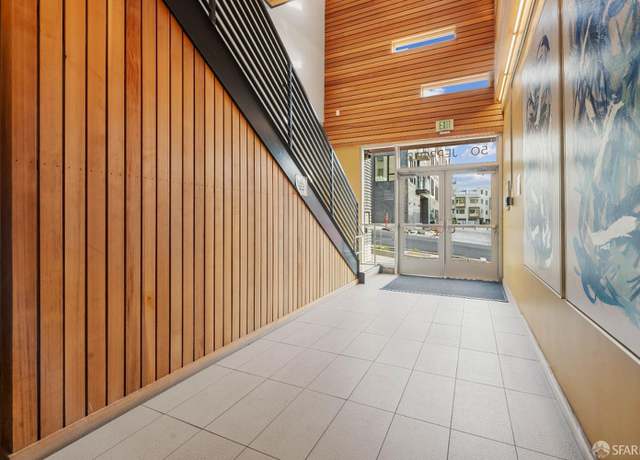
Experience waterfront luxury in this stunning 1-bedroom, 1-bathroom condo by the San Francisco Shipyard. Enjoy modern amenities, a private patio, and the essence of city living. Your perfect urban escape awaits! This beautiful condo features the perfect blend in comfort, convenience, and a contemporary design.
Welcome to this super sweet condo in a gracious four unit Edwardian building. Tucked away on a quiet one block street and just steps from Duboce Park, you can not beat 28 Lloyd's location! Period details throughout include wainscoting, built-ins, soaring ceilings, picture rails and a clawfoot bathtub. Bright and inviting living room overlooks a lush garden, perfect for afternoon musings. Recently refreshed kitchen walks out to a laundry porch with side by side washer/dryer. Each unit has a huge independent storage space that gives you lots of extra use options. Walk to EVERYTHING including the N-Judah, shops on Haight Street, cafes, restaurants, the Castro, and more. The Duboce Triangle nei
Discover the pinnacle of Bayview living in this luxury penthouse condominium. Boasting beautiful views of Twin Peaks from almost every room, this 3 BR, 2 BA penthouse features soaring ceilings, large chefs kitchen with tons of cabinetry and stainless steel appliances including gas cooking + bamboo flooring and newly carpeted bedrooms creating a warm and inviting atmosphere. All closets have been outfitted with custom closet organization including a pantry for the kitchen and a built-in desk in the 3rd BR. Each room is bathed in natural light due to all of the windows, enhancing the open and airy layout. This unit is not only on the top floor but it is also an end unit for added priva
Step into luxury living in this enchanting top-floor condominium nestled in the heart of San Francisco's most prestigious neighborhood, Pacific Heights. This refined 1-bedroom, 1-bathroom residence showcases soaring ceilings, original period details, a captivating wood-burning fireplace, and an abundance of natural light. The thoughtfully designed layout welcomes you with a formal entry leading to a grand formal living room boasting partial southern views, adorned with timeless built-in shelves and bathed in warm afternoon sun. Perfect for hosting gatherings, the elegant dining room transitions seamlessly into the well-appointed eat-in kitchen. Retreat to the generously sized primary bedroo
Propery last sold in 1989. Fabulous San Francisco Bayand Golden Gate Bridge views from this third floor apartment in a 21 unit stock cooperative building. One car parking and storage. Professional property managementv company. Dogs are allowed (size limitation).
Brand New 3-bedroom Penthouse Home in Russian Hill! Bright, vast and smartly designed, this home features an open floorplan with over 1,600 sq. ft. of living space. Its layout is anything but typical with a split bedroom floorplan that positions a primary suite opposite two large bedrooms perfect for a bit of privacy. A wall of floor-to-ceiling windows invites in brilliant natural light all day long. To say the European kitchen is large would be an understatement, as it extends across the entire length of the living space an entertainer's dream. South-facing with plenty of natural light, this penthouse offers a spectacular cityscape, with captivating views of Nob Hill and the Transamerica P
Additional photos coming 4/20! Step into a timeless Victorian haven in San Francisco's Castro district, where elegance meets modern comfort. Spanning over 2200 sq. ft. , this 3 bed, 3 bath condominium boasts classic features and contemporary amenities for sophisticated living. The formal living room welcomes you with intricate moldings and high ceilings, leading seamlessly to a double parlor and a formal dining room, perfect for entertaining guests. The remodeled kitchen, with a breakfast bar and family room, is an entertainer's delight. The spacious bedrooms offer privacy, while the garden-level primary suite is a retreat with its spa-inspired bathroom and walk-in closet. Throughout, perio
Brand New 3-bedroom Penthouse Home in Russian Hill! Spacious and stunning with brilliant views for miles. This home is truly breathtaking with a layout that seems to extend to forever. The largest home in Maison Pacific and perhaps the most striking boasts an open floorplan with over 2,000 sq. ft. of living space, with three large bedrooms, a wall of floor-to-ceiling windows and a large European kitchen. Its outlook is equally spectacular. Facing north, this residence presents Pacific Heights, the Golden Gate Bridge, the bay, Marin Headlands and beyond not just from one room, but from every room. Feel free to capture it all from your glistening windows or private balcony that runs the entir
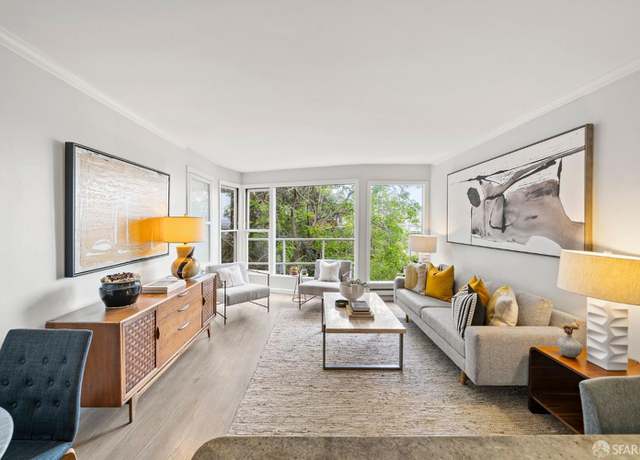
Nothing like it. Inside the private gated courtyard lies a Spanish LA style bungalow, that lives similarly to a single family, but looks to have been connected to the neighboring building, for the benefit of more square footage (while still retaining a single-family home feel). Perfect pied a terre to pass down through generations, or serve as an amazing starter HOME for those who cannot afford a single family in the Marina, but want the benefits of one (Detached, Scale, Private Outdoor Space AND TWO PRIVATE + SEPARATE GARAGES, with massive storage. One of the garages is just off the private courtyard/front door, for additional space and convenience!!!). The interior looks like something yo
1/26
$1,495,000
2 beds1 bath1,338 sq ft
1304 - 1308 Francisco St #1306, San Francisco, CA 94123
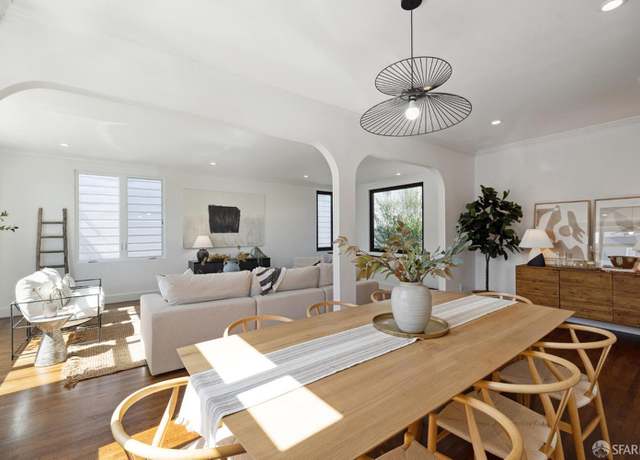
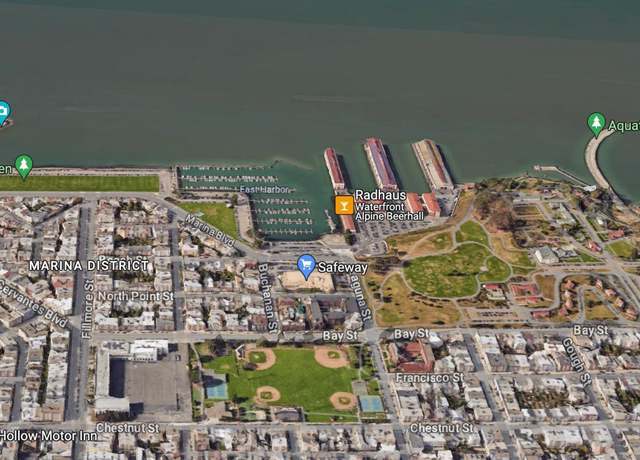
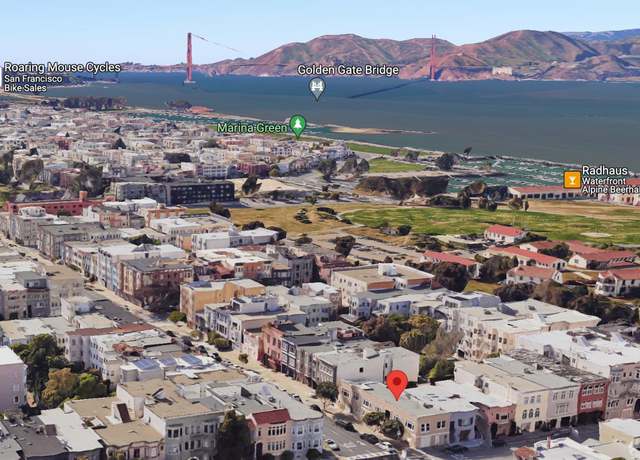
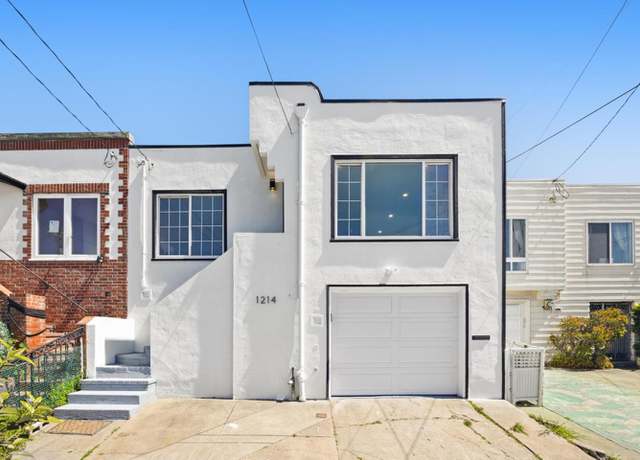
Nestled just one block away from the iconic Golden Gate Park and the majestic Ocean Beach, 1214 48th Ave offers a unique opportunity to experience the vibrant lifestyle of San Francisco's western edge. This charming residence embodies the essence of coastal living with its convenient location and cozy yet stylish interiors. Step inside to discover a thoughtfully updated interior, greeted by a flood of natural light streaming through an oversized window in the living room, featuring a modern kitchen with stylish cabinets and appliances, seamlessly flowing into an open-concept living room and dining area. An updated bathroom features a soothing bathtub. Each of the two bedrooms offers a cozy
Cole Valley living awaits in this impeccably appointed light-filled top-floor Condo, located in a 2-unit Art Deco building on the corner of one of the most charming streets in the neighborhood. Enter your spacious sanctuary among the trees with views of the surrounding hills through the bay windows. The open-concept layout allows for an easy, peaceful flow in the heart of your extensively updated and remodeled home. The large Primary Suite is really the showstopper of this home as it opens through 12' Pella sliding doors to a private Deck with majestic views of St. Ignatius Church to the Golden Gate Bridge towers and beyond. A walk-in closet & modern en-suite bathroom with skylight co
Enchanting charm, expansive views and magical light; it's no wonder this darling cottage on Paris at France delivers a certain "je ne sais quoi''. The 2bd/1ba square floorplan, oversized NW facing windows and indoor/outdoor access off both kitchen and back bedroom optimize the space. Updates-- including new cabinets, quartz countertops and custom built-in table-- add function and flourish to the eat-in kitchen. Connected by a walk-out deck, the garden is a natural extension of the home, enabling a farm-to-fork lifestyle for past owners. Along with the covered deck that houses laundry next to the kitchen, additional flex space downstairs nearly doubles the usable square footage of this
Discover urban living at its finest in this charming 1-bedroom, 1-bathroom residence. With a freshly painted light-filled interior, refinished hardwood floors, and new LVP flooring in the kitchen, this sweet home showcases the warmth of vintage architectural detailing (high ceilings, decorative mouldings, retro fixtures) enhanced with a fresh new feel! The remodeled bathroom, spacious kitchen, in-unit laundry room and office nook offer both function and style. Additionally, the lovely shared backyard and attached garage parking add convenience and comfort to this Noe Valley gem. Perfectly situated, this home is just steps away from numerous cafes, eateries, shops, and public transportation
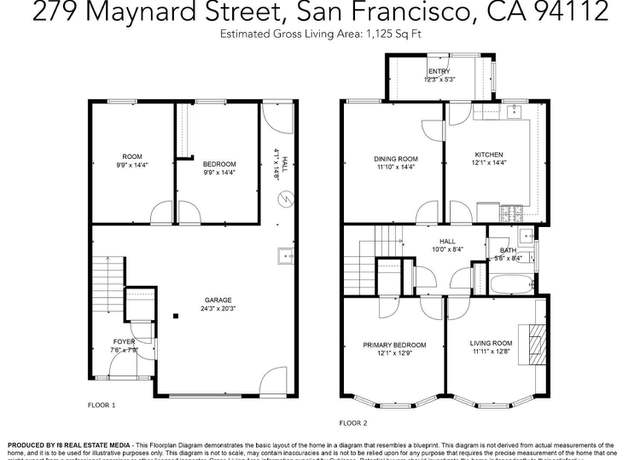
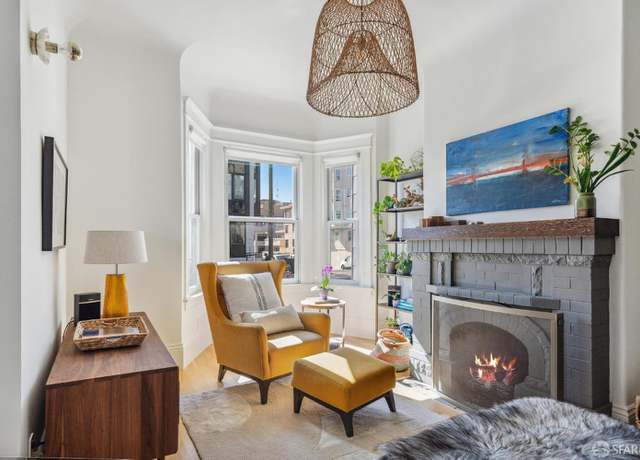
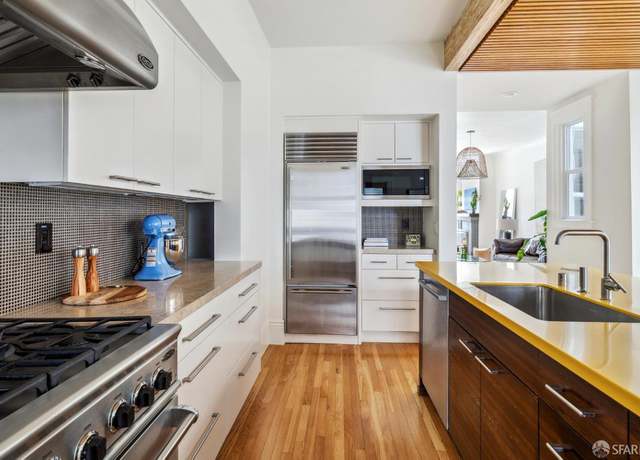
Nestled in the heart of vibrant Excelsior District, 279 Maynard St welcomes you with its timeless charm and modern comforts. Dual-pane windows flood each room with sunlight while ensuring energy efficiency enhancing your comfort. In the well-appointed kitchen, granite countertops elevate the space with their appeal, providing a stylish backdrop for culinary creations and casual breakfasts alike. The formal dining room beckons for intimate meals or lively dinner parties, offering a warm atmosphere. The bonus room downstairs provides versatile options to suit your lifestyle needs. Fresh paint in designer colors graces the interior, infusing each room with a contemporary flair while offering a
This home truly stands apart from the others. With an exceptional floor plan featuring * incredible light * east-facing exposure * spectacular unobstructed views of the Bay Bridge, Treasure Island and the Berkeley Hills * glistening Bay Bridge lights visible by night from both the LR + BR. This 1BR, 1BA + den, is the largest of all 1BR plans at 837sf (per developer) + showcases floor-to-ceiling windows & gorgeous hardwood floors. Enjoy spectacular sunrises from your luxuriously appointed, updated kitchen featuring a gas range with SubZero + Bosch appliances. The open plan LR/DR area with bonus nook is the perfect spot to watch the ever-changing waters of the Bay. Retreat to the newly
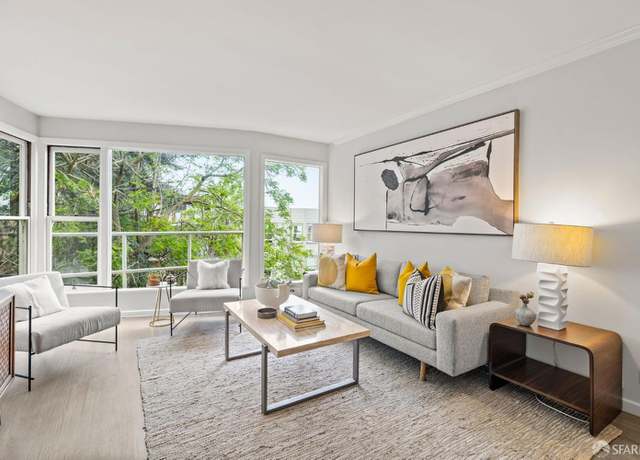
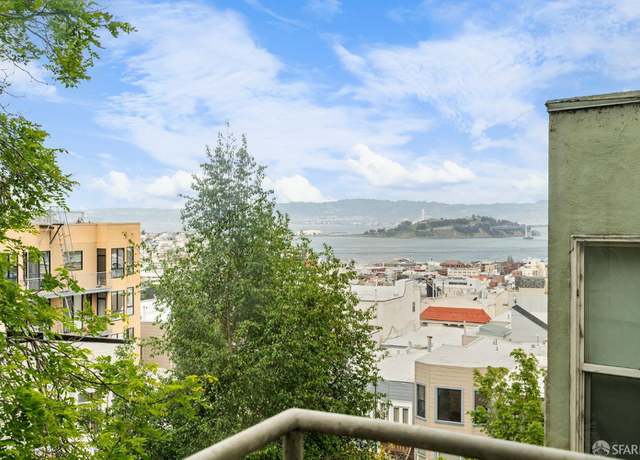
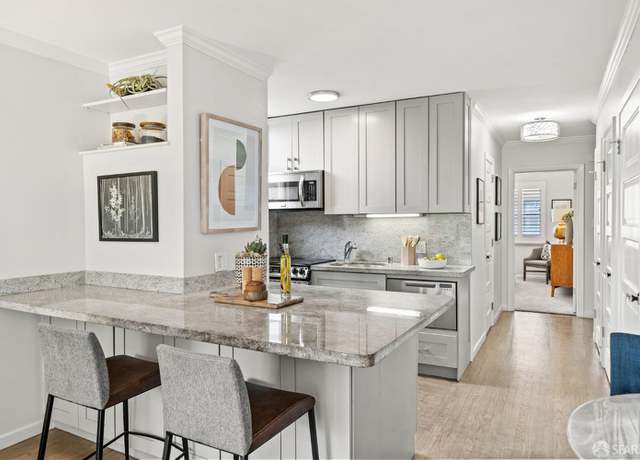
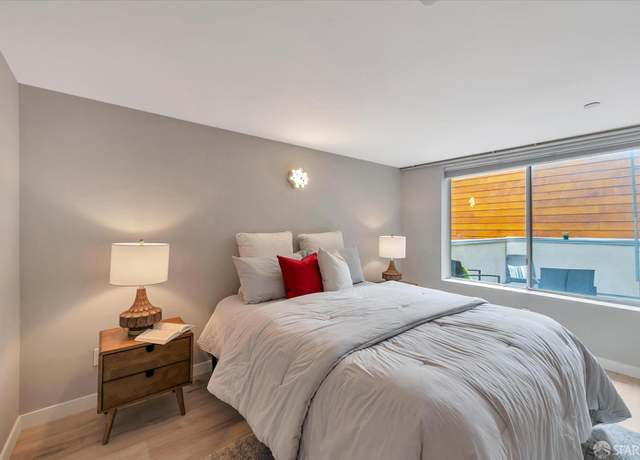
Elevated to its fullest potential by a team of residential designers and builders, no expense was spared from the radiant heat and new electrical system to the extensive safety upgrades and protective drainage system under the new foundation. The bi-level, upper level residence (#1756) includes 3 bedrooms (on same level), 3 baths, 2 offices, 2 wet bars, and a combined kitchen/dining area with custom cabinetry and an over-sized island that flows to a spacious living room. The 3rd floor features a large primary suite with city views, walk-in rain shower and freestanding slipper tub. A hallway wet bar & mini fridge serve as upstairs coffee station & pantry. Options for the lower le
1/52
$2,650,000
1 bed— baths2,921 sq ft1,360 sq ft (lot)
1754 - 1756 Leavenworth St, San Francisco, CA 94109
This good sized one bedroom condominium is located on the building's third floor which has access to the large outdoor common space and in addition has two private patios areas, access from both the living room and bedroom - a rare find! Appliances have been updated, in unit washer & dryer. Easy access to transportation - walk to Muni Metro & BART, Tech busses stop in front of the building and if desired parking is available in the building.
1/32
$619,000
1 bed1 bath795 sq ft
140 South Van Ness Ave #322, San Francisco, CA 94103
Located on a picturesque, tree-lined block in the heart of San Francisco, this exquisite condo on Alpine Terrace offers the perfect blend of historic charm and modern luxury. Boasting over 1,600 square feet of beautifully designed living space, this residence is a sanctuary in the city, complete with three spacious bedrooms, two full bathrooms, and captivating views of Downtown and the Bay. Designed for both relaxation and social gatherings, the open living area, accentuated by soaring 10-foot ceilings and elegant details, creates a welcoming atmosphere for entertaining. The two-level, house-like floor plan effortlessly integrates indoor and outdoor living, featuring two private outdoor spa
Top Floor Edwardian flat in the heart of Mission Dolores. This classic remodeled condo, with more than meets the eye, sits on a dead end street just steps away from the vibrant energy of Valencia. Think softwood floors, traditional wainscoting details, and skylights that flood the space with natural light - even when Karl the Fog is around. Two bedrooms and one bath occupy the top level, with open living, dining and renovated kitchen, all connected and overlooking the gardens and historic Redwood tree. Did we mention roof deck rights with incredible views? Accessed via the building foyer are two additional finished bonus rooms, one with a permitted half bath, used as a home office, gym, and
Nestled in the prestigious Laurel Village neighborhood of San Francisco, 2 adjacent lots present a rare opportunity for investor, developer, or contractor seeking the pinnacle of luxury real estate. The project has Full Entitlements & a Foundation Nearly Complete. Approved/Expired Construction Permits/Documents are available, plus Job Cards. Great un-obstructed views. Adjacent 23w & 21w lots greatly reduces construction overheads. 23 Wood: 1st condo 2,687sq. ft. , 2nd condo 2,459sq. ft. & 21 Wood: 1st condo 3,055sq. ft. & 2nd condo 2,620sq. ft. Decks & Garages NOT included. 2 lower units (23 & 21w) - large rear deck & Full Entitlement to exclusive bac
Beautifully remodeled 3-bedroom, 2.5-bathroom Marina-style SFR nestled in the coveted Dolores Heights neighborhood. The formal living room welcomes you w/ its decorative FP & elegant tray ceiling. The south-facing bay window bathes the space in natural light. Formal dining room & remodeled chef's eat-in kitchen feat. granite countertops, Thermador appliances, including a 6-burner gas range & hood. The wide door frames enhance the open feel, promoting a sociable flow between the living room, dining room, and kitchen. On the main level the large primary bedroom includes peak-a-boo downtown views, & an attached sunroom, ideal as a home office. Take advantage of the home'
Welcome to this exquisite boutique elevator building, tucked away on a tranquil cul-de-sac, perched atop the illustrious Telegraph Hill, where cityscapes meet expansive vistas of the majestic Bay. A recent remodel has transformed this residence into a masterpiece of modern design, where every detail has been thoughtfully considered to enhance both form, function and luxury. Upon entering, be greeted by expansive views of the sparkling Bay, Golden Gate Bridge & the infamous silhouette of Alcatraz, a captivating backdrop visible from the expansive windows that fill this home. Enter inside & discover the Bulthaup designed kitchen adorned w/ top-of-the-line appliances where culinary
Welcome to 7 Hallam Street an award-winning building designed by Siegel & Strain Architects. Unit 1A is a chic split-level, 1-bed, 1-bath condo with a loft that exceeds expectations. Soaring 2-story floor-to-ceiling windows in living room. Patio door extends indoor-outdoor living to a private patio/entertainment space. The versatile loft offers ideal space for home office or guest retreat. Spacious bedroom, featuring 1.5-story high ceilings and large bay window. Thoughtfully laid out with hardwood floors, newer stainless steel appliances (refrigerator, electric oven, & dishwasher), stone countertops, wood cabinets, and dining area. Tiled bath has double sinks, with a shower over
Indulge in urban luxury in this grand corner unit at The Austin. This contemporary gem features a spacious wrap-around deck and abundant natural light. Inside, revel in city views from the expansive window line, and entertain in the open-plan layout with European oak floors. The chef's kitchen boasts ample cabinetry, a custom island, and top-tier appliances including a Miele gas cooktop. The primary suite offers a spacious walk-in closet and spa-like bath with a floating dual vanity, separate shower, and a freestanding soaking tub. A second bedroom, guest bath with premium finishes, in-unit laundry, central AC, and rare 2-car parking enhance convenience. Situated amidst Pacific Heights, Nob
Whether you're looking for a tranquil retreat or a vibrant urban lifestyle, this home offers the best of both worlds. Located at the peaceful rear of the building, this 1BD, 1BA condo in iconic Nob Hill offers side views of Coit Tower + Bay + Bay Bridge from the living room. This updated home boasts a thoughtfully designed open floorplan that optimizes every inch of space, enhanced by floor-to-ceiling windows that flood the living room with natural light, complimented by wood flooring throughout the living areas. Custom closets provide ample storage, while a shared rooftop deck presents sweeping views. Elevator access, storage, and parking add to the convenience. With an array of dining opt
In the heart of Dogpatch, this urban chic, updated indoor-outdoor condo features 2.5 levels of living & 2 private outdoor decks! The main level combines the great room w/ soaring ceilings, kitchen & raised loft area w/ access to a private spacious outdoor patio. The chef's kitchen boasts stainless steel appliances and an island w/ bar seating & a very large pantry. A large flex room with a large amount of closet space could easily be a third bedroom. A remodeled full bathroom & laundry area complete this level which includes brand new LVP flooring. The sleeping level offers a primary bedroom w/ an ensuite remodeled bathroom, a large custom primary BR closet, and an e
This well maintained, two-bedroom view home, on a wide lot, offers tranquility paired with a desirable floor plan, wonderful outdoor spaces, and opportunities for expansion and personalization. The convenient Noe Valley location places you in one of the city's most desirable neighborhoods. The spacious living room has stunning downtown views, richly finished hardwood floors, and a cozy wood burning fireplace. It is open to the dining room, where you can take in the view over family meals or dinner parties with friends. The well-designed eat-in kitchen has granite countertops, stainless appliances and ample storage. Off of the hall, which leads to the two spacious view bedrooms, is a large b
Welcome to this exquisitely remodeled move-in-ready single family home w/ sweeping views on a prime flat block in the popular Ingleside! It features a modernized floorplan, painstaking attention to detail and abundant natural light. Extensively redesigned w/ permits, the open-concept living/dining/kitchen area is anchored by a large quartz center island w/ cabinets on both sides & bar-seating. Main level features 3 BR's conveniently situated on the same floor and a renovated spa-like bathroom. Multiple skylights & windows on 3 sides ensure every room feels bright & airy. Enjoy impressive views of Mt Davidson and beyond! Luxe features include triple-paned Pella windows, wid
This amazing vacant 2-unit building showcases grand scale, amazing natural light, gorgeous period detail, and is located on a premier block of Lone Mountain, just steps from Rossi Park, Golden Gate Park, and bustling Clement Street. This distinctive property offers two exquisite full floor flats featuring 2 bedrooms, 1 bathroom, an expansive living room perfect for entertaining, formal dining room, and gracious chef's kitchen. There is also a large 3+ car garage, multiple storage rooms with expansion potential, and a lush landscaped shared backyard. This property offers an excellent opportunity for a family compound, an owner user with rental income, or an investment building with strong in
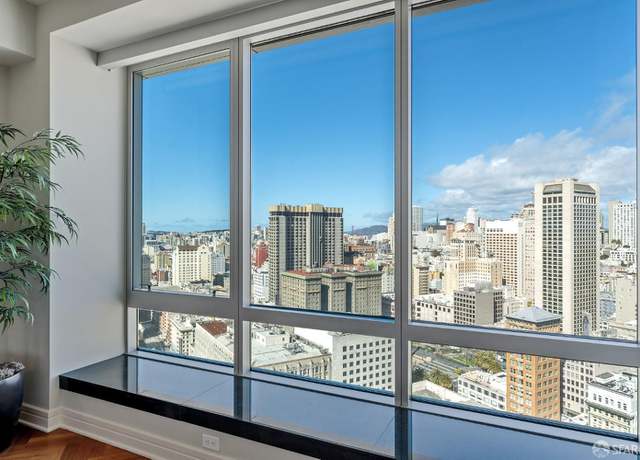
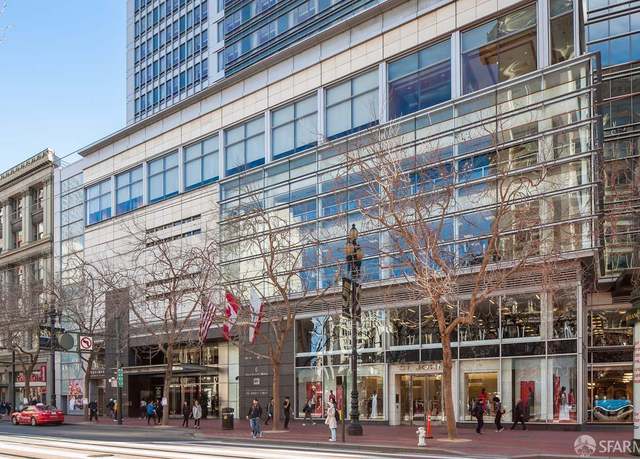
Welcome to the epitome of ultra-luxury living at The Four Seasons Residences, No. 36E This breathtaking property floating high above the City's Union Square enjoys unparalleled views sweeping from the Golden Gate Bridge to the gleaming towers of the Financial District with other iconic landmarks such as Union Square, Alcatraz, and the spires of the City's iconic St. Ignatius, Grace Cathedral and St. Peter Paul churches framed by the shimmering waters of the Bay as a scenic backdrop during the day and adding to the glittering lights of the night-time view. Beautifully light-filled, this 2 bedroom, 2.5 bath condominium home features an exceptional open floorplan design with walls of glass sho
Your heart's desire! Dreamy remodeled Marina-style home. Magical garden oasis on an ideal Ingleside block. Circa 1923 character enhanced with a fresh sensibility. Friendly floor plan & inimitable character. Airy living room with fireplace, built-ins. Formal dining room has coved ceiling, recessed lights. Newly remodeled kitchen w/ farmhouse sink, open shelves, stone counters, stainless steel appliances. Two sunny bdrms & cheery bath on main floor. Downstairs is an exceptional bonus room & bath, so you can use the home as a 2/1 with family rm or as a 3/2. Walk directly out to your private, quiet outdoor haven: Gorgeous deck, stone patio, evergreen lawn, raised vegetable bed
This area's enrollment policy is not based solely on geography. Please check the school district website for more information.
Elementary schools
Middle schools
High schools
GreatSchools Summary Rating
9/10
Lawton Alternative Elementary School
Public, K-8 • Choice school
9/10
Ulloa Elementary School
Public, K-5 • Choice school
9/10
Lau (gordon J.) Elementary School
Public, K-5 • Choice school
9/10
Clarendon Alternative Elementary School
Public, K-5 • Choice school
9/10
Stevenson (robert Louis) Elementary School
Public, K-5 • Choice school
Only showing 5 of
82 elementary schools.
School data is provided by GreatSchools, a nonprofit organization. Redfin recommends buyers and renters use GreatSchools information and ratings as a first step, and conduct their own investigation to determine their desired schools or school districts, including by contacting and visiting the schools themselves.Redfin does not endorse or guarantee this information. School service boundaries are intended to be used as a reference only; they may change and are not guaranteed to be accurate. To verify school enrollment eligibility, contact the school district directly.
Homes for sale in San Francisco have a median listing price of $1.29M. Some of these homes are Hot Homes, meaning they're likely to sell quickly.
What are some of the most popular neighborhoods in San Francisco?
Popular neighborhoods include Sunset District, Presidio Heights, Pacific Heights, Bernal Heights, Marina District, Inner Richmond, Noe Valley, Potrero Hill, Glen Park, and Russian Hill.
San Francisco, California boasts a comprehensive public transportation system, including buses, light rail, and the iconic cable cars. Despite this, traffic levels can be high, particularly during peak hours, making driving a car in the city a potentially time-consuming endeavor. The city is also well-connected to the rest of California and beyond, with several major highways and freeways in close proximity. Therefore, whether you prefer to drive or use public transportation, San Francisco offers a variety of options to meet your commuting needs. Learn more on our San Francisco city guide.
What types of properties are available in San Francisco?
San Francisco, California offers a variety of single-family home types, including Victorian, Edwardian, Mid-Century Modern, and Contemporary styles, each with its own unique architectural features and design elements. These homes can be found throughout the city, from the iconic Painted Ladies in Alamo Square to the charming row houses in the Mission District and the sleek modern homes in Pacific Heights. Most properties offer a range of bedrooms and were built in different years, providing a diverse selection for buyers. To explore different property types for sale in San Francisco, California, use the 'Home type' filter located above the active listings. Customize your search by selecting options like single-family homes, condos, townhomes, and more.
What is life like in San Francisco?
Living in San Francisco, California offers a unique experience with its picturesque landscape that seamlessly blends urban and natural elements. The city boasts a mild Mediterranean climate, characterized by cool summers and mild winters, providing a comfortable environment year-round. San Francisco is known for its thriving job market, particularly in the technology and innovation sectors, attracting professionals from various industries. The city offers a vibrant social scene with an abundance of cultural events, festivals, and nightlife options to explore. Residents can also enjoy outdoor activities such as hiking, biking, and water sports thanks to the city's proximity to the Pacific Ocean and nearby parks.
What are the schools and amenities like in San Francisco?
San Francisco, California, is a city rich in public amenities that cater to the diverse needs of its residents. It boasts an array of restaurants, offering a vast selection of cuisine to satisfy any palate. The city is also home to numerous parks, providing serene spaces for relaxation and leisure. Grocery stores are conveniently located throughout the city, ensuring easy access to daily necessities. Additionally, San Francisco provides other amenities such as libraries, fitness centers, and public transportation, enhancing the quality of life for those who call this city home.
In the past month, 374 homes have been sold in San Francisco. In addition to houses in San Francisco, there were also 1004 condos, 12 townhouses, and 150 multi-family units for sale in San Francisco last month. San Francisco is a fairly walkable city in San Francisco County with a Walk Score of 89. San Francisco is home to approximately 804,533 people and 589,799 jobs. Find your dream home in San Francisco using the tools above. Use filters to narrow your search by price, square feet, beds, and baths to find homes that fit your criteria. Our top-rated real estate agents in San Francisco are local experts and are ready to answer your questions about properties, neighborhoods, schools, and the newest listings for sale in San Francisco. Our San Francisco real estate stats and trends will give you more information about home buying and selling trends in San Francisco. If you're looking to sell your home in the San Francisco area, our listing agents can help you get the best price. Redfin is redefining real estate and the home buying process in San Francisco with industry-leading technology, full-service agents, and lower fees that provide a better value for Redfin buyers and sellers.


 REDFIN IS COMMITTED TO AND ABIDES BY THE FAIR HOUSING ACT AND EQUAL OPPORTUNITY ACT. READ REDFIN'S FAIR HOUSING POLICY AND THE NEW YORK STATE FAIR HOUSING NOTICE.
 United States
 Canada