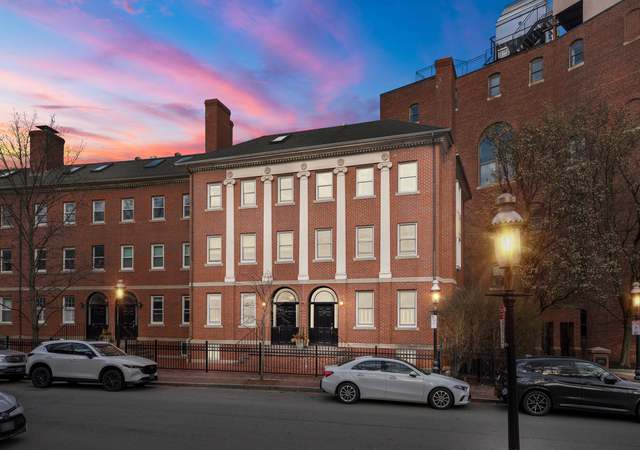
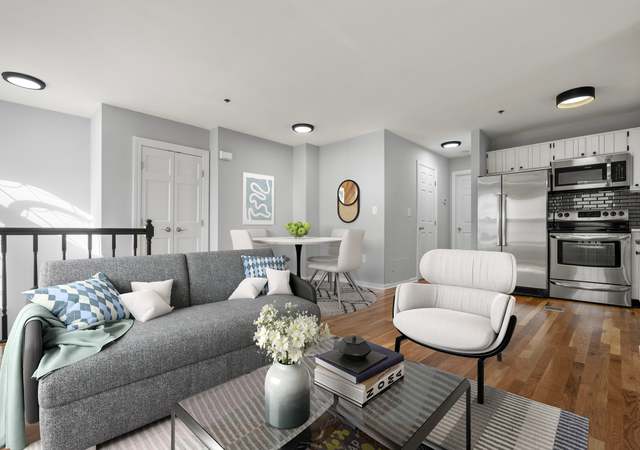
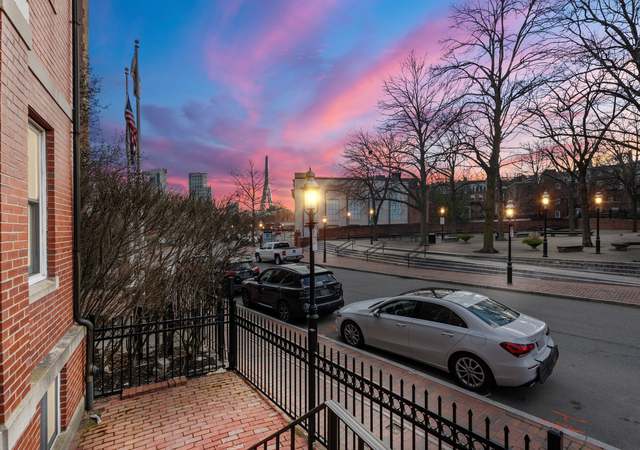
Recently renovated, this charming 3-bedroom, 2-bathroom residence is nestled in the vibrant Gas Light District of Charlestown. Boasting a private entrance and occupying a corner duplex, it exudes the spaciousness of a single-family home. Inside, discover gleaming hardwood floors, a cozy wood-burning fireplace, ample closet space, convenient in-unit washer/dryer, and modern comforts like central air conditioning. Enjoy leisurely moments on your own private deck. Situated opposite John Harvard Mall and mere steps from City Square, this residence offers easy access to downtown Boston, the historic North End, MBTA transit, Whole Foods, an array of dining options, and the iconic Navy Yard, ensur
Amazing Opportunity to own in the Fenway! This bright and sunny studio is located on the third floor of a beautiful condo building on Queensberry Street. A spacious studio room with several sunny windows and big closet, large nook is perfect for an office area or eat in kitchen! Hardwood floors throughout, high ceilings, and full tile bath! In the most ideal location with quick access to public transportation, Longwood Medical Area, Kenmore Sq, Fenway Colleges, MFA, grocery, restaurants, and all this incredible neighborhood has to offer! Pet friendly!
Welcome to Queensberry Court! The prettiest residential courtyard in Fenway! This lovely one bedroom home is spread across 615 Sq Ft. Several sunny windows overlooking the flowers and courtyard! You will love the bright and airy corner living room, spacious eat in kitchen with very cute breakfast nook and classic tiled flooring, stainless steel appliances with large vent, wall mounted range, spacious bedroom with good closet space, and tall ceilings! Fantastic condo association with beautiful entry and landscaping, laundry room, and intercom. Prime location in the heart of Fenway among some of the most exciting new development in Boston with many new restaurants, grocery, pharmacy, doctors
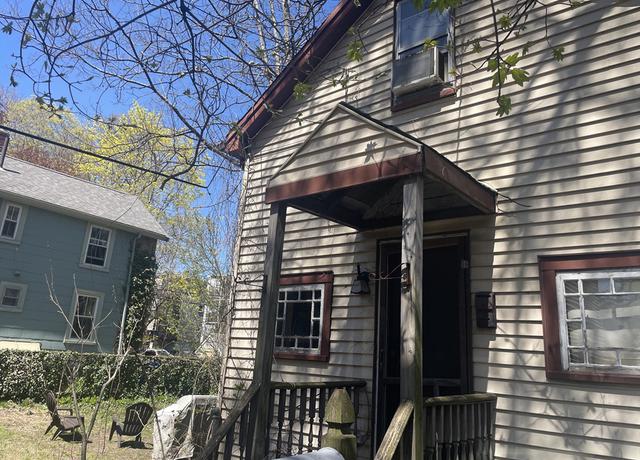
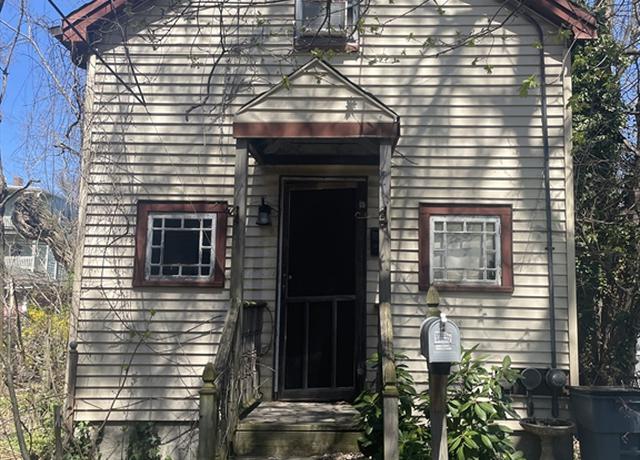
Once a sweet storybook 1 bdrm single family in central JP. Set back off the street with a side yard. Water and heat are off. Electricity is on, run on fuses. SW Corridor is at the end of the street and Centre Street shops + 5 minutes away. Estate sale, will need a flexible closing.
RARE FIND! A + location Two-Family Investment Opportunity at 49 Bayard Street & 27 Myrick Street. Located in Sought After Lower-Allston, Situated on a Corner Lot offering Direct Entry to each unit and 4 Off-Street Parking Spaces. The First Floor (27 Myrick St. ) Features 5 Rooms, 2 - 3 Bedroom, 1 Bathroom, Updated Eat-In-Kitchen with Granite Countertops, Newer Cabinets, Gas Range, Formal Dining Room and Spacious Living Room. The Second/Third Floor (49 Bayard St. ) Features 8 Rooms, 5 Bedrooms, 2 Full Bathrooms, Eat-In-Kitchen, Formal Dining Room and Spacious Living Room. Separate Laundry and Utilities in the basement. Quiet street with convenience to neighborhood amenities including
Experience luxury urban living in this 1BR unit at the prestigious Folio building. Enjoy 24/7 concierge, on-site manager and super. The open kitchen features granite counters, stainless steel appliances, gas cooking, and ample cabinet space. Large windows fill the living and bedroom areas with natural light. In-unit laundry and deeded extra storage space enhance the convenience. Located one block from Boston Harbor and Faneuil Hall, where the Waterfront and Financial District neighborhoods converge. The Greenway provides quick access to the North End and Seaport. For commuters, enjoy easy access to Rt. 93, Mass Pike, and multiple MBTA stations. On-site heated garage parking available for sa
ATTENTION ALL CONTRACTORS, ARCHITECTS, REMODELERS! This is your chance to take a hidden gem in a desirable location back to its original charm. Nestled in the Moss Hill area of JP, this property boasts 4 bedrooms, 3.5 bathrooms, and a generous square footage of living space on a total lot size of 6009 square feet. The kitchen, located towards the back of the house, presents an excellent opportunity for updating to fit your modern vision. Adjacent to the kitchen, is another room with a lovely fireplace and abundant natural light, offering serene views of the wooded backyard. The partially finished basement also provides potential for additional living space, allowing you to further customi
Introducing a sun-drenched sanctuary nestled in the heart of South End! This 648sf, South-facing, 5th fl (w/ elevator) one-bedroom dazzles with natural light, boasting a renovated bath (walk-in shower) and a rare one-bedroom with a private terrace. Vaulted ceilings (~11 ft) in the open living-dining room enhance the airy ambiance, complete with hw floors, new windows, bedroom that fits a King-size bed, in-unit laundry(vented) and central air. Enjoy the common rooftop offering incredible panoramic views of Boston. Additionally, "The Church" is meticulously maintained by professional management. This home offers unparalleled access to the area's top dining, shopping, and entertainme
Experience the charm of this thoughtfully updated four-bedroom Cape, nestled in a tranquil neighborhood setting. . This home features a cozy living room with a classic fireplace, a spacious family room with a sleek dry bar and sliders that open to beautifully landscaped yard with a patio, fire pit, and new fencing. The modern kitchen is equipped with stainless steel appliances, granite countertops, and new cabinetry, making it perfect for entertaining. The master bedroom includes built-in reading nooks and ample custom closet space. Both bathrooms have been remodeled with contemporary fixtures and stylish finishes. Additional upgrades include a new furnace, central air, tankless water heat
Welcome to 309 East Eagle Street! A single family home nestled in the heart of Eagle Hill's Neighborhood of East Boston. Overlooking Chelsea Harbor, and steps away from the American Legion Playground with baseball fields, basketball courts, soccer field, and walking trails. This two level home has a kitchen, living room, and bath on the main floor. Upstairs, you will find a generous size master bedroom with large dressing room, another good size bedroom, and a small room being used as an office. Outside of the property features a fenced in back yard with a patio, for outdoor enjoyment. This home has been in the same family for over 80 years, nicely maintained but needs updating. Lots of op
Conveniently located in the heart of Chestnut Hill is a recently renovated 2-bedroom, 1-bathroom condo. This sunny and bright condo features hardwood floors throughout and a window in every room. The condo attributes a new modern, updated eat-in kitchen with white shaker cabinets, stone countertops, and newer stainless-steel appliances. The ample bedrooms are similar in size. The condo has so many closets! Heat, hot water, 1 deeded parking space, snow removal, and grounds are included in the condo fee. The Woodside Condominium Community features an inground pool, tennis courts, barbeque area, visitor parking laundry in building and a playground. This condo is near many options for public tr
A wonderful city home: premier location, gorgeous original details in sun-filled rooms, and serene, layered outdoor space -- plus two private, income-generating apartments. Ideally located on East Broadway between L St and M Street Park, this rich and detailed 1890's Victorian features a sprawling owner's 3-bedroom triplex. Elegant living and dining rooms with marble mantels and artfully restored moldings & medallions flows seamlessly to comfortable eat-in kitchen. Great room has atrium doors that led to rear deck and fenced-in back yard with mature plantings. Second floor offers an lavish primary suite, with custom-designed walk-in closet, and large en-suite bath. The garden level ha
OPEN HOUSE SAT 4/27 & SUN 4/28 11-1PM. OFFERS DUE TUES 4/30 10AM! Don’t miss out on the opportunity to own this stunning TOP level 2 bed 1 bath condo located in a prime location in Allston! This completely renovated condo features stunning hardwood floors, bright light throughout, large living spaces and bedrooms, and its own balcony deck. New kitchen appliances and brand new windows lend unmatched convenience. Centrally located in desired Packard's Corner, this unit is just steps from the Boston University campus, Super 88 & Star Market, Allson’s wide variety of restaurants and entertainment, and easy access to Boston via the T. This location is perfect for everyon
So much to appreciate in this classic Roslindale condo with lovely period charm and a great layout. Details include warm oak floors, lustrous gumwood trimmed windows, columns, and wainscoting, and fashionably retro tile in the kitchen and bath. The gracious layout offers a welcoming entryway opening to the living room, a windows-all-around sunroom, and a formal dining room. A butler’s pantry provides a nice transition to the eat-in kitchen. Convenient storage everywhere—a dining room hutch for your china and table linens, the butler’s pantry cabinets and drawers for every kitchen need, a spice cabinet, linen closet, some built-in shelving, & basement storage. Enjoy th
Sunny fully renovated high first floor unit. Hardwood floor through-out with high ceilings, and newer windows. Two large bedrooms, with huge southeast facing windows. Newer kitchen with stainless steel appliances, granite countertops, full tiled back-splash. And a updated bathroom, deeded parking #51. Pet friendly building with live-in superintendent, coin-op laundry in basement, bike storage room and courtyard with heated outdoor pool. Super convenient location. Walk/Jog/Bike around Reservoir, walk to Brookline, Newton, Boston College, B and C lines on the T, shops, restaurants and more. A great unit for owner occupant or investor!
Introducing The Millennium Residences at Winthrop Center Penthouse Collection. 62nd floor 2 Bed, 2.5 bath home offers 12’ ceiling heights & walls of glass in every room with panoramic East Sunrise Boston Harbor, Logan, Harbor Island views & beyond that have never been seen from a private home. Finishes include Christopher Peacock kitchen & bath cabinetry, wide-plank oak floors, marble baths, custom architectural details throughout & more. Winthrop Center combines 5-star services with unparalleled luxurious residential amenities including a stunning lobby & exclusive underground lower vehicle accessed lobby for weather-free arrival and departure. 8 food &
Introducing The Millennium Residences at Winthrop Center Penthouse Collection. 61st floor 3 Bed, 4.5 bath home offers 12’ ceiling heights & walls of glass in every room with expansive East views of The City/Harbor & beyond. Finishes include Christopher Peacock kitchen & bath cabinetry, wide-plank oak floors, marble baths, custom architectural details throughout & more. Winthrop Center combines 5-star services with unparalleled luxurious residential amenities including a stunning lobby & exclusive underground lower vehicle accessed lobby for weather-free arrival and departure. 8 food & beverage opportunities, plus unrivaled live/work amenities includ
Enjoy views of the Charles River from this beautiful 2 bedroom corner unit located in a historic Back Bay elevator building. Located on the 5th floor, this unit features an ideal split bedroom layout with central AC, hardwood floors and anabundance of natural light. Both bedrooms are well proportioned with great closet space. The living area features adesirable open concept with room for a dining area in the bay window. The kitchen is updated with dishwasher, disposaland custom cabinets. The bathroom was recently updated as well. Views from every room, this unit lives much larger than it looks with all usable square footage. A short walk to many of the city's best restaurants, shops, grocer
Located in the historic Town Hill district of Charlestown and moments away from all that Boston has to offer, this beautifully designed single family home offers 3 levels of living, 3.5 bathrooms, and 3 well appointed bedrooms, each w/ custom California Closet systems. The sun-drenched, open concept main level of living is flanked w/ windows and has ample space for entertaining. The kitchen is complete w/ granite countertops, stainless appliance package including a wine fridge, abundant cabinet space, and large breakfast bar. A large living room w/ a gas fireplace completes the main level. The home has 3 dedicated outdoor spaces: a private patio, a deck off of the kitchen w/ a gas lin
Mount Vernon Street brick townhouse first and lower level condo offers two bedrooms, bonus room and two bathrooms with exclusive use patio, plus a common roof deck with expansive City, Harbor, and Monument views. Entrance is from the foyer to a living room with high ceilings, crown molding, a fireplace, wood floors, two windows with views on Mount Vernon Street. The open floor plan with a custom-built entertainment center extends to a spacious dining room with windows overlooking the patio, and a stainless kitchen with quartz countertops and a breakfast bar. Direct access to the patio, and stairs to the roof deck and access to brick path to the separate rental parking. The renovated first f
Welcome to this tastefully renovated condo. Boasting a spacious duplex layout, this residence features 3 bedrooms, a versatile bonus room, and 3 full bathrooms. The lower level hosts an inviting eat-in kitchen with a large peninsula, sleek shaker cabinets, quartz countertops, and stainless steel appliances. The open-concept design flows into the living and dining area, extending seamlessly onto your private patio. The primary suite offers ample space, stunning views, and a beautifully tiled bathroom. Hardwood floors, in-unit laundry, and a direct access exclusive use parking space enhance convenience. Enjoy proximity to top restaurants, the Orange Line, Green line, and South West Corridor.
Fully renovated penthouse condo delivers abundant style & convenience just off JP’s Southwest Corridor Park. Bright rooms with lovely views and creative design touches characterize this 2 bedroom home, such as painted bookshelves in the dining room, statement light fixtures & an arched doorway. The kitchen was completely redone in 2016 w/ new cabinets, counters, SS appliances, peninsula w/ seating, range & vent hood, plus pantry & striking accent wallpaper. Renovation also included the bathroom, new windows & electrical. Enjoy private front & rear decks with a large landing at the unit entry. 2017 overhaul of fenced-in back yard added gorgeous patio
Experience the epitome of modern luxury living in this completely renovated gem located in the highly sought after Cliff, Columbine neighborhood of Milton. Impeccably redesigned from top to bottom, this stunning residence boasts a brand new kitchen adorned with sleek finishes, and top-of-the-line appliances that elevate every culinary experience. Every inch of this home exudes elegance and sophistication. With all renovations completed within the last few years, enjoy the peace of mind that comes with knowing everything inside is fresh, new, and move-in ready. Discover your own private oasis in a well appointed primary suite complete with ample space for relaxation and rejuvenation. Enterta
BEAUTIFUL CEDAR GROVE SINGLE FAMILY. You'll feel a warm welcome in the brightly reimagined living space. A serene color palette flows from a welcoming foyer throughout a bright and airy open kitchen/dining area with elevated finishes, xl windows and into a fire placed front to back LR. A thoughtfully designed space incorporating natural elements; you'll find quartz counters, marble and granite fireplace w/ repurposed mantle & grand living space awash w/ natural sunlight, pristine hardwoods and a gorgeous deck overlooking the canopy of greenery surrounding the scenic enclave. 3 generous bedrooms w/ enviable closet space and a bonus room w/ walk up attic. The walk out basement with fami
We can’t get enough of this stunning Columbus Ave 2-bed duplex with parking in a quintessential South End brownstone. Enter into an expansive, sun-drenched living room with built-in storage and bay window bench seating. The second lower level offers a dining+kitchen area with hardwood floors, front bay, soaring 10ft ceilings, exposed brick, built in cabinetry, a beautiful modern kitchen, breakfast bar with pendant lighting, two bedrooms and an abundance of natural light. The unit’s two spacious bedrooms are in the rear of the unit, including a primary suite with walk-in closet, built-in storage, and bay windows. Other features include outrageous city views, easy-access deeded pa
This bright, sun-filled, utterly charming penthouse 2 BR/1 BA with central AC, and a private deck off the back, is near Columbus Avenue, literally a block away from the Mass Ave Orange Line T Stop. It features a very efficient floor plan with hardwood floors thru-out, a stainless/granite island kitchen w/ gas cooking that opens to living/dining area with a gas fireplace, built-ins, and a large window seat with Prudential & Hancock Tower views. The unit features a good-sized bedroom, and a smaller bonus room that works fine as an office/guest room. There is a lovely marble & tile bath with a glass enclosed subway-tiled shower/tub and a stack washer/dryer. The unit has ample close
Step into elegance and comfort with this sophisticated two-bedroom, two-bath oasis on Mystic St! Boasting an open living space, this pristine home is adorned with exquisite details, from its towering ceilings with tray and cornice accents to its recessed lighting and chair rail. Relax in the elegant living room, complete with a gas fireplace and built-in shelving, or entertain in style in the lovely dining area. The updated, professional kitchen is a chef's dream, featuring tall white cabinetry, Quartz countertops, and new Bosch stainless steel appliances. Retreat to the gracious primary suite, offering two custom closets and a luxurious bathroom with double vanities, whirlpool tub &
Introducing this stunning Philadelphia-style two-family home, now available in the vibrant Dorchester Center neighborhood. Boasting an expansive 4,000+ square feet of living space, this property perfectly blends modern amenities and classic charm. This home features central air conditioning, a private driveway, and garage parking, ensuring convenience and comfort for residents and guests. The modern updates in the bathrooms, including marble tiling, flooring, and new fixtures, add a touch of luxury to the living experience. Unit one, duplex comprises 4 sizeable bedrooms and two bathrooms, one recently renovated to exude elegance and style. Hardwood flooring runs throughout, complementing th
Discover the best of urban living at 39 Gaston Street, where timeless charm meets modern convenience. Nestled on the Dorchester/Roxbury line, this meticulously maintained two-family home offers a unique opportunity to experience the vibrant energy of city life while enjoying the comforts of home. As you approach the property, you'll be captivated by its classic architecture and beautiful details. Stepping inside, you'll find a spacious one-bedroom apartment on the first floor, perfect for cozy living or as an investment opportunity. Upstairs, a stunning four-bedroom duplex awaits, spanning the second and third floors. With large rooms throughout, this home offers ample space for relaxation
THE ULTIMATE LOFT SPACE! Located in the newly converted Allston Hall, this two bedroom/two bath loft boasts 2 levels of living space with 18' ceilings, distinctive Palladian windows and city views! The main floor features a large L shaped kitchen with Bosch appliances, gray + white cabinets and a seating island. The kitchen opens to a bright and airy living + dining area with those 18' ceilings. This level also has a primary bedroom suite with dramatic ceiling heights and distinctive triple windows as well as a guest bathroom. Upstairs is a mezzanine area which overlooks the floor below. It is perfectly suited for a home office, lounge and/or 2nd bedroom. Laundry and a large closet round t
BOSTON'S COOLEST NEW ADDRESS! The anchor of the new Allston Square development, ALLSTON HALL is a historic 1890’s Queen Anne which has been transformed into 10 loft-style condominiums with soaring ceiling heights and enormous windows. Unit #202 has 12' ceilings, 8' window heights and a smart open floorplan with a separate bedroom. Finishes throughout have a crisp and modern feel with engineered oak floors and a contemporary white and gray kitchen with Bosch appliances and an island! The bathroom features large format wall tiles, hexagon floor tiles, a soaking tub and matte black Kohler plumbing fixtures. The bedroom is a nice size with two huge windows. In unit laundry rounds it out.
ATTENTION INVESTORS & CONTRACTORS. Rare opportunity to own a great two family home in Dorchester! Units have large bedrooms, living and dining rooms!! BIG 6430 square foot lot with plenty of off street parking! Lots of new development next door and across the street. It is conveniently located close to public transportation Talbot Ave Station Commuter Rail for easy access to downtown Boston & Cambridge. Centrally located to area amenities such as Franklin Park & shops and stores. . Lots of off street parking and a full basement!! Being sold "as-is. Finished walk up third floor. Lots of potential. Property being delivered with second floor tenants but scheduled to vaca
Rare offering of a gorgeous, sun-filled corner condominium at the coveted Wilkes Passage in the heart of the South End. This contemporary home offers two spacious bedrooms, a separate study and two full baths. Enjoy the expansive living/dining space with high ceilings, large picture windows and dramatic views of the Cathedral. Proudly entertain from the open, fully-applianced, modern kitchen with a breakfast bar and a large custom pantry. The master bedroom comes with an en-suite bath and ample closet space. The landmark building has 24-hour concierge, on-site management, a large shared courtyard and a rooftop terrace with spectacular views, all steps from some of the finest restaurants, ca
DUPLEX LOFT! Located in a converted 1890’s Queen Anne building called Allston Hall, with easy access to Harvard, BC and BU, this top floor loft has two levels of living space and 18' ceilings! An entry foyer leads to a dramatic open floorplan living, dining + kitchen area with distinct Palladian windows. Finishes throughout have a crisp and modern feel with engineered oak floors and a contemporary white and gray kitchen with Bosch appliances and a large seating island. The bathroom boasts large format wall tiles, hexagon floor tiles, a soaking tub and matte black Kohler plumbing fixtures. There is also an office nook on this floor. Upstairs is a spacious mezzanine level bedroom overlo
LOFTS! The anchor of the new Allston Square development, Allston Hall is a historic 1890’s Queen Anne which has been transformed into 10 loft-style condominiums with soaring ceiling heights and enormous windows. Unit #201 has 12' ceilings, 8' window heights and a smart open floorplan with separate bedroom and home office space. Finishes throughout have a crisp and modern feel with engineered oak floors and a contemporary white and gray kitchen with Bosch appliances. The bathroom features large format wall tiles, hexagon floor tiles, a soaking tub and matte black Kohler plumbing fixtures. The bedroom is a nice size with two huge windows and a walk-in-closet. A separate office nook and
Prominently located in a premier South End neighborhood at the intersection of the Back Bay, this turn-key and sun-drenched two bedroom corner unit with garage parking is a must see. The unit underwent a recent renovation with new wood floors, new kitchen, including Bosch appliances, tile floor, plenty of modern cabinets and quartz countertop space, tile backsplash, along with a new bathroom that includes a glass enclosed tile shower. Surrounded by windows, enjoy unobstructed panoramic views from this spacious unit looking out above the neighboring rooftops, or step outside and relax on your sunny private balcony accessed directly from the unit. The modern unit is complete with a working wo
Newly renovated 3 bedroom, 3 bathroom first & garden duplex, steps from the Monument. Your private entry leads into an open, inviting living area with high ceilings, a gas fireplace and custom built-ins. The dining area features a dramatic picture window overlooking the private patio with a hot tub - ideal for entertaining. Adjacent kitchen showcases a sprawling island with ample bar seating, beverage refrigerator and Thermador appliances. Versatile main floor bedroom includes a custom murphy bed & desk, along with a walk-in California closet. Downstairs is the king-size primary bedroom with ensuite bath and custom closet, as well as a smaller ensuite bedroom - perfect for a nur
Welcome to The Residences at the St. Regis. Embrace unobstructed views of Boston Harbor through floor-to-ceiling Air Lux windows in this 2-bedroom jewel. Masterfully built and customized - the current owners expertly curated numerous upgrades making it unmatched to others. Live out your culinary dreams with a kitchen boasting Wolf & Sub-Zero appliances, marble countertops and bespoke Italian cabinets. An adjacent custom bar room is romantic and perfect for entertaining. Primary suite has a spa-inspired bath with radiant floors, dual closets and custom built-ins. A guest bedroom or office offers captivating harbor views and its own en-suite bathroom. Seamlessly integrated Josh AI smart
Welcome to your oasis of comfort and convenience in the vibrant North End! This meticulously updated 2-bedroom condo resides in a charming 10-unit, professionally managed elevator building, surrounded by acclaimed restaurants and bars. Spanning 850 SqFt. , experience the epitome of penthouse living, bathed in natural light. Contemporary polished concrete flooring harmonizes with the sleek quartz island, stainless steel appliances, gas cooking, and central air for a seamless blend of style and functionality. Indulge in the spa-like bathroom featuring a luxurious walk-in steam shower, accompanied by a soothing rain shower-head and elegant mosaic tile surround. Just moments away, the communal
This area's enrollment policy is not based solely on geography. Please check the school district website for more information.
Elementary schools
Middle schools
High schools
GreatSchools Summary Rating
10/10
Mary Lee Burbank School
Public, K-4
10/10
Winthrop L Chenery Middle School
Public, 5-8
10/10
Butler Elementary School
Public, K-4
10/10
Benjamin G. Brown School
Public, K-5
9/10
Haggerty School
Public, PreK-5
Only showing 5 of
100+ elementary schools.
School data is provided by GreatSchools, a nonprofit organization. Redfin recommends buyers and renters use GreatSchools information and ratings as a first step, and conduct their own investigation to determine their desired schools or school districts, including by contacting and visiting the schools themselves.Redfin does not endorse or guarantee this information. School service boundaries are intended to be used as a reference only; they may change and are not guaranteed to be accurate. To verify school enrollment eligibility, contact the school district directly.
Homes for sale in Boston have a median listing price of $992K. Some of these homes are Hot Homes, meaning they're likely to sell quickly.
What are some of the most popular neighborhoods in Boston?
Popular neighborhoods include South End, Hyde Park, Dorchester, Jamaica Plain, Roslindale, South Boston, Brighton, Charlestown, Back Bay, and West Roxbury.
How often does Redfin update their new listings?
Most of our new listings in Boston are updated every 5 minutes so you can see new homes as soon as they come on the market. Learn more
What is transportation like in Boston?
Boston, Massachusetts boasts a robust public transportation system, known as the Massachusetts Bay Transportation Authority (MBTA), which includes buses, subways, and ferries. The city's intricate network of roads and highways, such as the Massachusetts Turnpike and Interstate 93, provide ample routes for car travel. However, Boston is notorious for its high traffic levels, making driving a challenging option during peak hours. Despite this, the city's comprehensive transportation options ensure residents can navigate the city with relative ease. Learn more on our Boston city guide.
What types of properties are available in Boston?
Boston, Massachusetts offers a variety of single-family home types, including ranch-style homes, colonial-style homes, contemporary-style homes, and Victorian-style homes, among others. These homes can be found in various neighborhoods throughout the city, such as Back Bay, Beacon Hill, South End, and Charlestown. Most properties in Boston have multiple bedrooms and were built in different years, providing a range of options for homebuyers. To explore different property types for sale in Boston, Massachusetts, use the 'Home type' filter located above the active listings. Customize your search by selecting options like single-family homes, condos, townhomes, and more.
What is life like in Boston?
Living in Boston, Massachusetts offers a vibrant urban experience with a mix of historic and modern architecture. The city is surrounded by a diverse natural landscape, including parks, rivers, and coastal areas, providing opportunities for outdoor enthusiasts. The weather in Boston varies throughout the year, with hot summers and cold winters, allowing residents to experience all four seasons. The city boasts a strong job market, with opportunities in industries such as finance, healthcare, education, and technology. Boston offers a wide range of cultural activities, including museums, art galleries, theaters, and a thriving food scene, ensuring there is always something to do for residents.
What are the schools and amenities like in Boston?
Boston, Massachusetts is a city rich in public amenities designed to cater to the diverse needs of its residents. The city boasts a plethora of restaurants offering a wide range of cuisine to satisfy any palate. Numerous parks are scattered throughout the city, providing serene spaces for relaxation and outdoor enjoyment. Grocery stores are conveniently located in various neighborhoods, ensuring residents have easy access to fresh produce and other necessities. Additionally, Boston offers a variety of other amenities such as libraries, fitness centers, and museums, enhancing the quality of life for those who call this city home.
In the past month, 341 homes have been sold in Boston. In addition to houses in Boston, there were also 1195 condos, 92 townhouses, and 152 multi-family units for sale in Boston last month. Boston is a fairly walkable city in Massachusetts with a Walk Score of 83. Boston is home to approximately 616,228 people. Find your dream home in Boston using the tools above. Use filters to narrow your search by price, square feet, beds, and baths to find homes that fit your criteria. Our top-rated real estate agents in Boston are local experts and are ready to answer your questions about properties, neighborhoods, schools, and the newest listings for sale in Boston. Our Boston real estate stats and trends will give you more information about home buying and selling trends in Boston. If you're looking to sell your home in the Boston area, our listing agents can help you get the best price. Redfin is redefining real estate and the home buying process in Boston with industry-leading technology, full-service agents, and lower fees that provide a better value for Redfin buyers and sellers.


 REDFIN IS COMMITTED TO AND ABIDES BY THE FAIR HOUSING ACT AND EQUAL OPPORTUNITY ACT. READ REDFIN'S FAIR HOUSING POLICY AND THE NEW YORK STATE FAIR HOUSING NOTICE.
 United States
 Canada