Welcome to this beautiful 3 bedroom, 2 bath Sunnyvale house on a large corner lot, within a short commute to Google, Apple, Meta, Amazon, Nvidia, and many other top Silicon Valley tech companies! Enjoy abundant natural sunlight throughout, and a spacious front yard and backyard ready for your personal touch. The living room with high ceilings flows naturally to the open concept dining area, and gourmet kitchen. The home boasts an abundance of amenities, including central air conditioning and heating, new flooring, new kitchen cabinets, new quartz countertops and backsplash, new stainless-steel appliances, new interior and exterior paint, newer roof (2022), and much more! Lakewood Park and
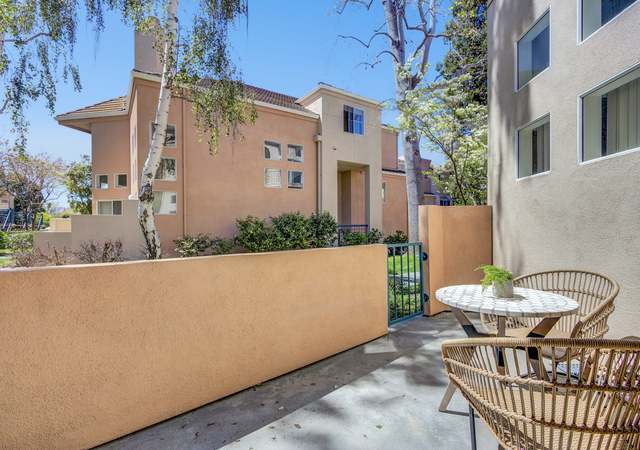
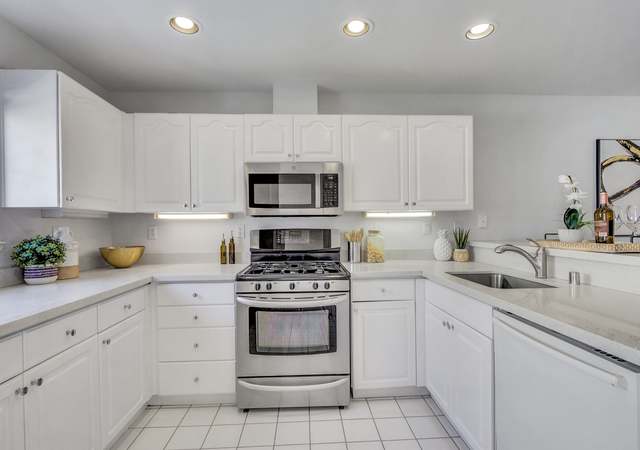
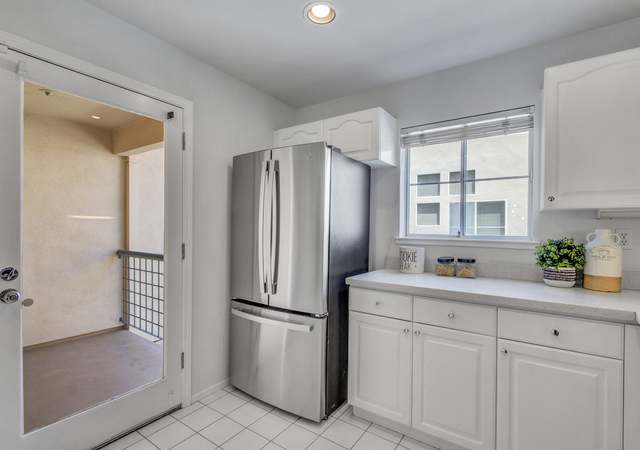
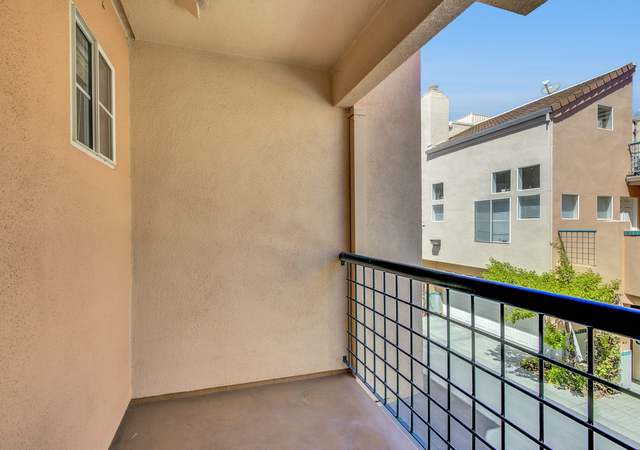
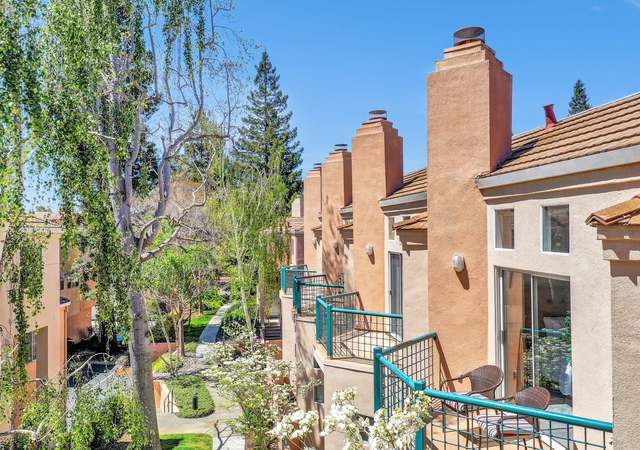
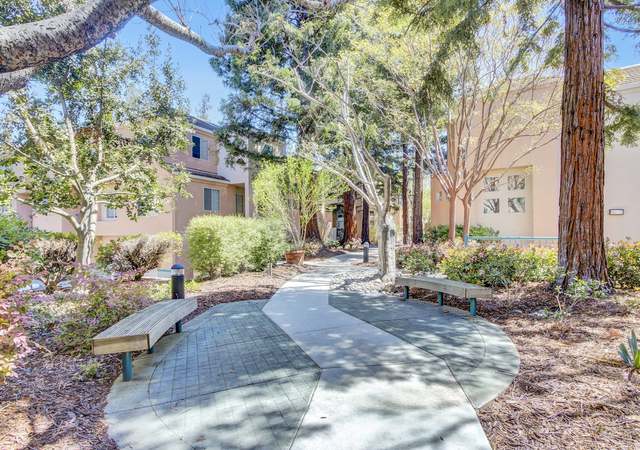
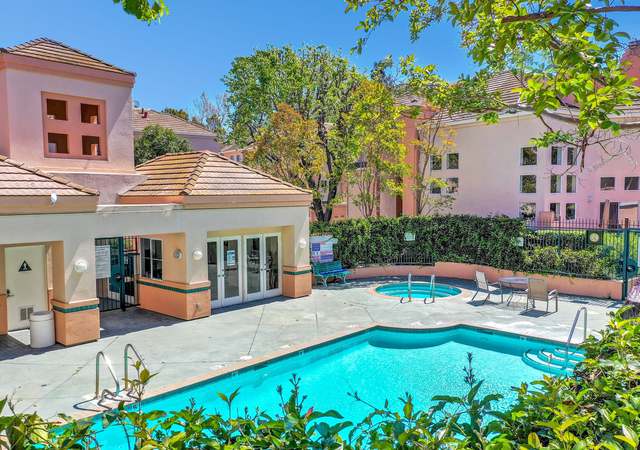
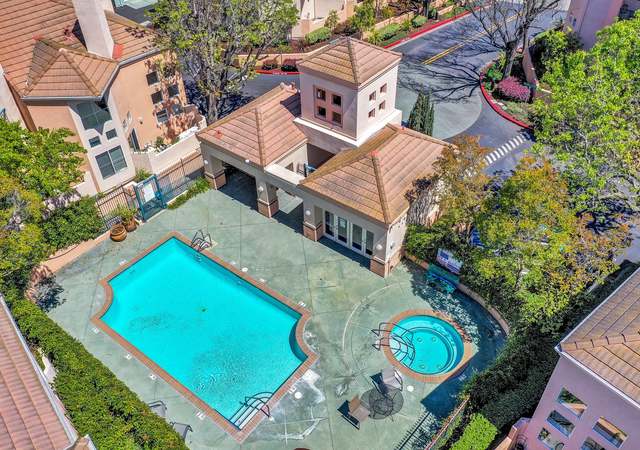
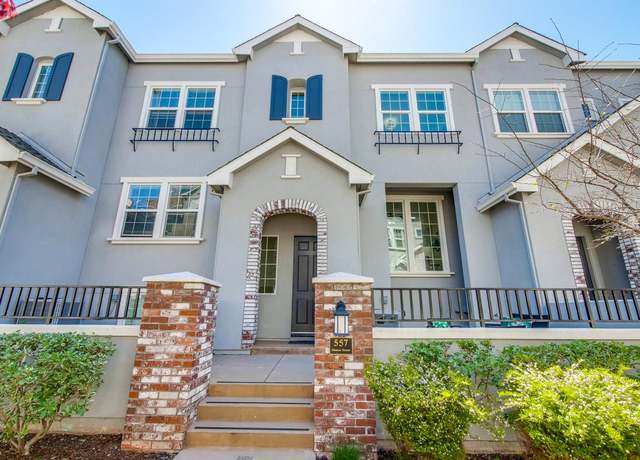
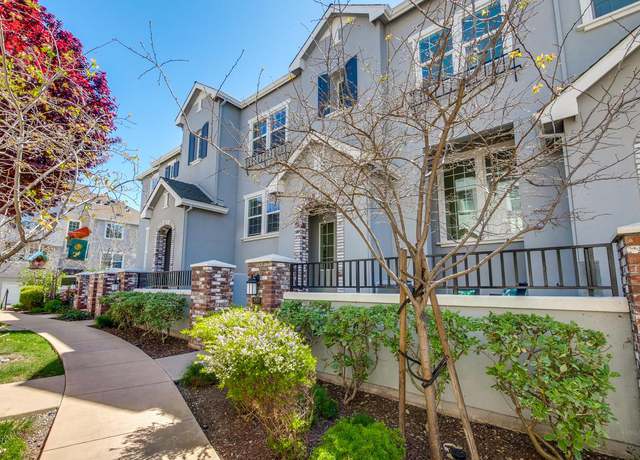
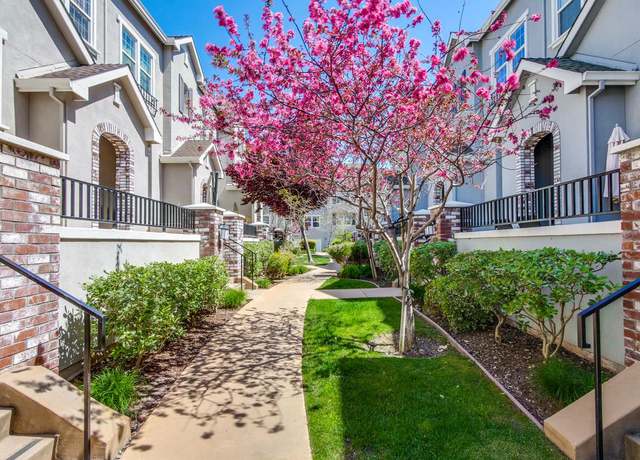
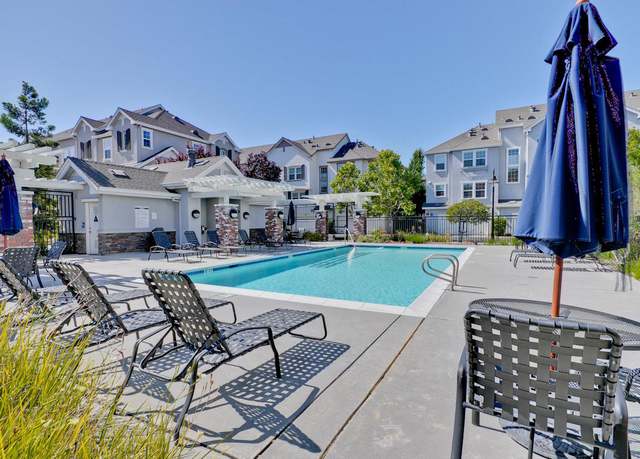
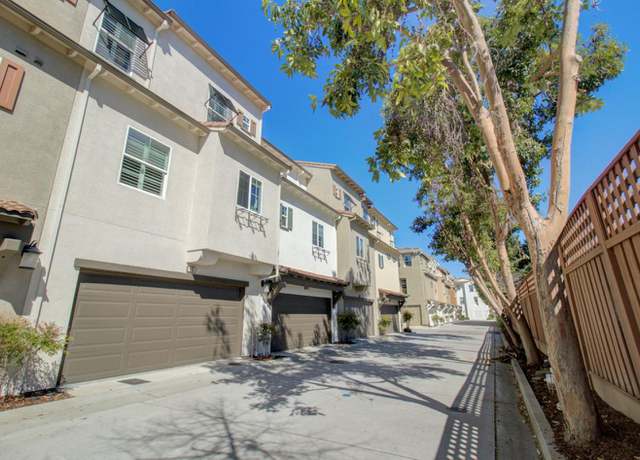
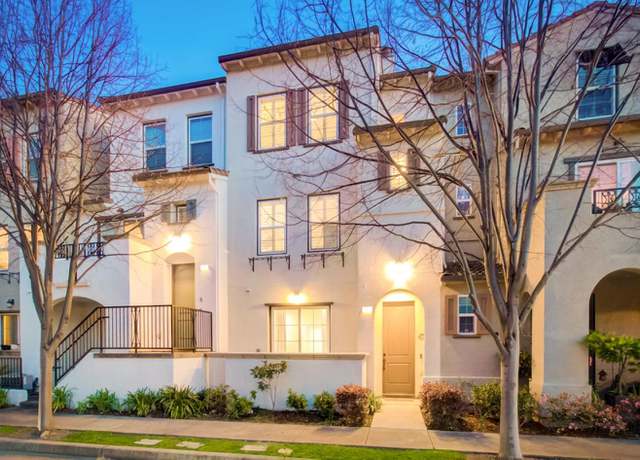
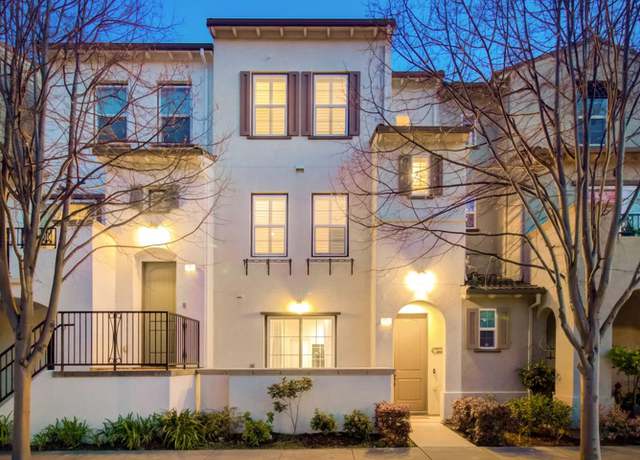
Enjoy an abundance of natural light in this elegant tri-level townhome with modern appeal. Featuring two bedroom suites on the upper level, high ceilings in the main living area, and a main level patio along with two additional balconies, this residence ensures ample private outdoor space. Sunnyvale's meticulously maintained Expressions community features amenities like swimming pool, spa, walking paths and benches, park-like greenery with mature redwood trees, and a playground. Immerse yourself in our extensive photo gallery, with 3D walk-through, and 360-degree exterior panoramas for an intimate virtual visit. With an attached one-car garage plus an additional storage room behind the gara
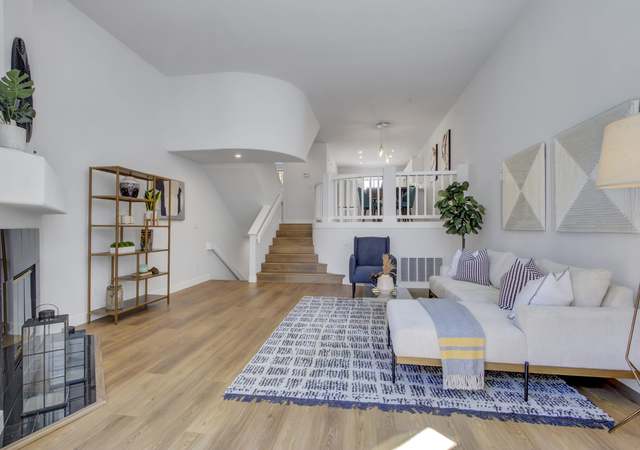
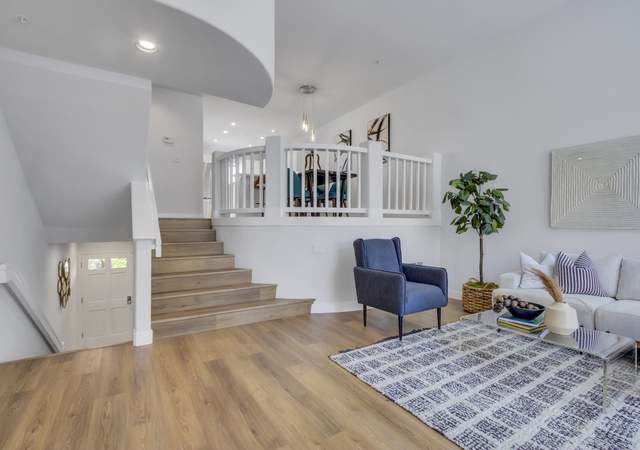
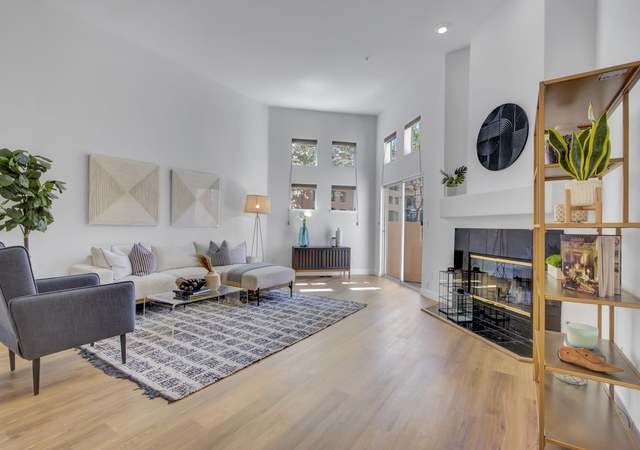
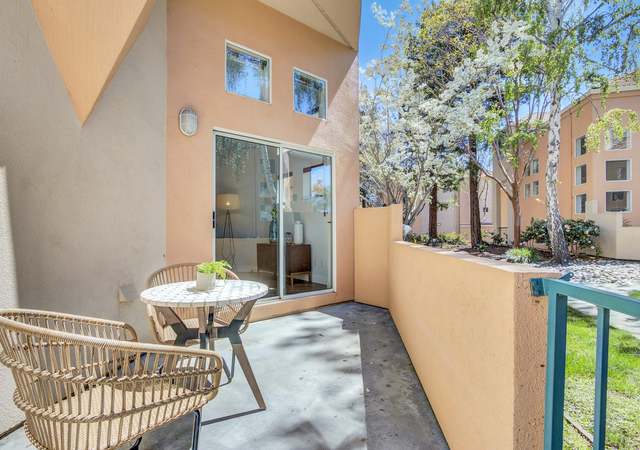
Welcome to Cupertino premier townhome community. End unit. Wide open living spaces w/ vaulted ceiling, large dining area and generous sized kitchen overlooking a cozy fireplace flanked by 2 sets of sliding glass doors w/ private flagstone patio and tree top views. Well-designed kitchen w/ quartz counters and dining bar offer space to prepare food, serve and entertain. Fresh new paint. laminate flooring throughout. Only 7 steps to good sized bedrooms, 2 baths, ensuite w/ double closet and balcony access. 2 car garage, plenty of guest parking. Well maintained, resort-style community amenities: park-like open spaces/trails, clubhouse w/ gym/2 rec rooms, pool table/ping pong, 2 pools, sauna, te
Beautifully updated home located in one of Sunnyvale's most popular all-age communities! This home offers a large living room with a separate formal dining room and a sizable eat-in kitchen. As soon as you enter, you are greeted with high ceilings, gleaming laminate floors, and large windows allowing tons natural light. The eat-in kitchen showcases granite countertops, wooden cabinets, and stainless-steel appliances is ideal for culinary enthusiasts. The primary bedroom is a sanctuary of relaxation with an en-suite bathroom showcasing double vanity and updated newer shower. Two additional bedrooms are generously sized, perfect for a home office, workout room, or simply another area to relax
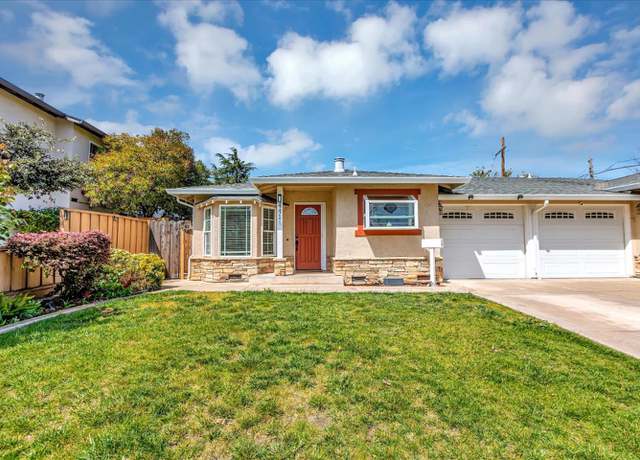
Open house Sat & Sun 1:30-4:30pm. Gorgeous one story single family house with 3 beds 2 baths located in a quiet & well- established neighborhood. Hardwood floor throughout. Open floor plan features spacious family room with wood burning fireplace. Other features include remodeled bathrooms, double pane windows, copper plumbing, auto sprinkler and central AC system. Walk to Panama park, Ortega Park & elementary school. Excellent schools: Stocklmeir Elementary/Cupertino Middle/Fremont High (buyer to verify). Very convenient location easy access to Hwy 280, 85, Lawrence Exp, Apple park, Cupertino Village, Main street, restaurants & shopping. Well-maintained. Move in con
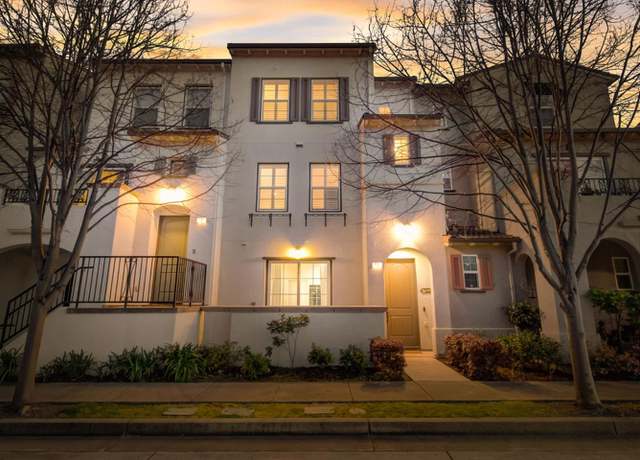
Welcome home! Step into luxury living at its finest with this stunning 2-year-new, 2-bedroom, 2.5-bath spacious condo. This beautiful residence offers a perfect blend of modern elegance and comfort, providing an exceptional living experience. As you step inside, you're greeted by an abundance of natural light through expansive windows and high ceilings, illuminating the open-concept living space. The thoughtfully designed floor plan seamlessly integrates the living, dining and kitchen areas, creating an inviting atmosphere for both relaxation and entertainment. The gourmet kitchen is a chef's dream, featuring high-end appliances, sleek countertops, oversized island and ample storage space.
Newly remodeled in 2024 (photos of remodeled interior to be posted soon), move-in ready END UNIT Sunnyvale townhouse in the most coveted location in the complex, quietly nestled amongst a grove of redwoods far from the main street, yet just a short walk to Ponderosa Park, several schools, and the multitude of dining options on El Camino Real and Wolf, a short bike ride to Apple Park, and central to the South Bay's largest employers and commute routes. Ideal for hosting guests, the natural light-filled main level features a newly-updated open kitchen with quartz countertops and backsplash which flows seamlessly into the open living room. Both bedrooms are ensuites, with the top-level master
Discover this beautifully appointed Sunnyvale gem and the ideal blend of Silicon Valley convenience and suburban charm. Rebuilt in 2006 with a fresh update in 2018, this spacious 3-bedroom, 2-bathroom home boasts a stunning transformation and is in pristine condition. Enjoy a bright and airy atmosphere thanks to the high ceilings throughout the home, ample natural light from skylights, with elegant touches like crown molding, recessed lights, and cherry hardwood floors in the kitchen/living/dining area. The modern and open floor plan highlights a chefs kitchen with Brazilian cherry cabinets and granite countertops, a convenient breakfast bar, cozy fireplace, and luxurious finishes including
Beautifully Remodeled Single Story Home in Highly Sought After Pondersoa Park. Nestled in a quiet street within walking distance to Ponderosa Elem School, this updated home offers gourmet kitchen with Granite Counters, Designer White Cabinetry & chef's stainless steel appliances; Large living room with vaulted ceiling, formal dining room; 4 spacious bedrooms & 2 luxuriously updated baths. Excellent Open & spacious nook & family room combo with wood-burning fireplace & large sliding patio doors overlooking private backyard. The thoughtfully upgraded interior features LED recessed lighting, luxurious vinyl plank floors, elegantly remodeled bathrooms featuring cust
Welcome to your private ground floor end-unit in a convenient Sunnyvale locality! Situated in the heart of Silicon Valley near many tech companies including Google, Apple & Linkedin! Step inside to a beautiful open concept great room flooded with natural light. Boasting a gourmet kitchen with custom cabinetry, stainless appliances & large kitchen peninsula. The spacious ensuite bedrooms are aptly located on either side of the living areas and feature ample closet space & updated bathrooms. Equipped with In-unit laundry & finished garage, custom interior doors, central HVAC, recessed lighting & airy 9-foot ceilings! Newly built by KB homes built just 9 years ago
Discover comfort & luxury right in the heart of Sunnyvale. Tucked away on a vibrant neighborhood road, youll find this updated 1,706 sq ft residence. From recessed lighting to durable, planked flooring, this 4BR/3BA home provides the perfect opportunity to relish in contemporary flair. The galley kitchen offers a sunny breakfast nook, chic backsplash, & stainless steel appliances, while the large living room provides plenty of room to unwind or entertain. Appreciate a home office adorned w/ built-in shelving thats revealed by charming French doors, & impress guests w/ 2 dazzling guest bedrooms coupled w/ a stylish hall bath. The stately primary suite boasts a private bathroo
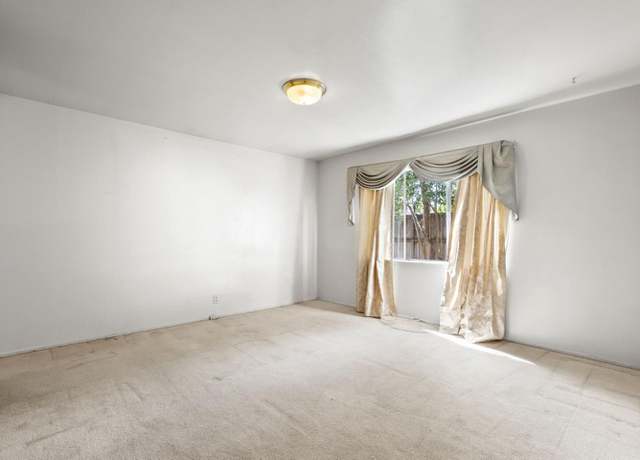
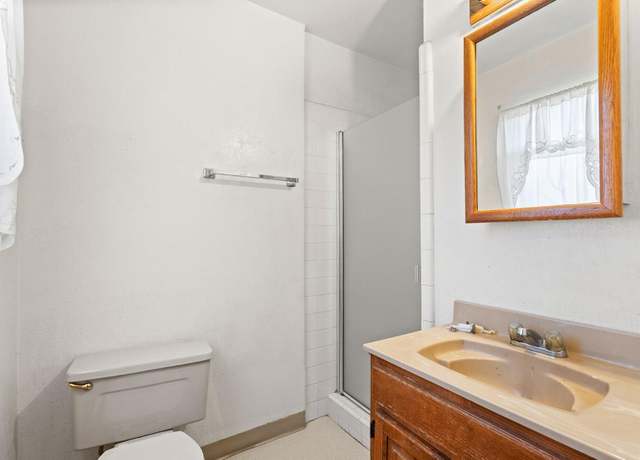
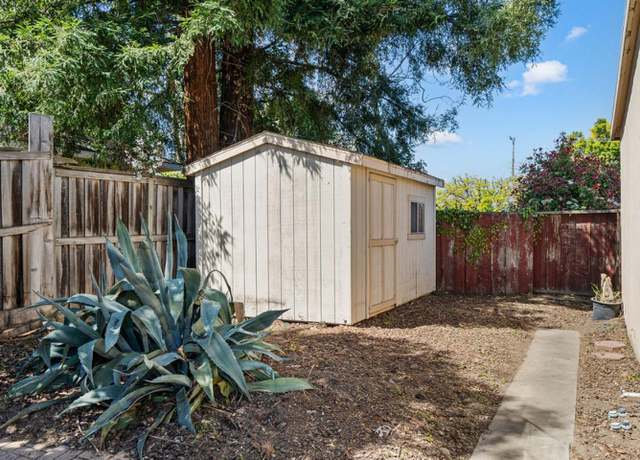
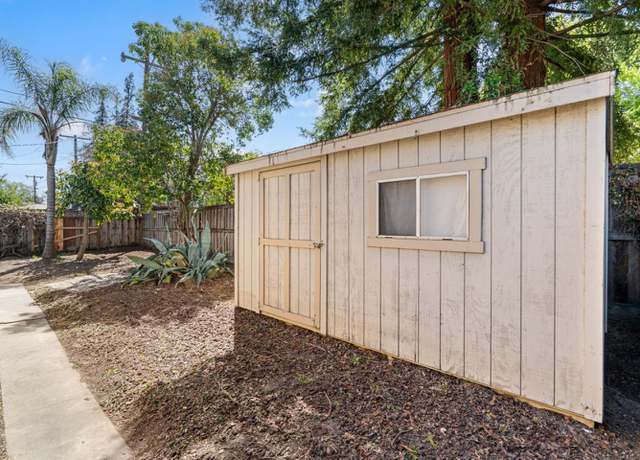
Check out this 1969 home in the community of Adobe Wells. It is approx. 1,040 sqft with 2 bedrooms and 2 bathroom. Living room has carpet. Dining area has carpet, ceiling lights and displayed cabinets. The Kitchen features a refrigerator, dishwasher, oven, garbage disposal, ceiling light and linoleum flooring. Master bedroom has carpet and a mirrored closet. Guest bedroom has carpet. Master bathroom has a standing shower, cabinets and linoleum flooring. Guest bathroom has tile backsplash, linoleum flooring, tub and shower. Backyard has 2 sheds and a BBQ area. Washer/ Dryer included and central heat. Home is located within distance to restaurants, shopping centers, Levi Stadium and major fre
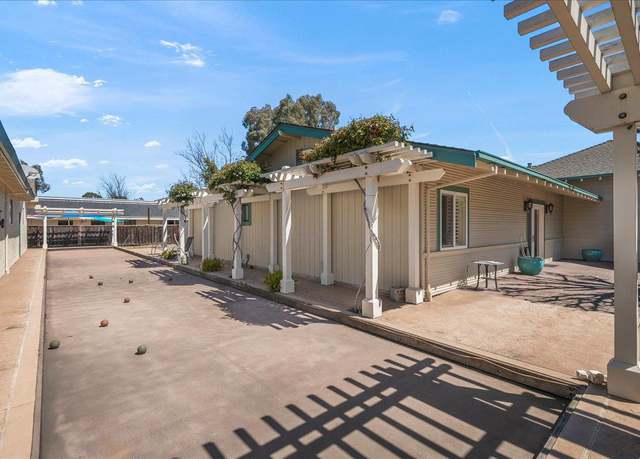
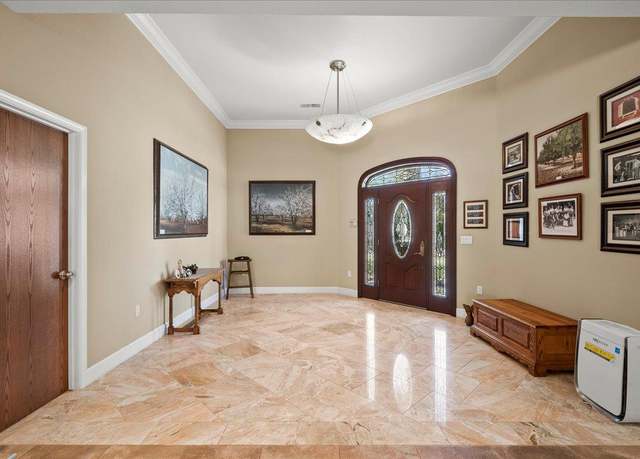
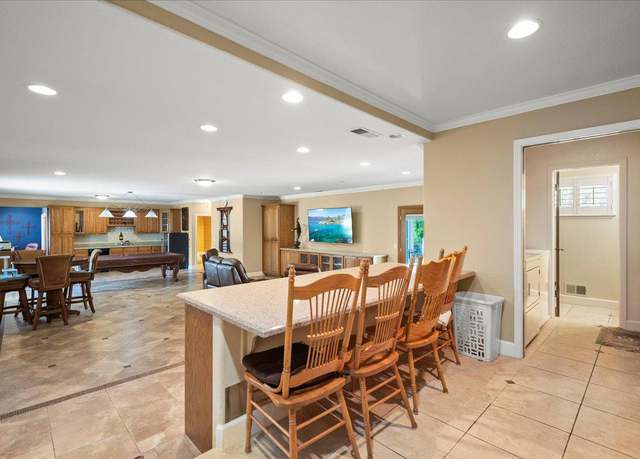
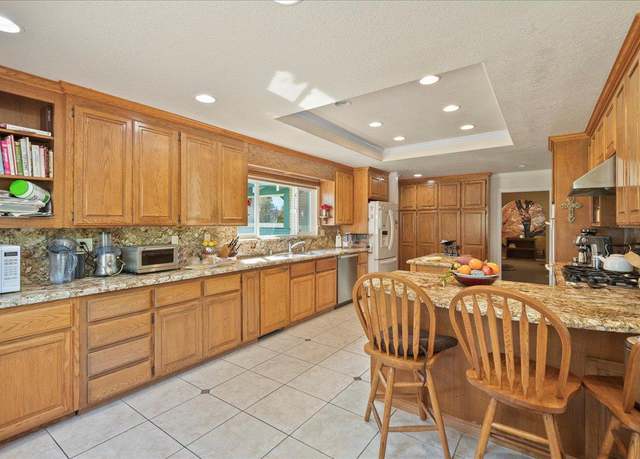
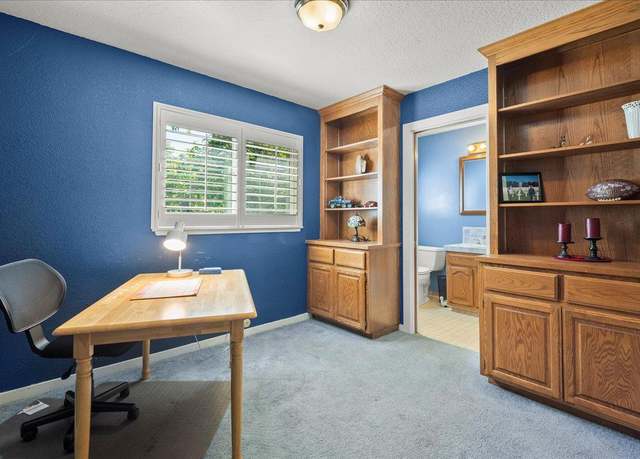
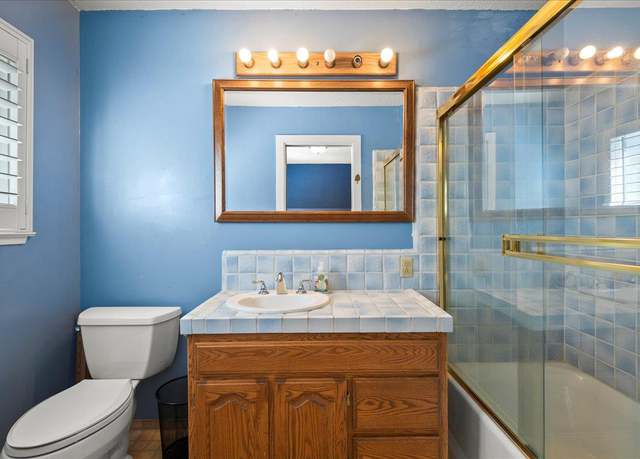
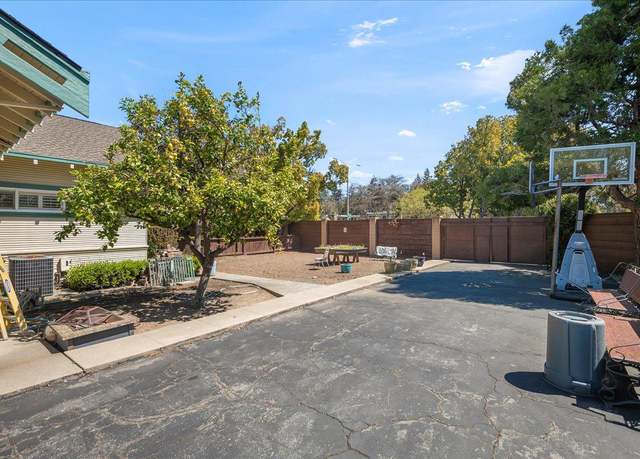
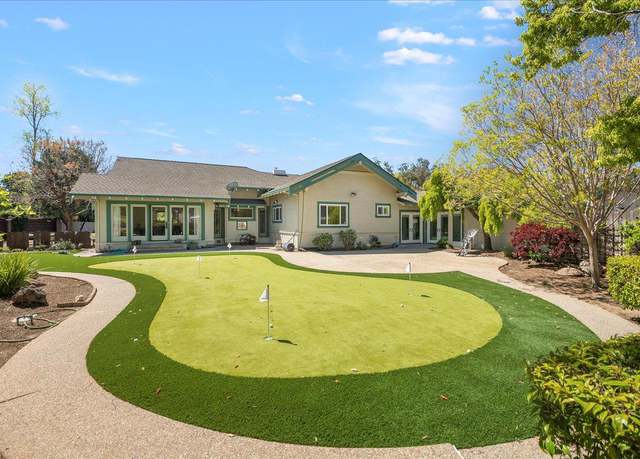
Nestled behind a gated entrance, this 1950s Urban farmhouse oasis boasts two separate homes. Ideal for a multi-generational family, on almost an acre, with and the potential to create your own compound. R-2 zoning Possible 11-unit development * buyer to verify with the City of Sunnyvale planning department. The main residence spans 4,458 square feet on a 23,087 square foot lot with 5 bedrooms and 5.5 bathrooms. Sprawling outdoor space with a putting green and bocce ball court, and a luxurious primary suite with Pella French doors opening to the rear grounds. Ensuite bedrooms offer versatility, including one perfect for an office and another with its own private entrance. Huge great room w
Beautiful New interior 2 bd/2 ba home in a senior community (55+) You will absolutely love this double wide home that has been completely refreshed including a brand new kitchen, new appliances, new walls, paint, fixtures, flooring, both bathrooms, and so much more! The gorgeous free standing tub is amazing. Just bring your toothbrush! This home is in an upscale, quiet, and peaceful community. Near Levi's Stadium, shops, and restaurants. A must see!
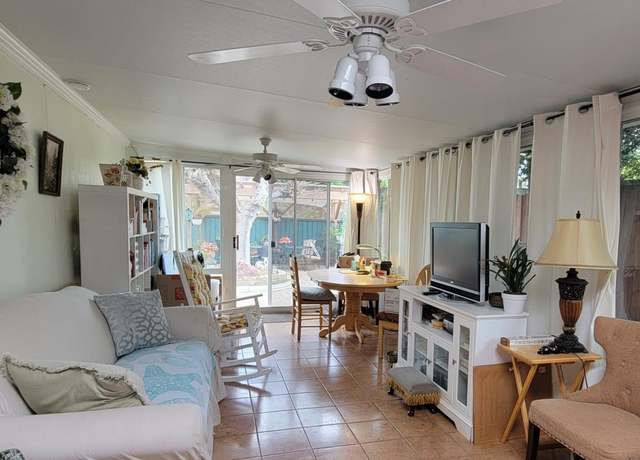
Nestled behind a gated entrance, this 1950s Urban farmhouse oasis boasts two separate homes. Ideal for a multi-generational family, on almost an acre, with and the potential to create your own compound. R-2 zoning Possible 11-unit development * buyer to verify with the City of Sunnyvale planning department. The front house with 2 bedrooms, 2 bathrooms, and 2,785 square feet of living area on an expansive 17,860 square foot lot. A standout feature is the provision of seven individual garages, capable of accommodating up to 16 cars. The enclosed sun porch connects to kitchen through sliding glass doors. Additional features of the home are two fireplaces, a great room/flex with grand vaulte
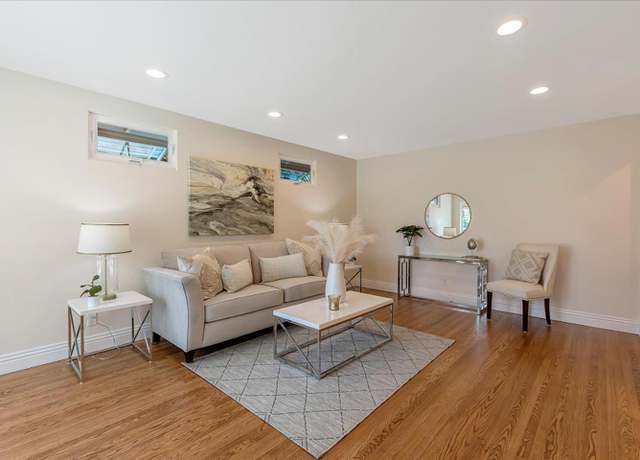
Welcome to this updated, spacious home with beautiful details! You'll love the curb appeal with a crisp lawn, pleasant flowers, & new exterior paint. Upon entering, you'll be greeted by refinished hardwood floors that flow between rooms, new interior paint with stylish accent walls, recessed lighting, & large windows! Easily prepare meals in the modern kitchen with quartz counters & backsplash, stainless steel appliances, & pristine white cabinets. Both bathrooms are beautifully updated & feature stunning new vanities. Relax in the delightful backyard with a patio, verdant lawn, mature tree for shade, & pops of colorful flowers. Highly-sought-after location l
Welcome to Danbury Place, stylish living awaits in this desirable townhome, boasting a prime location. This charming townhome, meticulously maintained and move-in ready, versatile open floor plan with large 1554 sq. ft of living space offers 3 bedrooms and 2.5 bathrooms. Beautifully upgraded interior with new paint, premium carpet, and stunning tile flooring, modern comfort with crown molding, high ceilings, recessed lighting and tons of natural light. Well-designed kitchen with fresh painted wood cabinets, granite countertops and stainless-steel appliances, and an abundance of cabinets for convenient storage. Unwind in the oversized primary suite, complete with a generous walk-in closet, d
Welcome to 1043 Eugne Ct! Nestled at the end of a cul-de-sac in the coveted West Valley neighborhood of Sunnyvale, this well-maintained single-story home offers an ideal floorplan w/ 4beds, 3baths & 1,954 sqft of living space on an expansive 10,500 lot. Upon entering the home, you'll be greeted with/ an abundance of natural light illuminating the interior from every corner. The well-designed floor plan seamlessly combines the LR & dining area, both of which have sliding doors opening onto the serene backyard - great for indoor/outdoor living. The chef's kitchen is complete w/ a DCS gas range, SS appliances, built-in wine fridge, ample hickory cabinetry, expansive countertops, is
A towering beauty, this striking 2-story home is cradled within a tranquil courtyard, just a stone's throw from the vibrant pulse of downtown Sunnyvale. Inside, discover a warm and inviting open floorplan, where lofty ceilings adorned with recessed lighting illuminate brand new laminate and carpet flooring. Natural light pours in through a multitude of dual pane windows/skylights, while a fresh coat of paint graces both interior and exterior walls. You also have a family room, laundry room with washer/dryer, attic, heat/AC and fireplace. Updated gourmet kitchen is a culinary delight, boasting new high-end stainless steel appliances, quartz countertops, ample cabinet space, and breakfast bar
Charming Mediterranean home ideally situated in the sought-after downtown area of Sunnyvale! Short walk to Murphy Street with variety of shopping/dining, the farmers market, Whole Foods, AMC Theater, Target and so much more. Caltrain station just around the corner for easy commute. Perfect starter home with endless potential in a vibrant location. 1-car detached garage. * NOTE * This fantastic lot has special zoning and may be an exceptional investment opportunity - learn more about The Downtown Specific Plan!
This Gorgeous fully Detached single-level property is a truly rare find!" there is only one adjoining Garage wall" with a very large private enclosed yard perfect for gardening and intertaining, it offers the feeling of a single family home. Walking distance to beautiful Serra park, shopping, restaurants, Homestad High School. Nearby Apple Park and many other tech companies. Exceptional commute location near the Cupertino & Los Altos borders! New Garage door/openner, Newer double-pane windows, central A/C, lovely master suite with vaulted ceiling, attached two-car Garage is conveniently located right off the kitchen. exceptional Cupertino Schools! West Valley Elementary, C
Modern & move-in ready home tucked away on a quiet street in one of Sunnyvale's finest neighborhoods! Excellent schools including Cumberland Elementary, Sunnyvale Middle, & Homestead high! Exceptional floor plan featuring a separate living room, family room, & dining area, as well as a spacious primary suite, & an office nook. Gorgeous kitchen which boasts custom maple cabinets, Soapstone countertops, tiled backsplash, recessed lights, filtered water, & high-end Stainless-Steel appliances including a SubZero fridge w/ ice maker, Wolf gas cooktop, & Vent-A-Hood Exhaust! Updated bathrooms w/ custom vanities providing plenty of room for storage, Soapstone counter
Location, location, location! This six bedroom, three bath single-family home in Sunnyvale, CA just a few blocks from Apple boasts approximately 1,883 square feet of living space. Enjoy an open kitchen featuring granite counters and hardwood floors flowing throughout the home. The 6,464 square foot lot is fenced in both the front and back yards for added privacy. Enjoy the convenience of being close to shopping, Kaiser, and local freeway access. Located in the Santa Clara Unified School District with great schools nearby including Laurelwood Elementary, Peterson Middle, and Wilcox High.
Enviably set in the heart of downtown Sunnyvale, this captivating 3-bed, 2.5-bath residence is a must-see! Towering trees, verdant foliage, and white picket fencing all lend to this delightful abodes storybook appeal. Fall in love with a bright, open interior where sunlight streams through expansive windows, filling the soaring ceilings over the fireplace-warmed living room. The kitchen is replete with stainless steel appliances, ample cabinetry, a pantry, and gleaming countertops. Retire to the comfortable bedrooms upstairs, where the generous primary suite features bay windows, a walk-in closet, and a refreshing ensuite. Notables include a side patio and a large, built-in 2-car garage. Wi
A rare gem on Tasman Dr. in Sunnyvale features a charming 2 bed, 2 bath manufactured home which offers convenience and comfort. Recently upgraded with engineered vinyl wood flooring and fresh exterior painting, completed within the last 6 months, enhancing aesthetic appeal and durability. Enjoy cozy warmth during chilly evenings with central heating ensuring year-round comfort. Meticulously maintained home, ensuring a worry-free lifestyle and minimizing upkeep costs. The added front patio is a wonderful spot for an afternoon delight. A spacious backyard providing ample room for recreation or gardening, and perfect for outdoor gatherings or quiet relaxation. Convenient location situated near
Unit 2 is remodeled. Please do not disturb tenants. Offer subject to inspection only! Great investing opportunity in a fourplex located in the heart of Sunnyvale. Easy access to Wolfe Rd, EL Camino Real, and Sunnyvale Caltrain station. All four units are 2BR/1BA with the living apace around 832 sqft and rented for $2500/month. Minutes to Downtown Sunnyvale, Caltrains, Parks, Library, Costco, and Sunnyvale's Apple Campus!
Nestled at the end of a tranquil cul-de-sac, this beautifully updated Eichler home captures the essence of iconic mid-century architecture, seamlessly blending form and function in its design. Embracing the simplicity of its style, this sanctuary beckons you with a custom front door leading to an inviting interior adorned with warm redwood paneling and expansive porcelain tile throughout. Skylights adorn the ceilings, suffusing the space with natural light, while the living room boasts a focal fireplace. This home offers an ideal floorplan including three generously sized bedrooms, and two meticulously upgraded bathrooms that feature quality fixtures. A dining area and great room harmonious
Beautiful and well-maintained mobile home located in a desirable all-ages community, Plaza Del Rey. This 2-bedroom, 2-bathroom residence spans 1440 sq ft and boasts a thoughtfully designed layout featuring a spacious family room, a dedicated bonus room ideal for remote work setups, and an open-concept configuration conducive to hosting guests. ( Space Rent $1478 ) Adding to its allure, many of the home's fixtures and appliances are recently updated. The washer and dryer units were replaced just two years ago, while the kitchen and wine storage underwent modernization four years prior. Furthermore, luxuriate in the comfort provided by the upgraded Lexure Floor, enhancing the overall stay-at
Cozy Remodeled 2 bedroom 2 bath with indoor laundry & room for 3 cars within a small family park of 102 homes. It is centrally located near Fair Oaks Avenue and 101 HWY.
Ready to roll up your sleeves and unleash your inner HGTV star? 1150 Lafayette Dr, Sunnyvale presents a thrilling renovation project. This home beckons for a total overhaul, offering a rare opportunity to personalize every detail. Located in a sought-after neighborhood, the potential is undeniable.
Your Heritage District Haven Awaits! This meticulously maintained 3-bedroom home in Sunnyvale's vibrant Heritage District offers the perfect blend of classic charm and modern convenience. Imagine relaxing on your front porch, unwinding on a peaceful, tree-lined street. Entertain loved ones in the private backyard, with previously approved plans for a primary bathroom addition. Step inside and discover: A remodeled kitchen perfect for culinary creations. Gleaming parquet hardwood floors throughout, adding timeless elegance. The living room features a cozy fireplace, ideal for movie nights or entertaining. Modern upgrades: dual-pane windows for energy efficiency and an upgraded forced air HVA
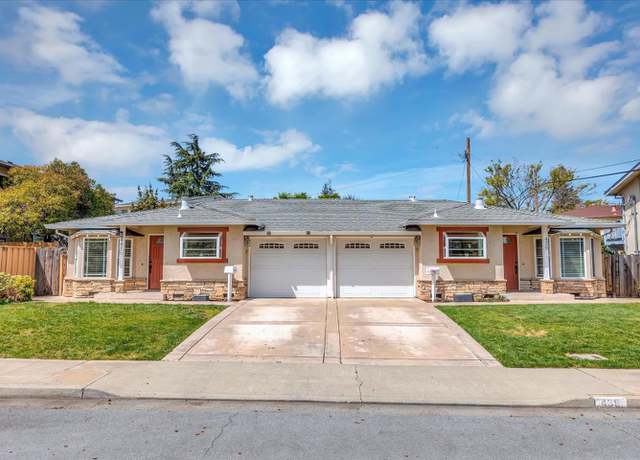
Move in and enjoy this beautifully updated duplex. Located in a nice area with single family homes. This duplex offers flexible options to occupy one or both units, lease out one or lease both units. Excellent opportunity to generate income or facilitate different living needs. The larger unit has 3 bedrooms and 2 bathrooms with refinished wood floors, new int. paint, central A/C, double pane windows, private yard and attached garage. The smaller unit has 2 bedrooms and 1 bathroom with refinished wood floors, double pane windows, private yard and attached garage. This property has been well maintained and upgraded. The property has separate utility meters. The city of Sunnyvale is considere
Ascend to the pinnacle of Silicon Valley living and leave the ordinary behind - this stunning 3-bedroom, 2-bathroom penthouse suite awaits! Let the worries of the day melt away as you unwind on the balcony in the evenings and enjoy the fiery hues of a setting sun painting the sky. The gourmet kitchen with a huge walk-in pantry, a chefs dream, boasts a massive L-shaped granite countertop, providing ample room for culinary creativity. A vaulted high ceiling with skylight and expansive windows bathe the interior with natural light, creating a sense of openness and grandeur. Nestled in the heart of Silicon Valley, you'll enjoy unrivaled access to the tech giants that have shaped the world. Appl
1/38
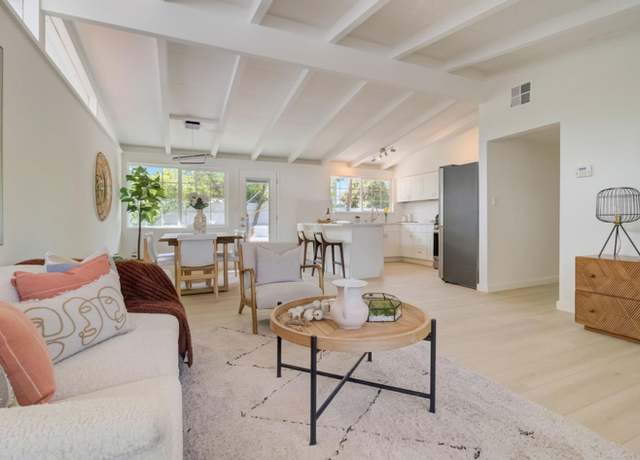
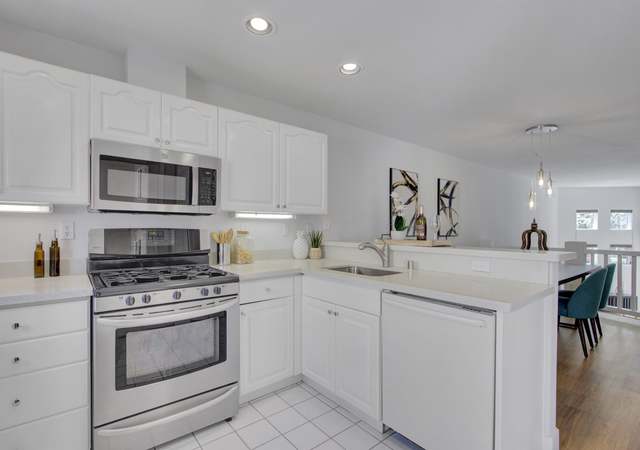
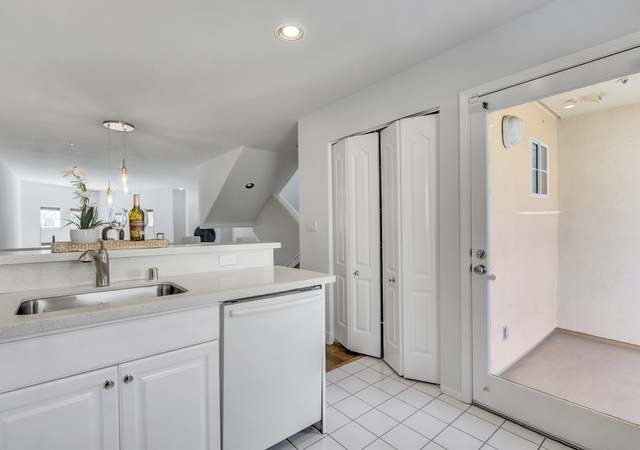
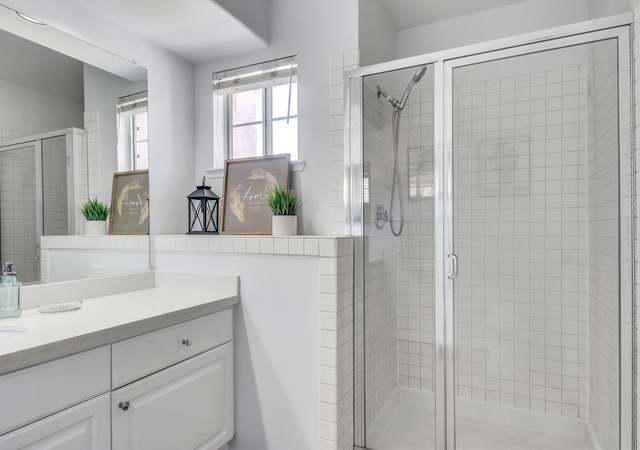
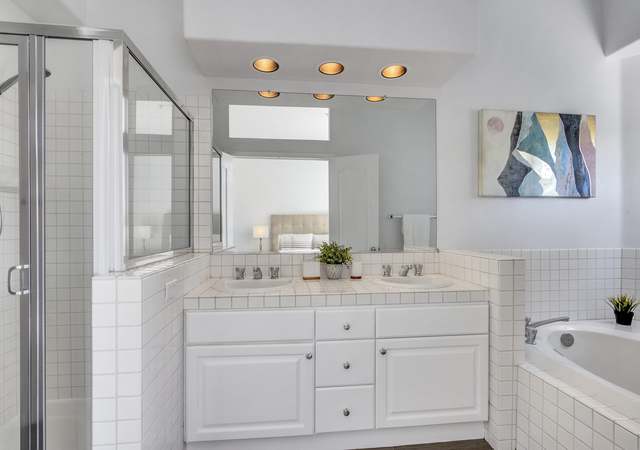
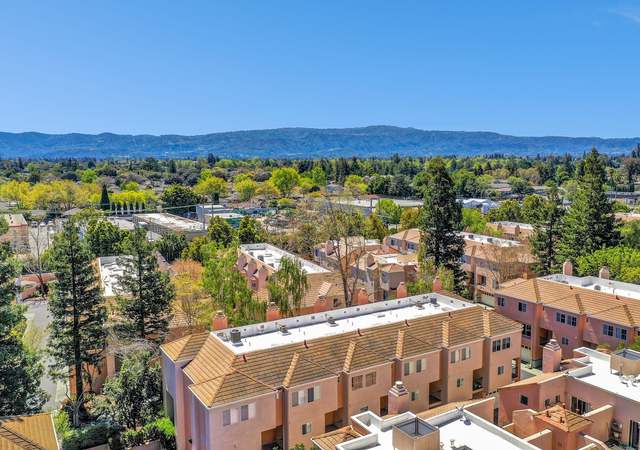
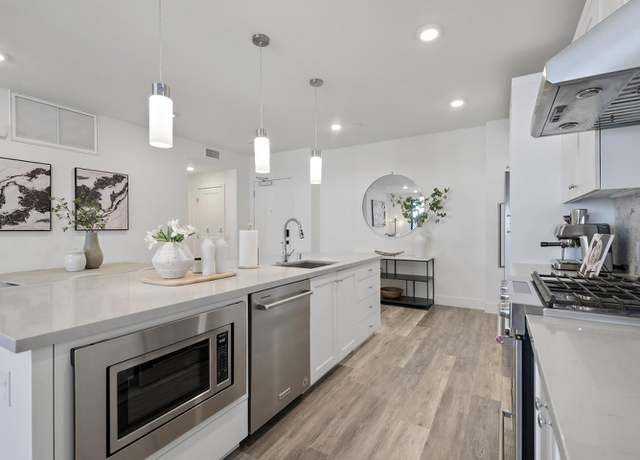
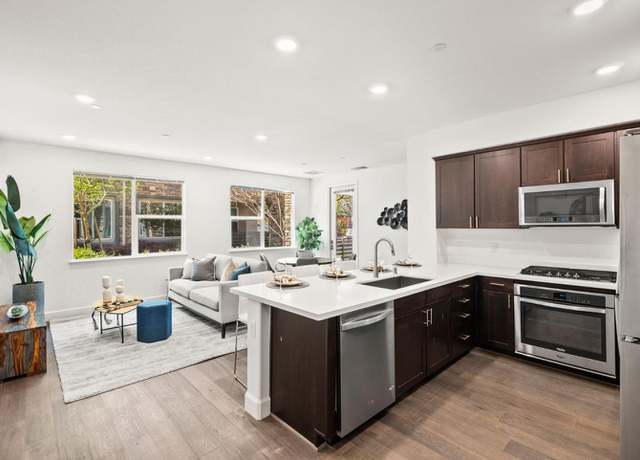
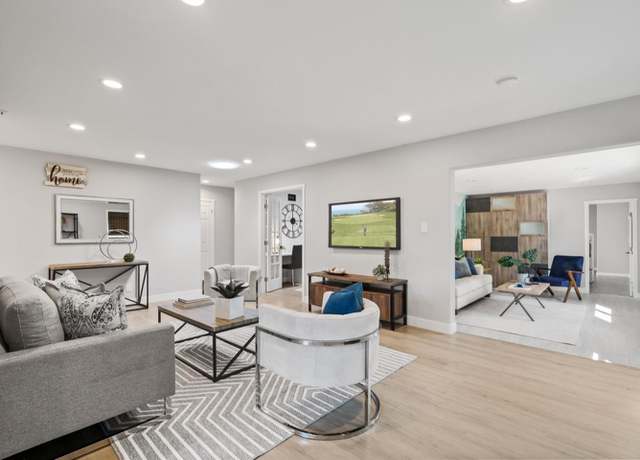
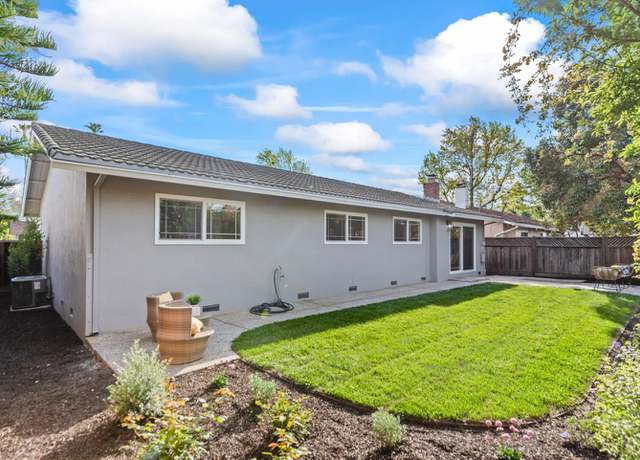
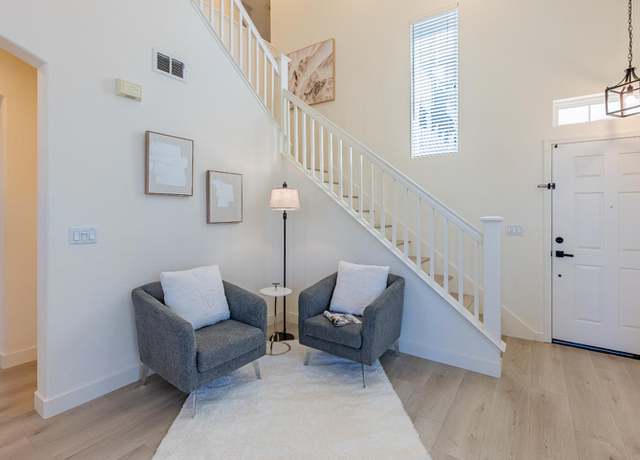
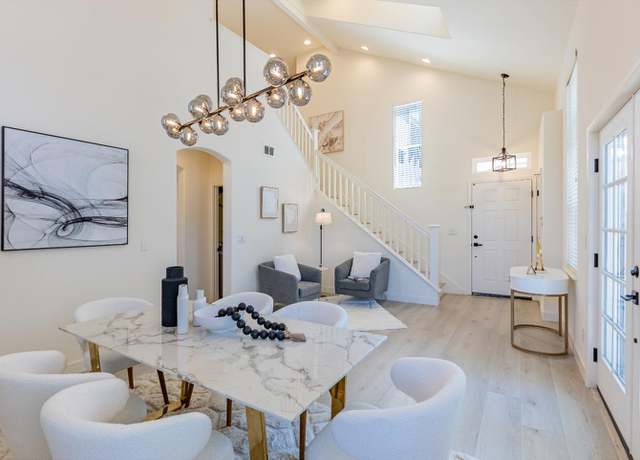
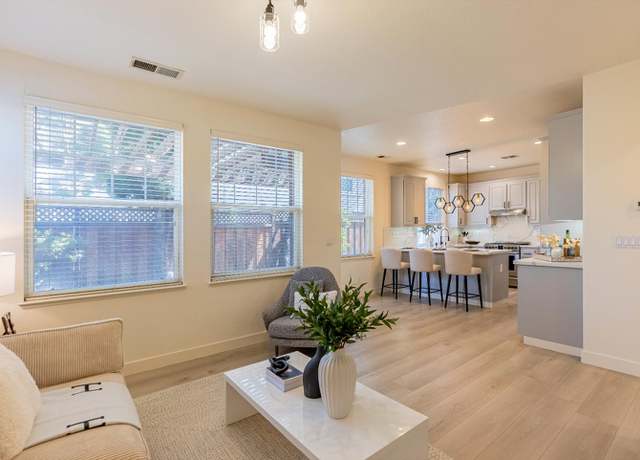
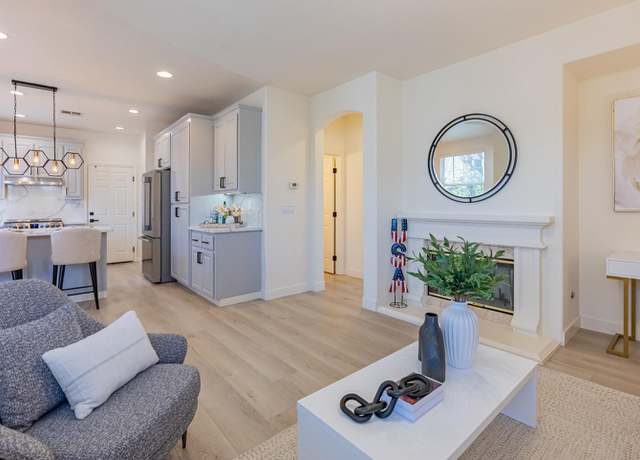
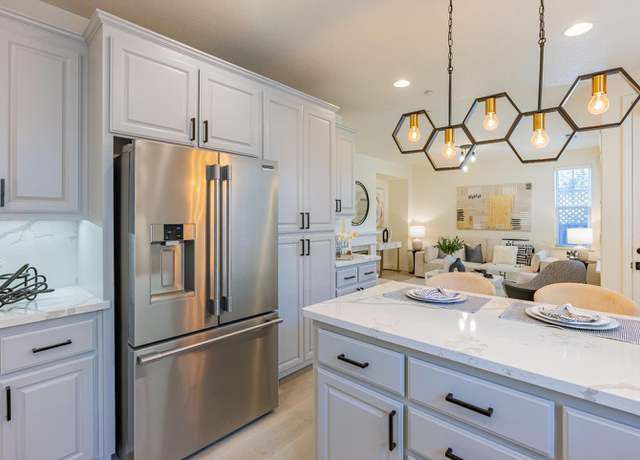
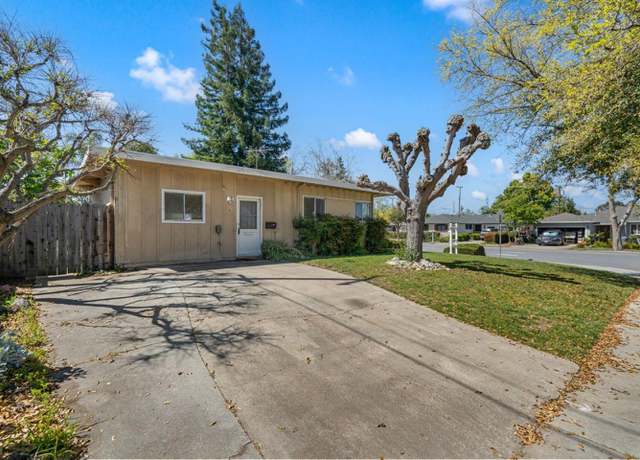
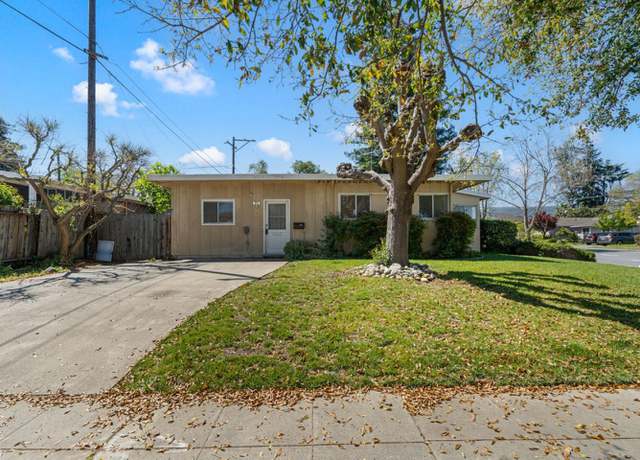
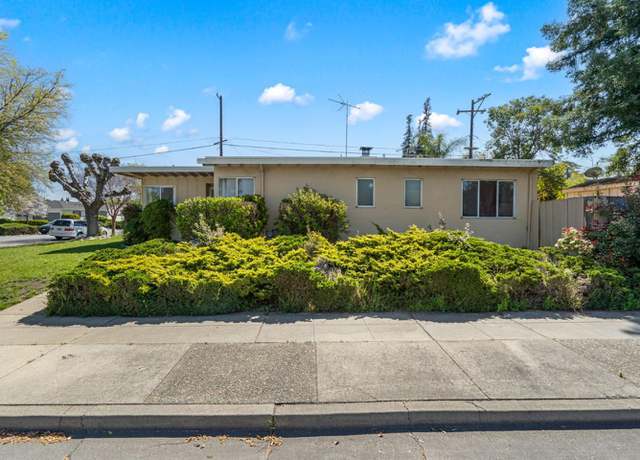
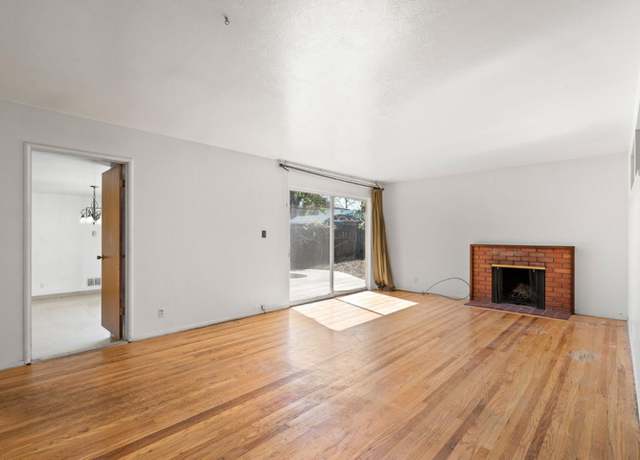
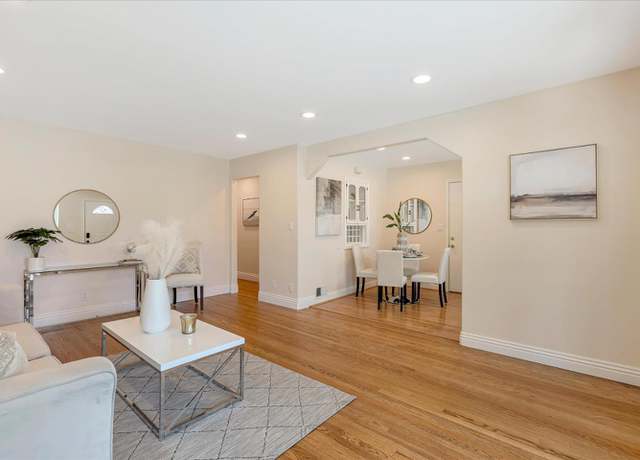
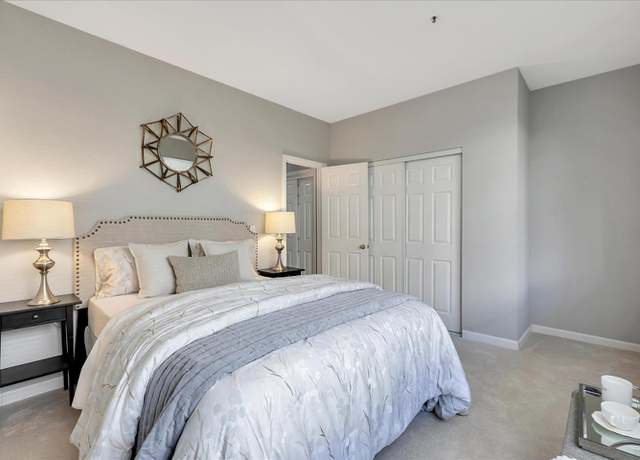
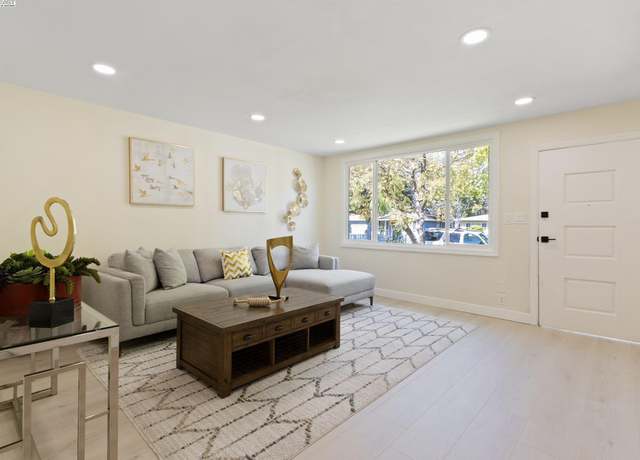
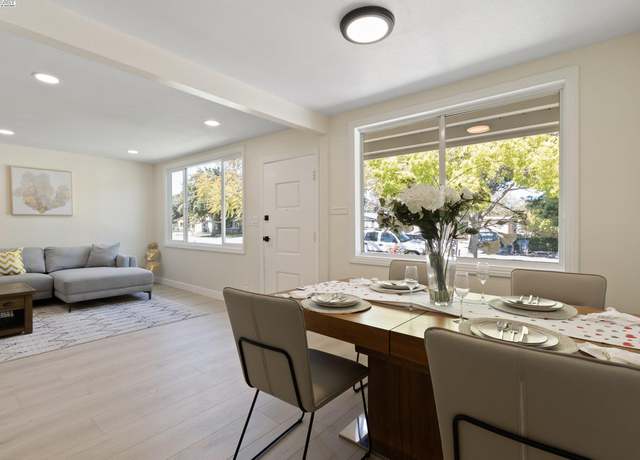
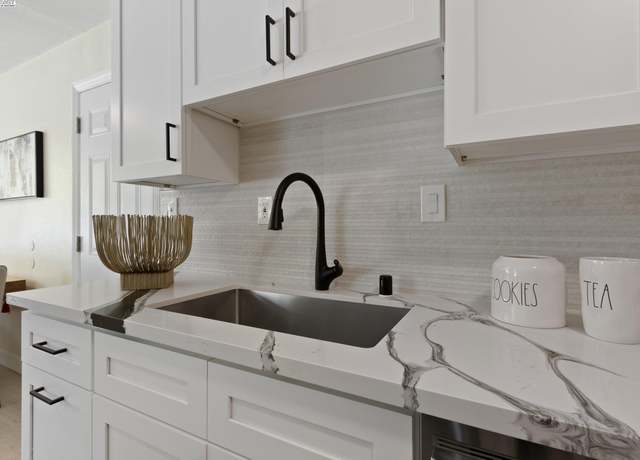
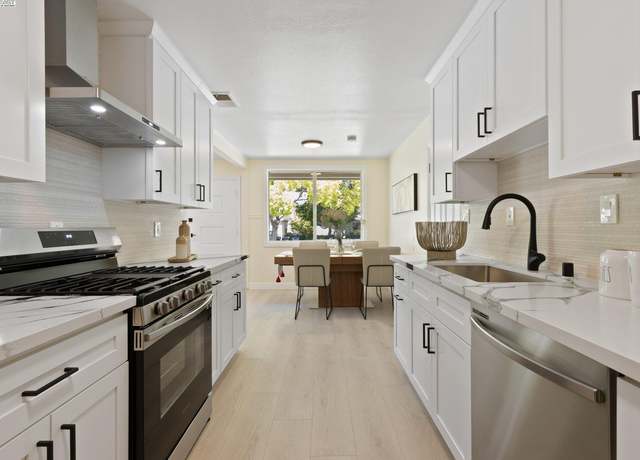
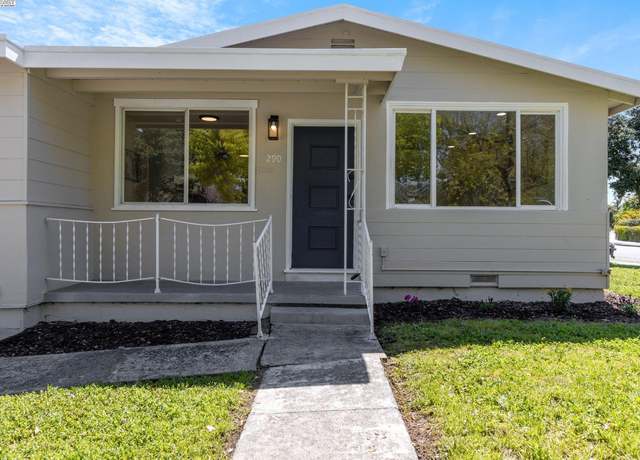
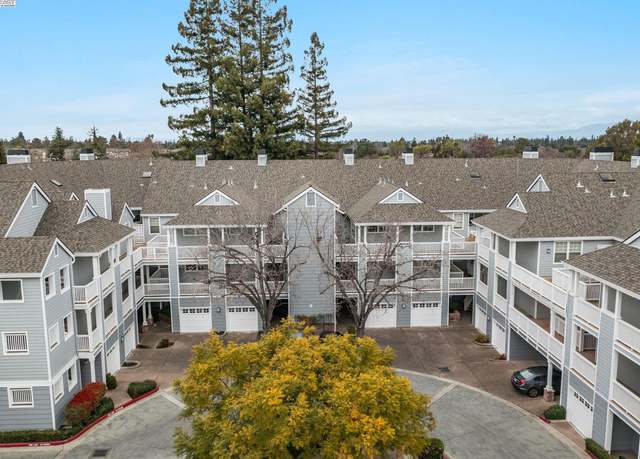
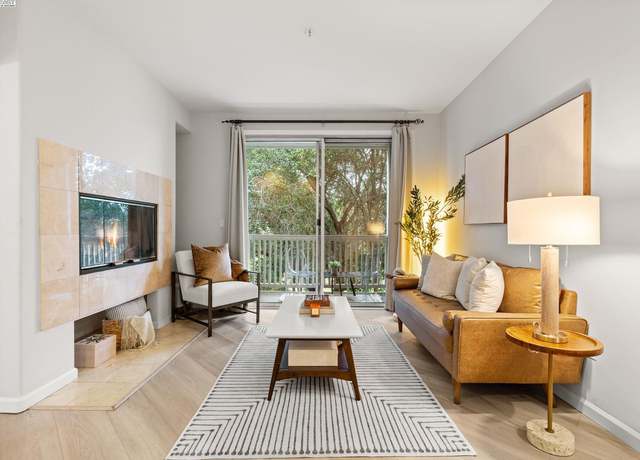
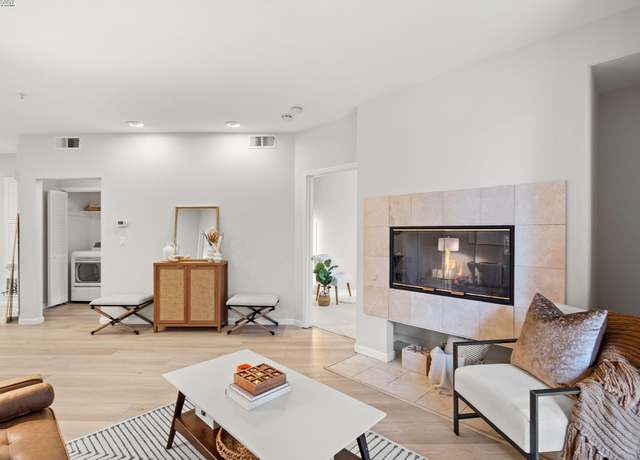
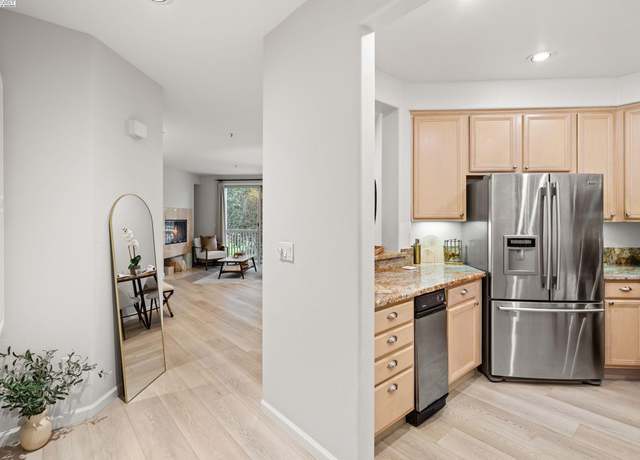
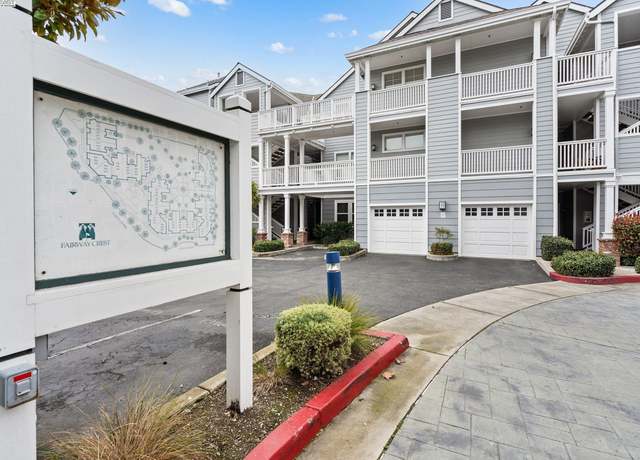
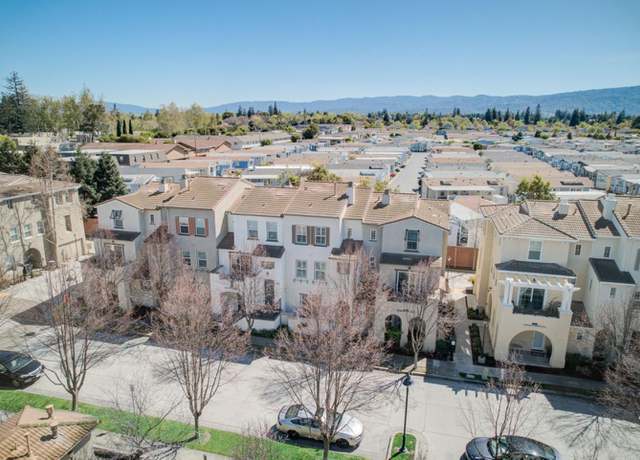
$1,089,000
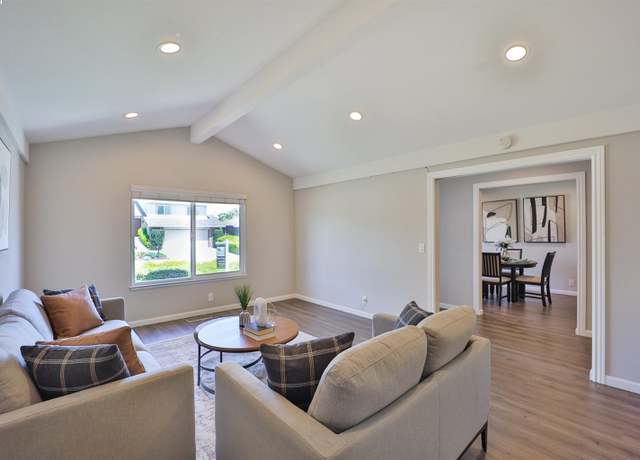
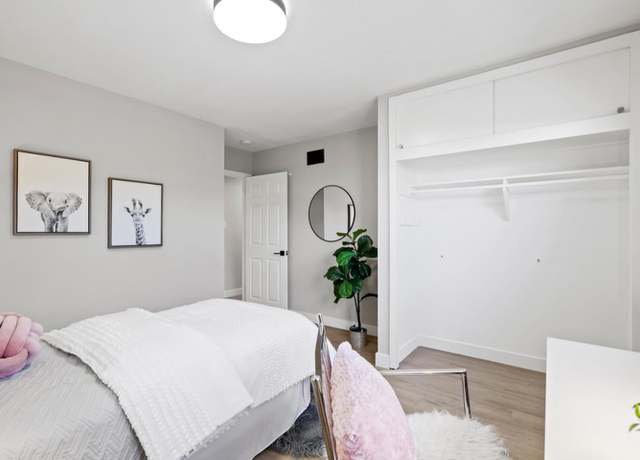
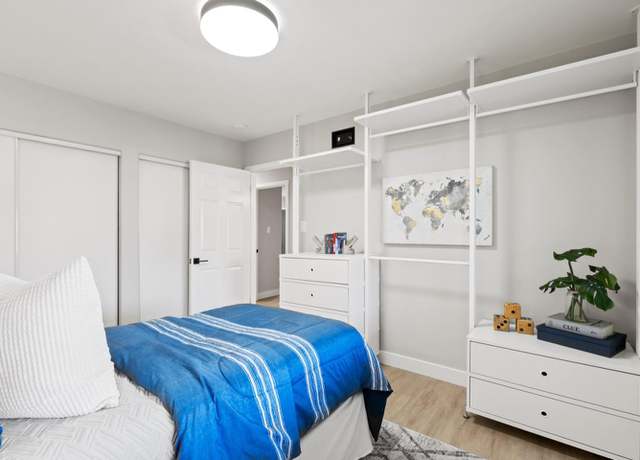
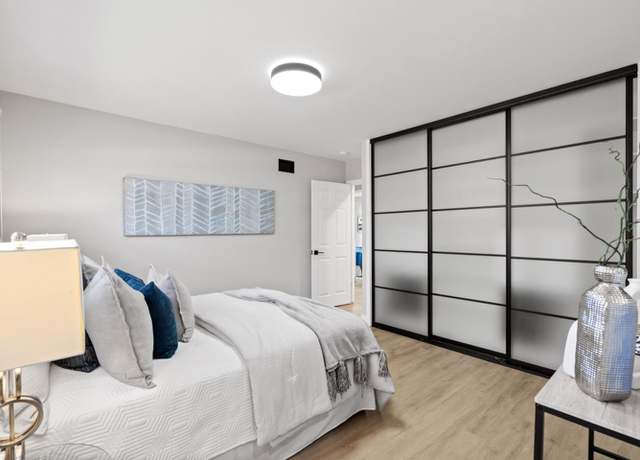
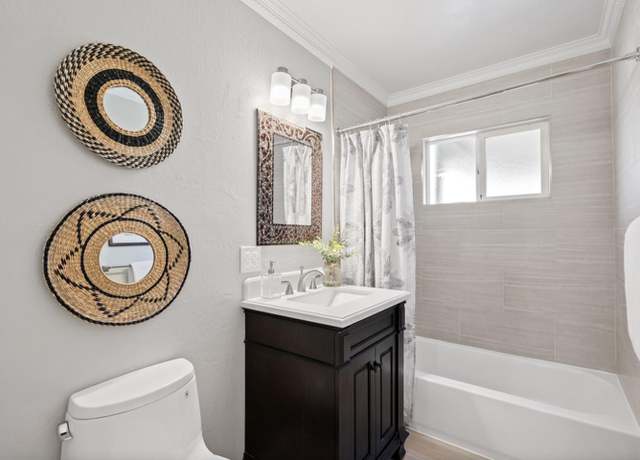
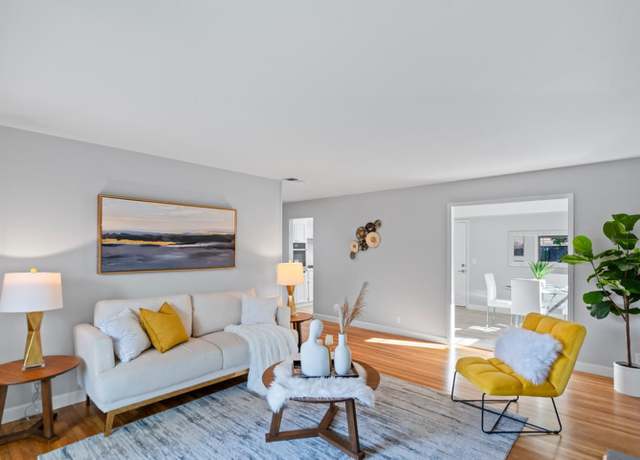
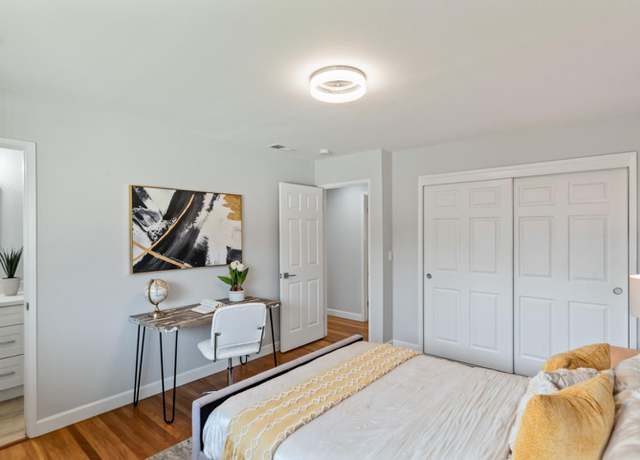
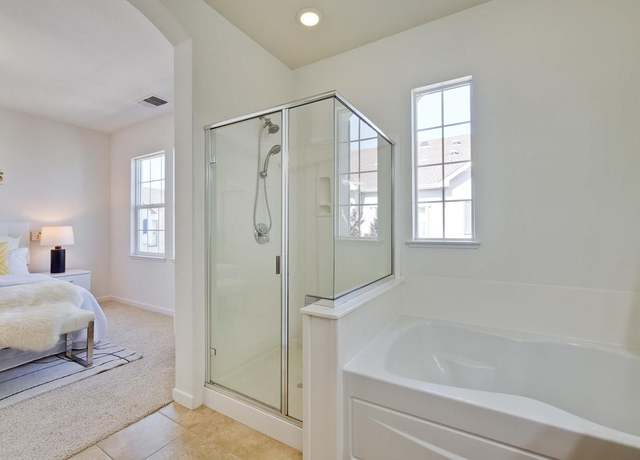
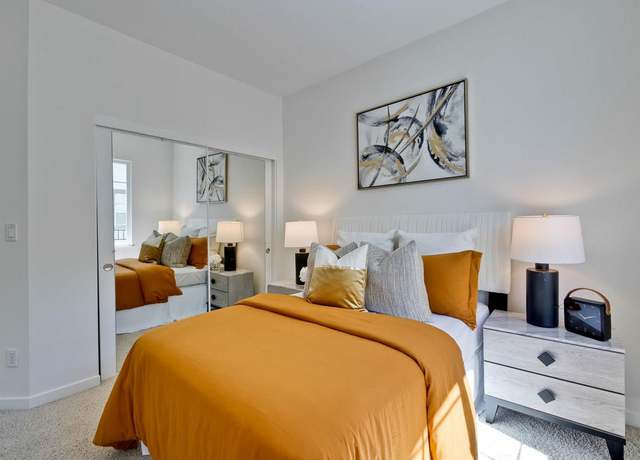
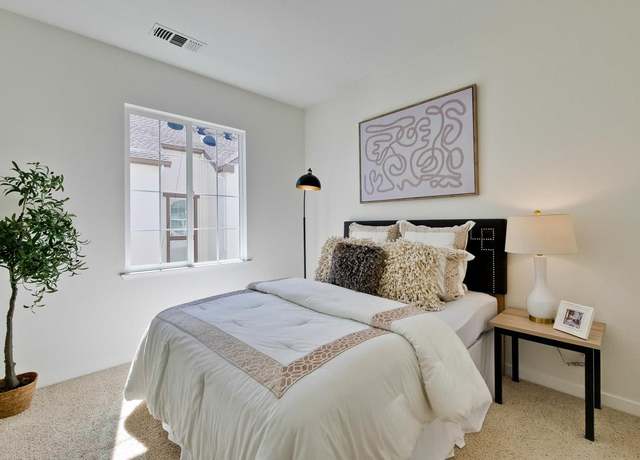
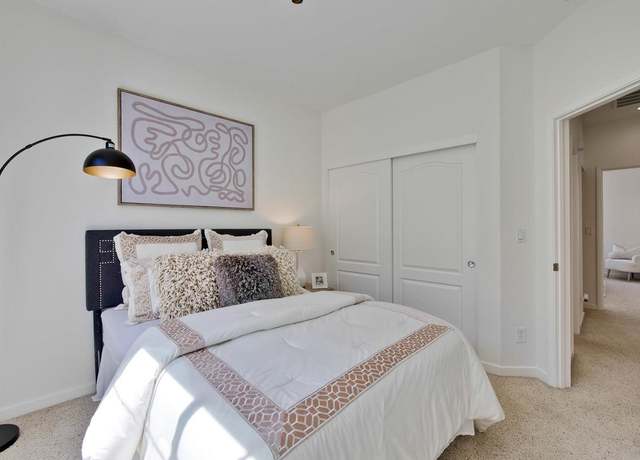
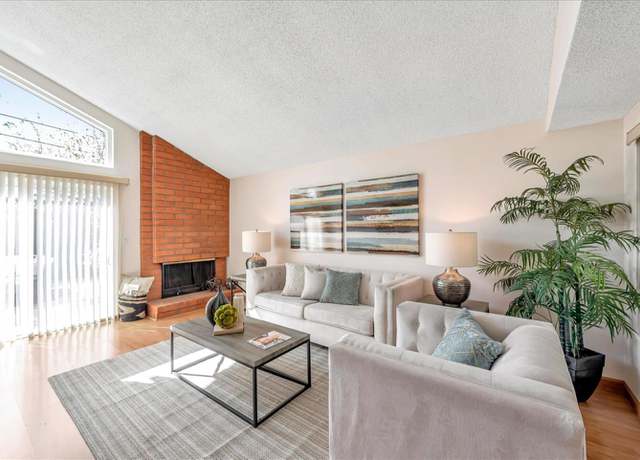
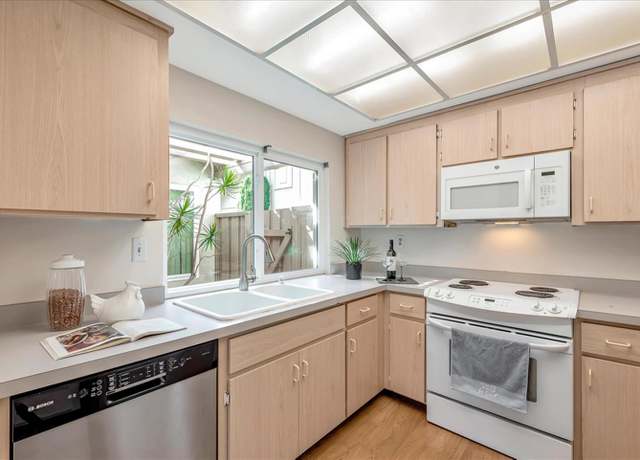
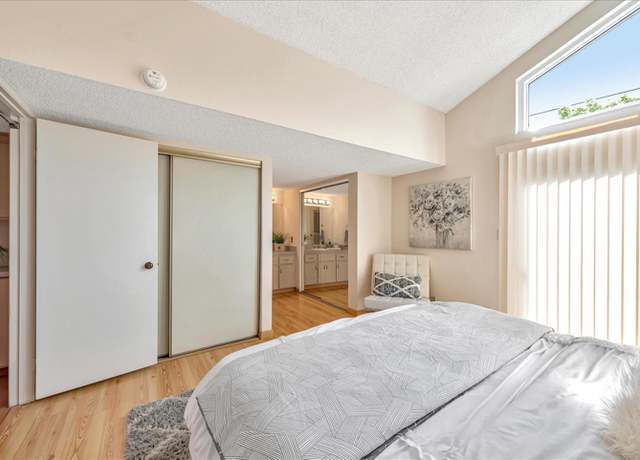
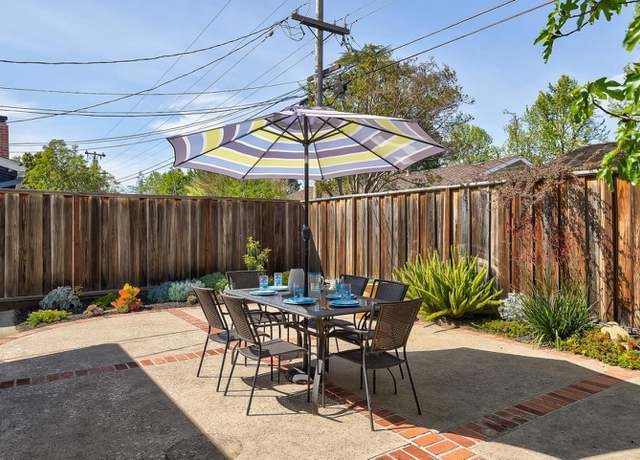
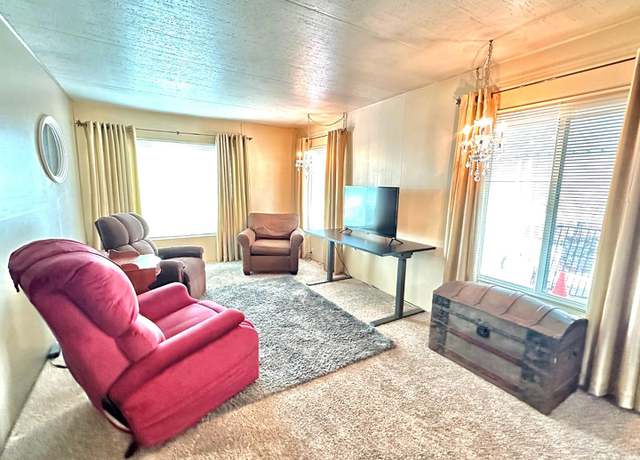
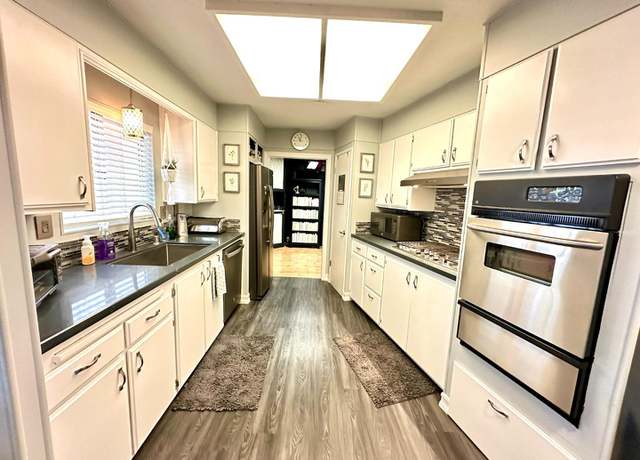
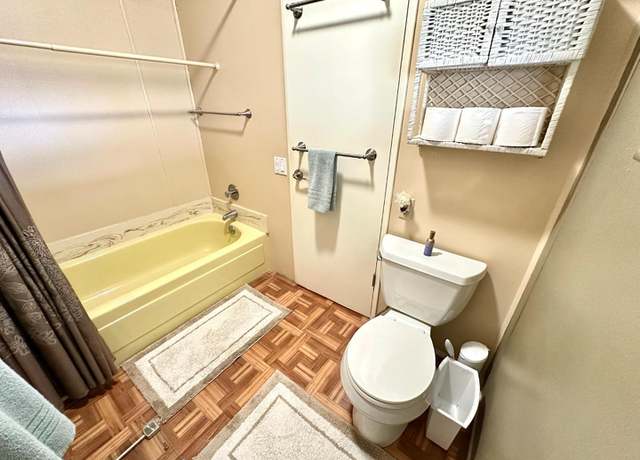
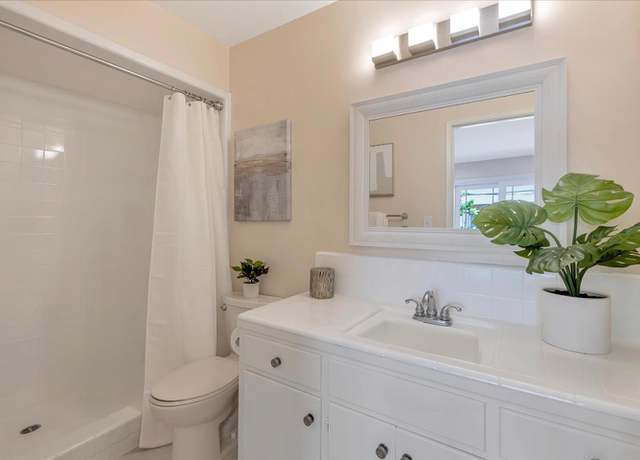
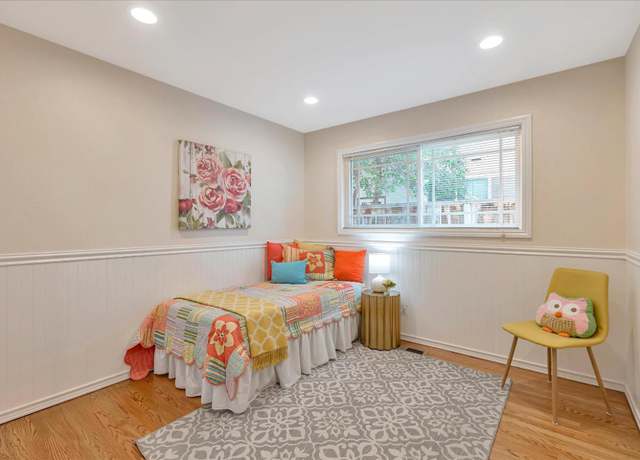
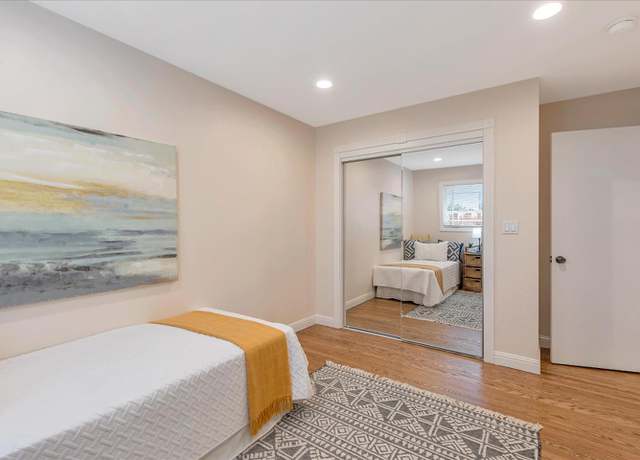
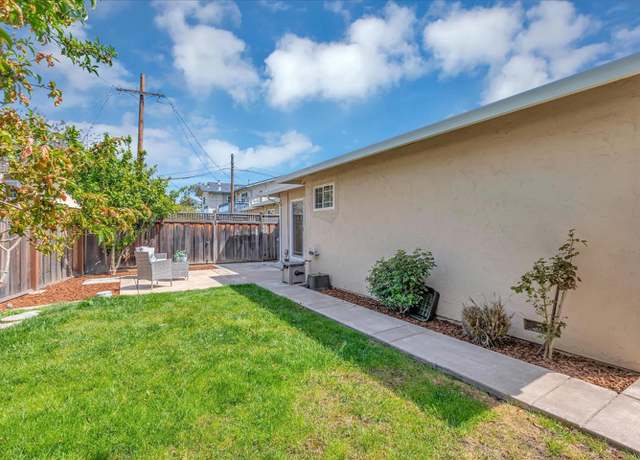
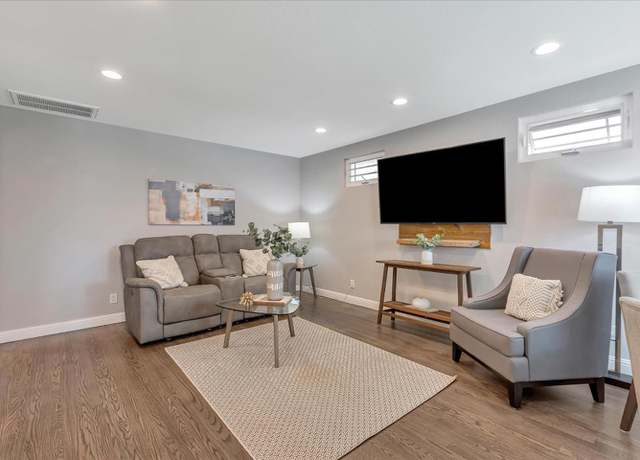
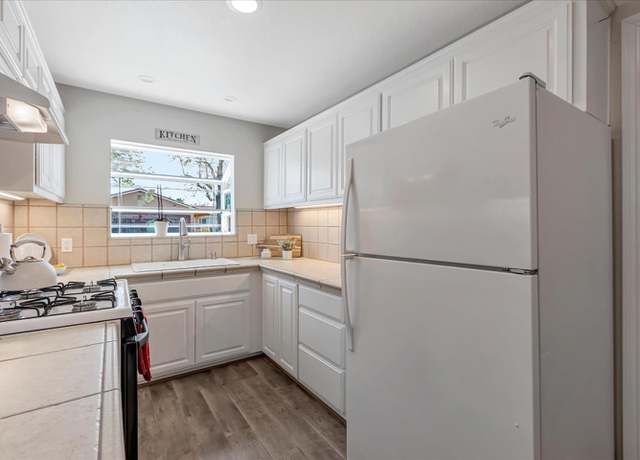
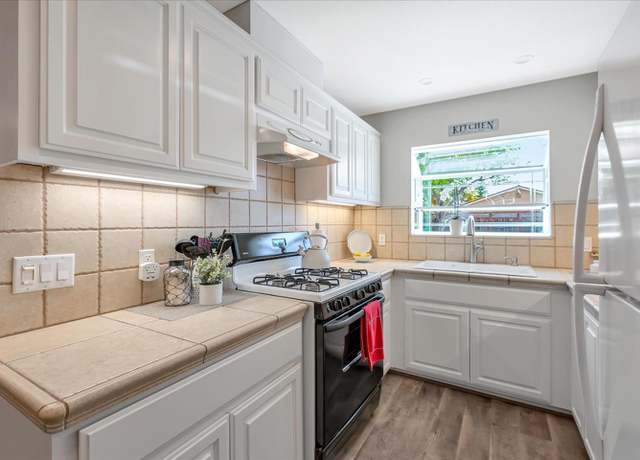
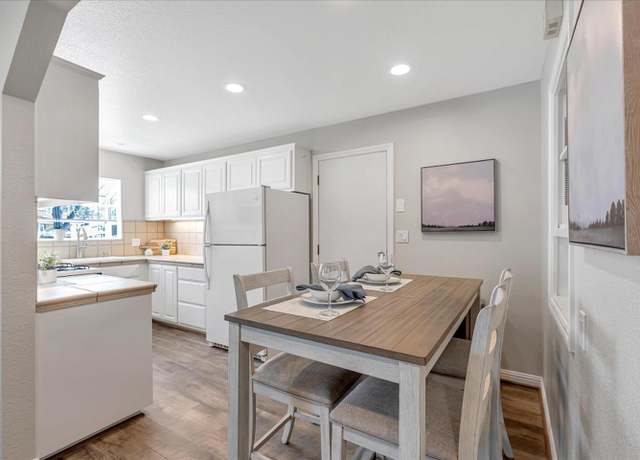
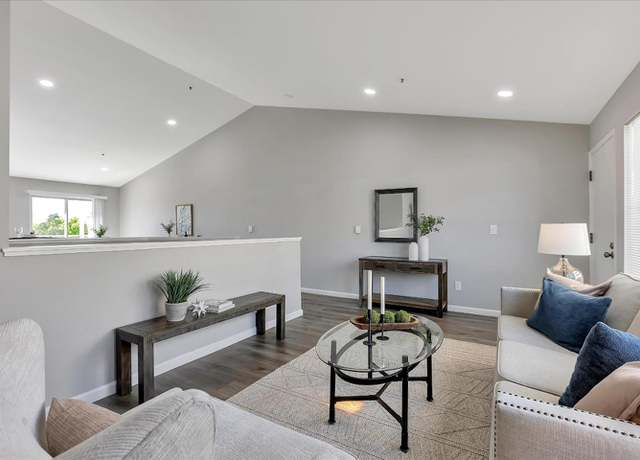
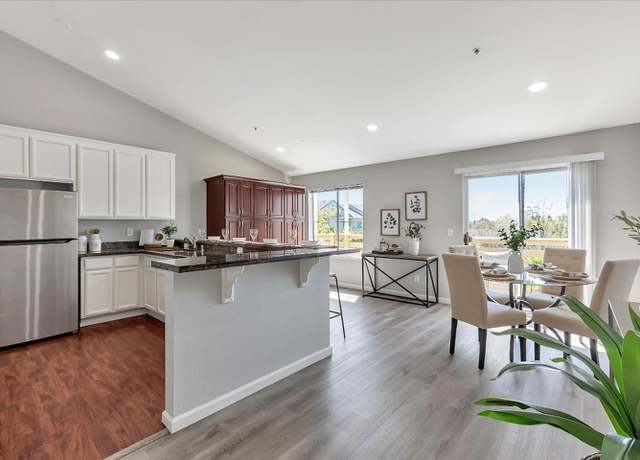
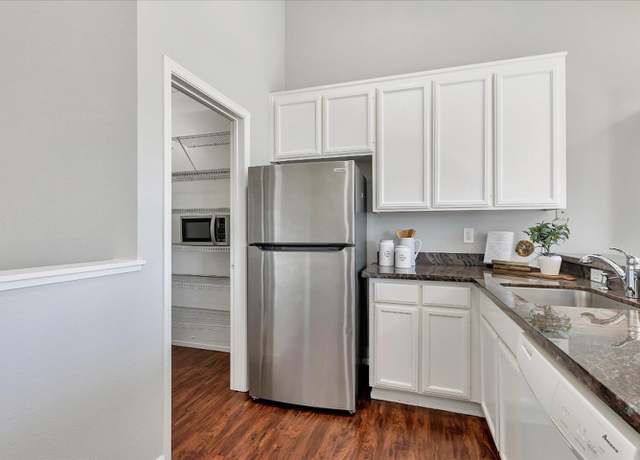
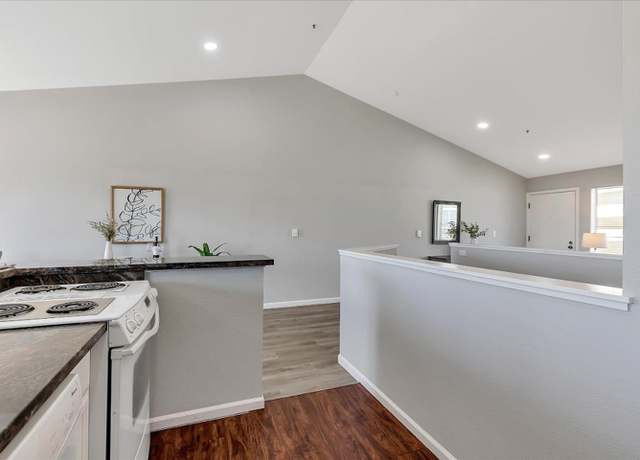
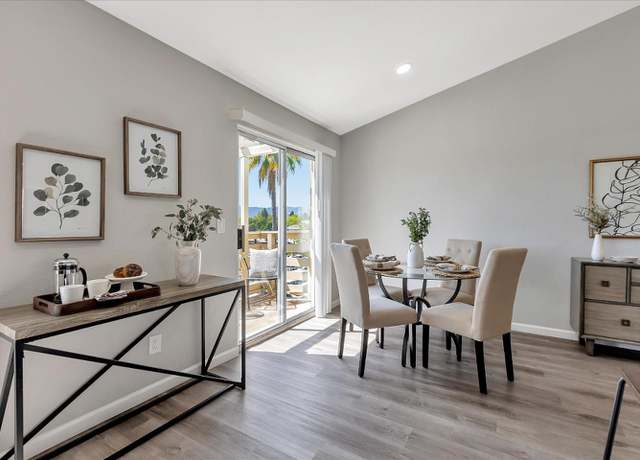
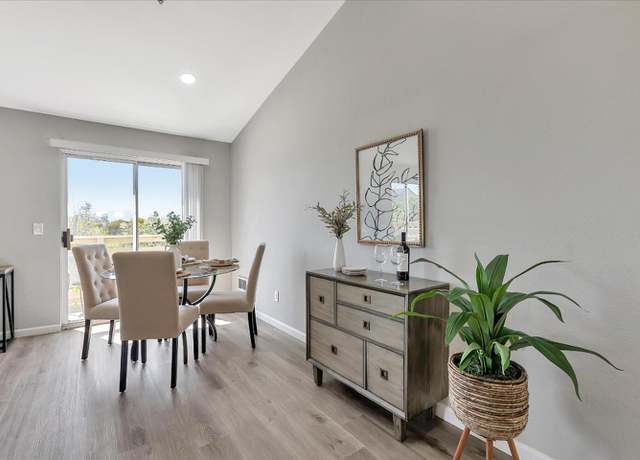
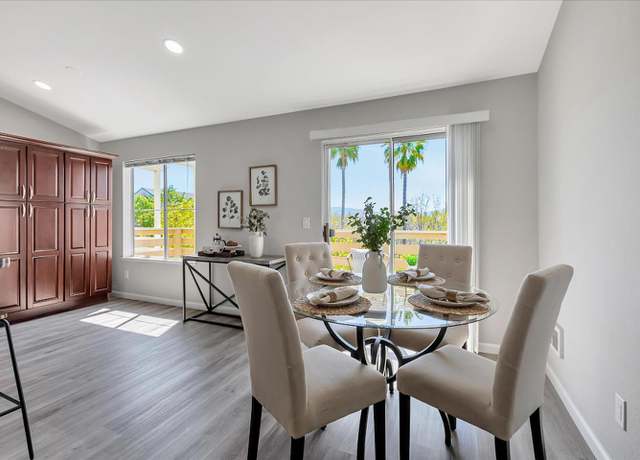
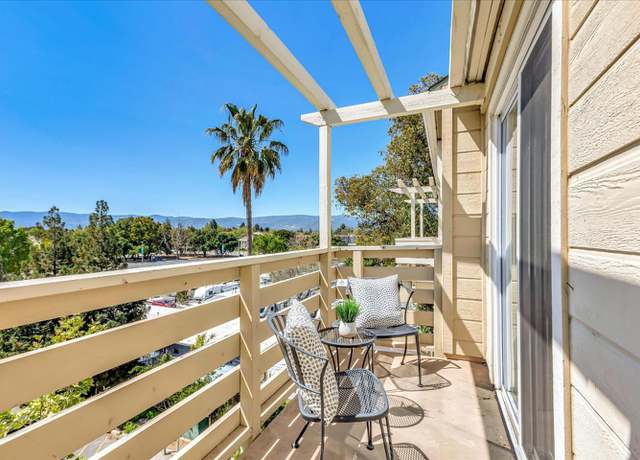
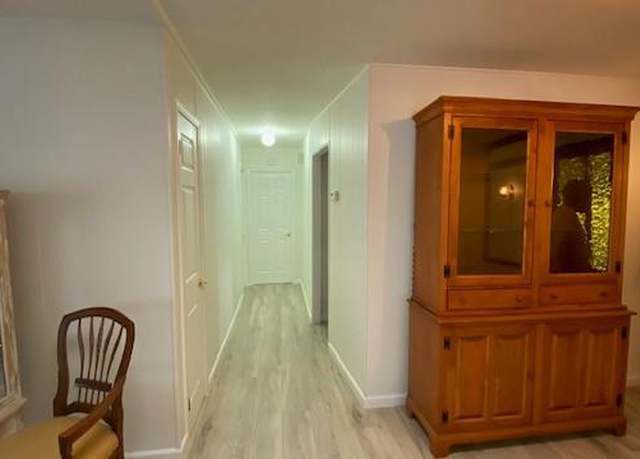
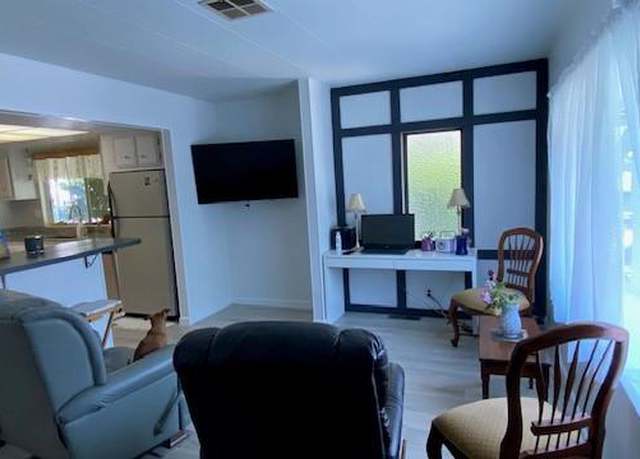
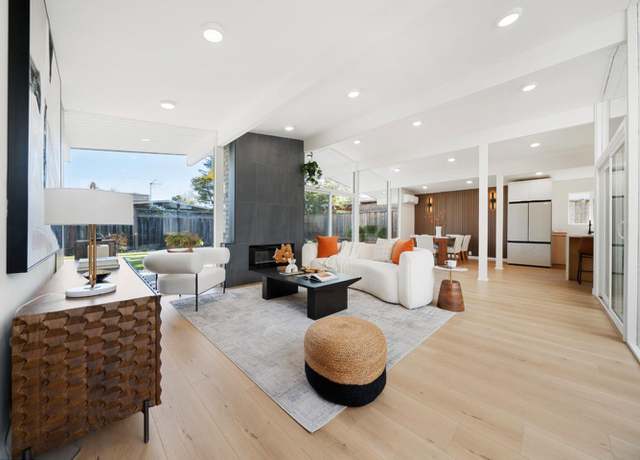
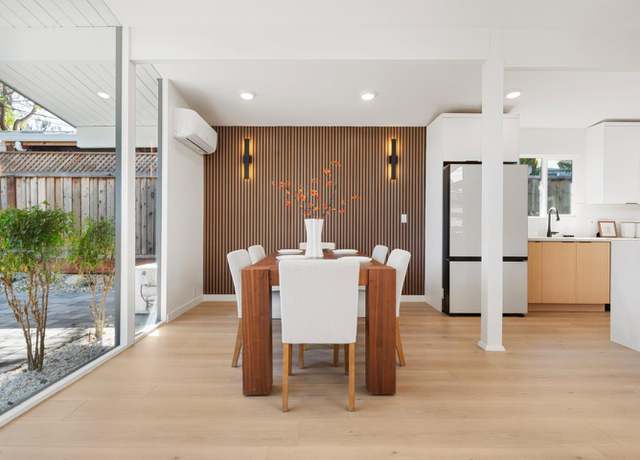
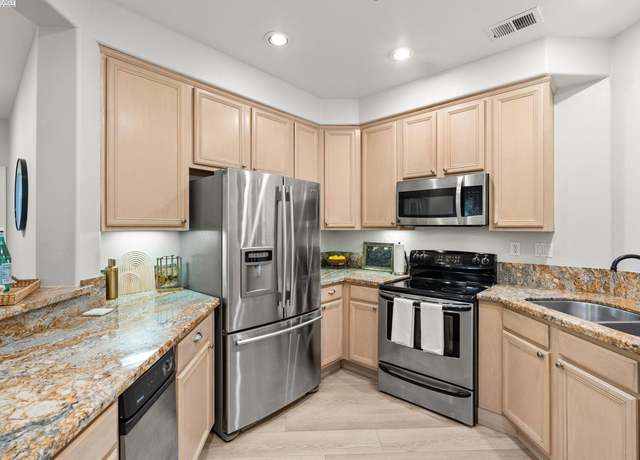
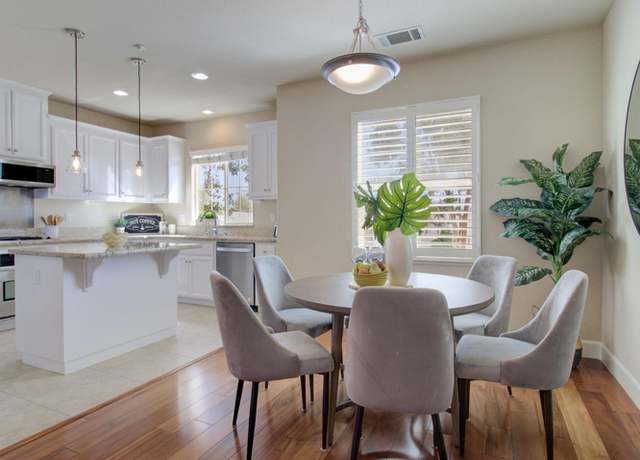
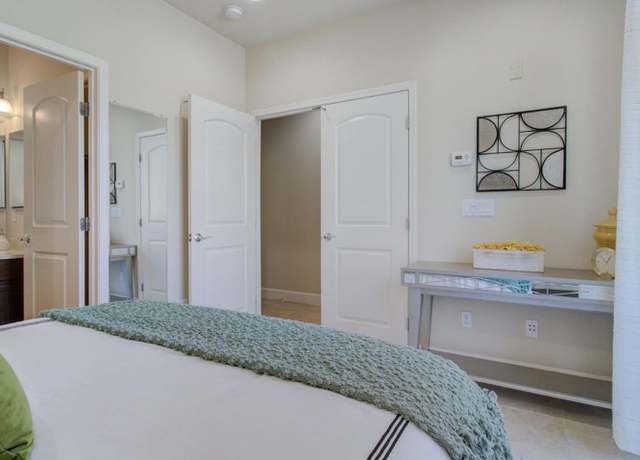
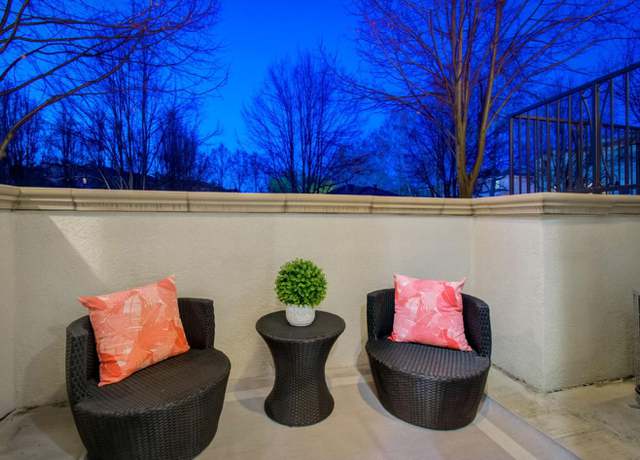
3 beds2 baths1,440 sq ft
929 E El Camino Real Unit 438H, Sunnyvale, CA 94087
Now its your Rare Opportunity to own a beautiful super bright home in Prime Ponderosa Sunnyvale! Beautifully remodeled and tastefully detailed 4b2b single family with private backyard oasis. Situated in the heart of Silicon Valley, near Apple, Google, just minutes away from vibrant downtown Sunnyvale & Hwy 101, 880. Property features spacious and bright living room and a separate family room with a beautiful cozy fireplace perfect for family gatherings, entertainment, vaulted ceilings and bright skylights, engineered wood floors throughout perfect to unwind and relax! Newly installed dual pane windows, recessed lights, remodeled bathrooms with skylights and functional cabinets. Newly
This spacious property with spacious lot, located right next to Google's headquarters in Silicon Valley, offers over 2 million square feet of office space and hosts more than 50,000 employees. Renovated by licensed contractor, with a modern kitchen, a spacious master suite with an office, and a large corner lot with a yard featuring fruit trees and a storage shed, this home provides both comfort and functionality. Its prime location ensures easy commuting, with quick access to highways 101 and 237, and proximity to parks, restaurants, and shopping. Additionally, being walking distance to Google Cloud campus and biking distance to other major tech companies like Apple, LinkedIn, Amazon, and
Your home awaits in this recently updated 2-bed, 2-bath, modern touches throughout, new floors, a stylish kitchen, fresh paint, and a luxurious primary suite, inside be amazed by the attention to detail Updated floors create a seamless flow The kitchen featuring sleek granite countertops, farm . sink and ample cabinet space The living room providing a perfect space for entertaining Relax and unwind, The cozy front room that is filled with natural light. The atmosphere makes it an ideal spot to enjoy quiet evenings at home. Bathrooms are updated with fixtures and showers. The primary has a tiled oversized walk-in shower It's a spa-like retreat you'll love coming home to. The second bedroom c
Impeccably renovated modern Eichler with extra 340 sq ft covered atrium sitting on a generous 7,150 sq ft lot is situated in the sought-after Fairwood neighborhood of Sunnyvale. Surrounded by picturesque tree-lined street, this quintessential Eichler home boasts classic modern elements, including expansive walls of windows seamlessly connecting indoor and outdoor spaces. Recent updates feature luxury vinyl flooring, double pane sliding doors and safety windows, a newly installed electric fireplace, the new drywall for the whole house, mini-split AC, and a patented wall panel heater for modern comfort. The generous master suite offers a walk-in closet and remodeled bath, while the hall bath
Quaintly tucked in a tranquil, private enclave in the heart of Silicon Valley, this East-facing corner-unit provides privacy, elegance & modern living with neighbors on only one side. Featuring 1086 sqft of luxury living w 2 spacious bedrooms, 2 en-suite/connected baths & a wide open living/entertaining area, this condo provides the feeling of home. Step in & be captivated by the well-designed floor plan. Notice the open living space w 9’ ceilings, complimented by the neutral tones, tasteful updates, newer appliances and central A/C & heating. On your right, discover the gorgeous kitchen w granite countertops, stainless steel appliances & breakfast bar th
The north-facing townhome is located within the highly coveted Mondrian complex, crafted by Ashes Homes, which exudes luxury and elegance. Boasting a prime location, this residence is thoughtfully designed with soaring ceilings, abundant natural light, and smart home devices throughout. Its spacious floor plan has been tastefully enhanced with freshly painted walls, resurfaced cabinets, and brand-new carpeting. Nestled conveniently across the complex's park and pool, it's an ideal setting for families with young children. Additionally, its proximity to downtown Castro Street, Caltrain, light rail, and major commuting routes ensures easy travel. This sophisticated townhome features three bed
This area's enrollment policy is not based solely on geography. Please check the school district website for more information.
Elementary schools
Middle schools
High schools
GreatSchools Summary Rating
8/10
Cherry Chase Elementary School
Public, K-5
8/10
West Valley Elementary School
Public, K-5
8/10
Laurelwood Elementary School
Public, K-5
7/10
Louis E. Stocklmeir Elementary School
Public, K-5
7/10
Sutter Elementary School
Public, K-5
Only showing 5 of
21 elementary schools.
School data is provided by GreatSchools, a nonprofit organization. Redfin recommends buyers and renters use GreatSchools information and ratings as a first step, and conduct their own investigation to determine their desired schools or school districts, including by contacting and visiting the schools themselves.Redfin does not endorse or guarantee this information. School service boundaries are intended to be used as a reference only; they may change and are not guaranteed to be accurate. To verify school enrollment eligibility, contact the school district directly.
Homes for sale in Sunnyvale have a median listing price of $1.68M. Some of these homes are Hot Homes, meaning they're likely to sell quickly.
What are some of the most popular neighborhoods in Sunnyvale?
Popular neighborhoods include El Dorado, Rivermark, East Sunnyvale, North San Jose, North Sunnyvale, Sunnyvale West, Lakewood, Ponderosa, Ponderosa Park, and North Santa Clara.
Sunnyvale, California boasts a well-developed transportation system, with numerous options for residents. The city experiences moderate traffic levels, making car travel a viable option for most. Public transportation is readily available, with a robust network of buses and trains serving the area. Additionally, Sunnyvale is conveniently located near major highways and freeways, providing easy access for car travel to neighboring cities and regions. Learn more on our Sunnyvale city guide.
What types of properties are available in Sunnyvale?
Sunnyvale, California offers a variety of single-family home types, including ranch-style homes, bungalows, and contemporary residences, each with their own unique architectural features and designs. These homes can be found throughout the city, with many located in established neighborhoods and newer developments. Most properties in Sunnyvale feature three to five bedrooms and were built in various years, providing a range of options for homebuyers. To explore different property types for sale in Sunnyvale, California, use the 'Home type' filter located above the active listings. Customize your search by selecting options like single-family homes, condos, townhomes, and more.
What is life like in Sunnyvale?
Sunnyvale, California offers a vibrant and thriving community with a variety of amenities. The city is surrounded by stunning natural landscapes, including picturesque mountains and lush green parks. The weather in Sunnyvale is consistently pleasant, with mild winters and warm summers, providing ample opportunities for outdoor activities year-round. The city is known for its strong job market, attracting a range of industries and offering diverse employment opportunities. Residents can enjoy a wide array of recreational activities, such as hiking, biking, and exploring local parks, as well as a bustling downtown area with numerous dining and entertainment options.
What are the schools and amenities like in Sunnyvale?
Sunnyvale, California offers a variety of public amenities for its residents. The city boasts a multitude of restaurants, serving a diverse range of cuisines to satisfy all kinds of culinary cravings. Numerous parks provide open spaces for relaxation, recreation, and enjoyment of the outdoors. Grocery stores are conveniently located throughout the city, making daily shopping easy and accessible. Additional amenities include libraries, fitness centers, and community centers, all contributing to the high quality of life in Sunnyvale.
In the past month, 70 homes have been sold in Sunnyvale. In addition to houses in Sunnyvale, there were also 20 condos, 44 townhouses, and 4 multi-family units for sale in Sunnyvale last month. Sunnyvale is a moderately walkable city in Santa Clara County with a Walk Score of 60. Sunnyvale is home to approximately 138,782 people and 84,519 jobs. Find your dream home in Sunnyvale using the tools above. Use filters to narrow your search by price, square feet, beds, and baths to find homes that fit your criteria. Our top-rated real estate agents in Sunnyvale are local experts and are ready to answer your questions about properties, neighborhoods, schools, and the newest listings for sale in Sunnyvale. Our Sunnyvale real estate stats and trends will give you more information about home buying and selling trends in Sunnyvale. If you're looking to sell your home in the Sunnyvale area, our listing agents can help you get the best price. Redfin is redefining real estate and the home buying process in Sunnyvale with industry-leading technology, full-service agents, and lower fees that provide a better value for Redfin buyers and sellers.


 REDFIN IS COMMITTED TO AND ABIDES BY THE FAIR HOUSING ACT AND EQUAL OPPORTUNITY ACT. READ REDFIN'S FAIR HOUSING POLICY AND THE NEW YORK STATE FAIR HOUSING NOTICE.
 United States
 Canada