Welcome to your dream home! This meticulously remodeled 3-bedroom, 1-bathroom gem is a fusion of modern elegance and classic charm, promising comfort and convenience at every turn. Step inside to discover the seamless flow of new laminate flooring that graces the entire home, creating a warm and inviting ambiance. The heart of the home, the kitchen, is a culinary enthusiast's paradise, boasting stunning quartz countertops, complemented by a beautiful white tile backsplash that adds a touch of sophistication. With ample storage space provided by the sleek white shaker cabinets, meal preparation becomes a pleasure. Illuminate your culinary creations with the soft glow of recessed lighting, ad
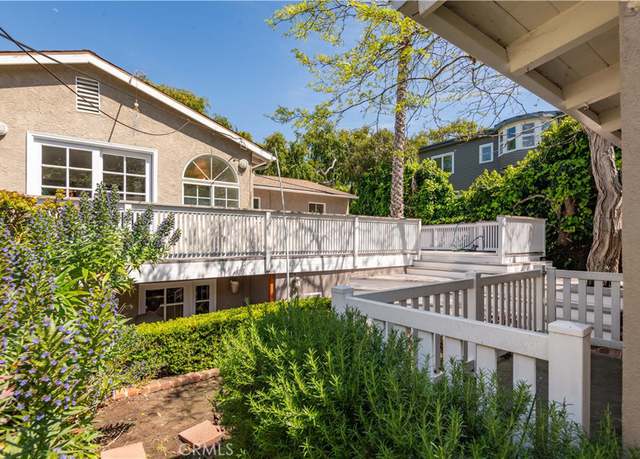
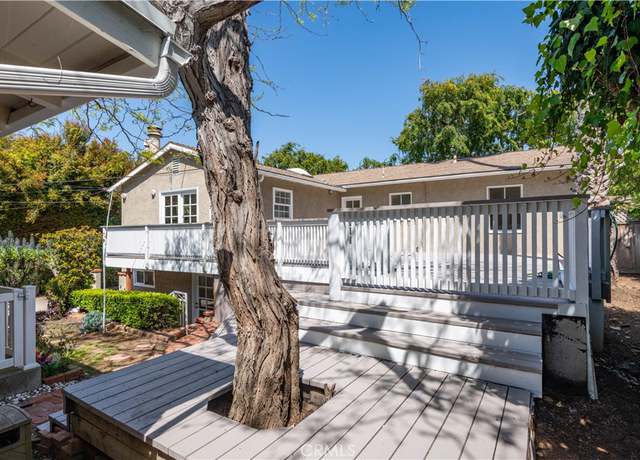
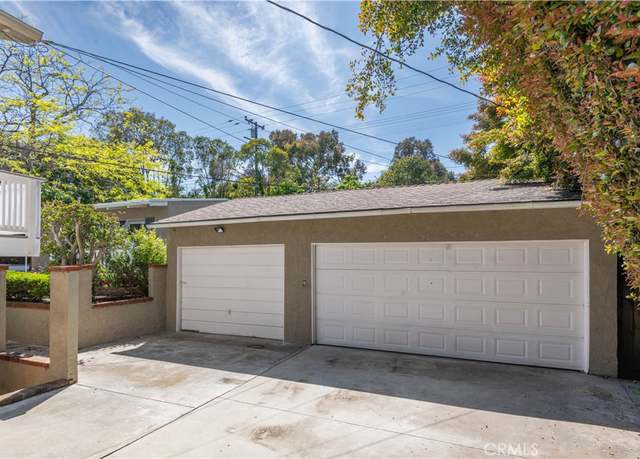
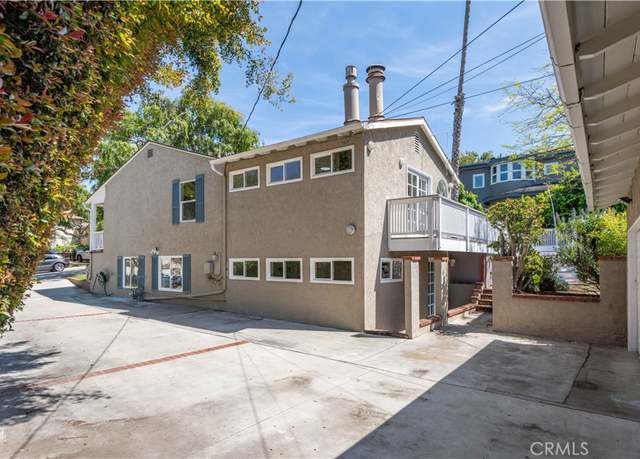
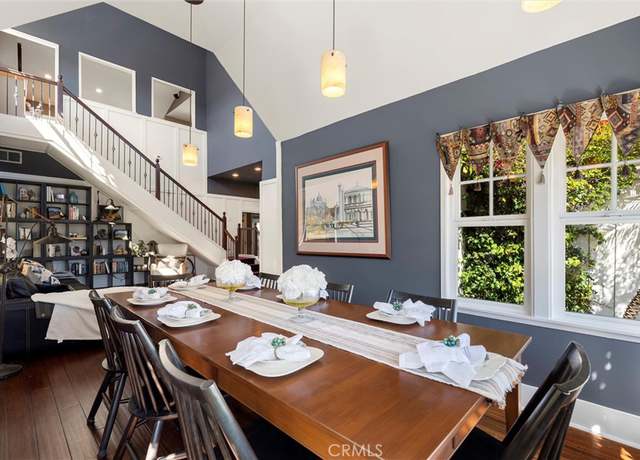
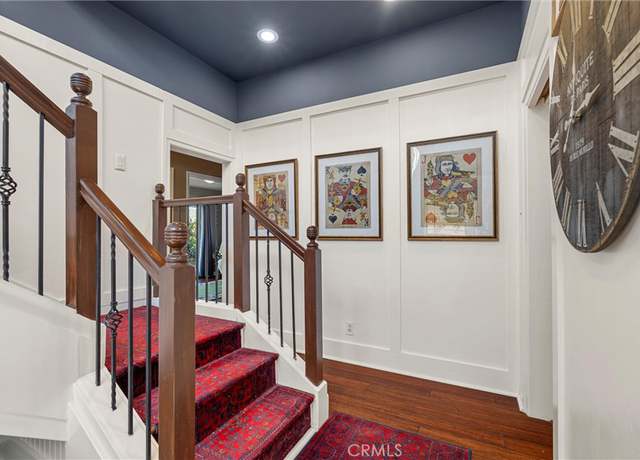
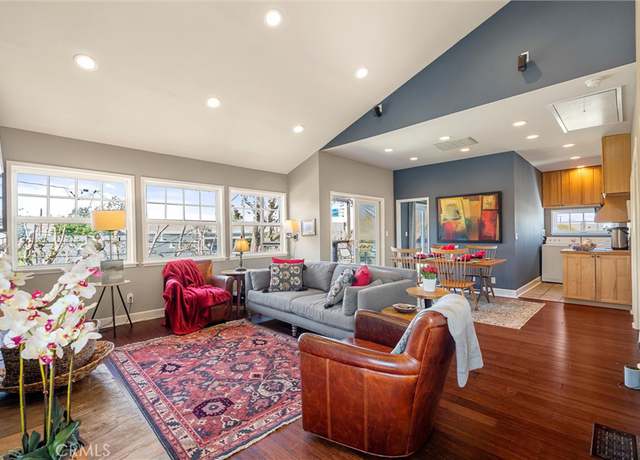
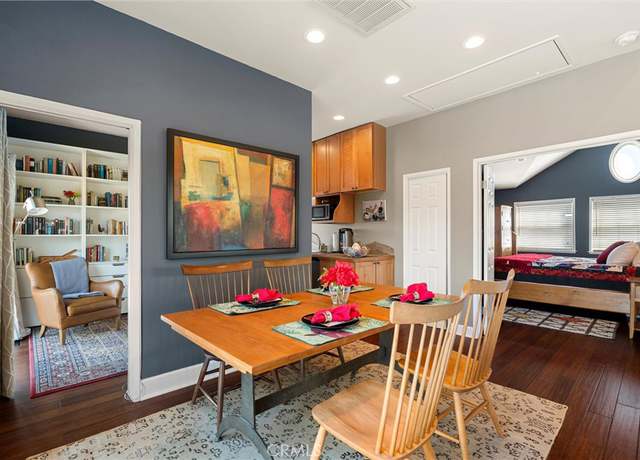
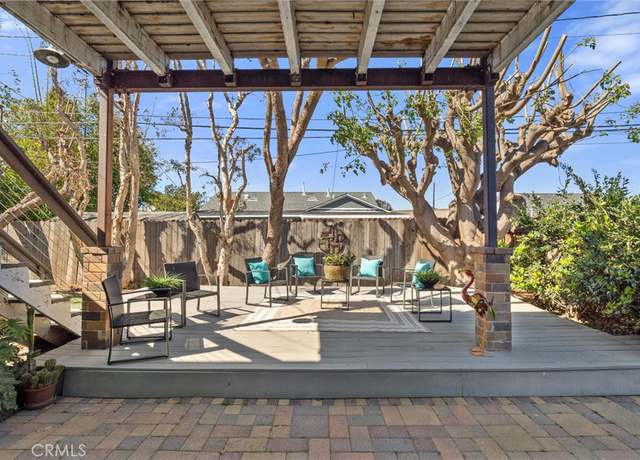
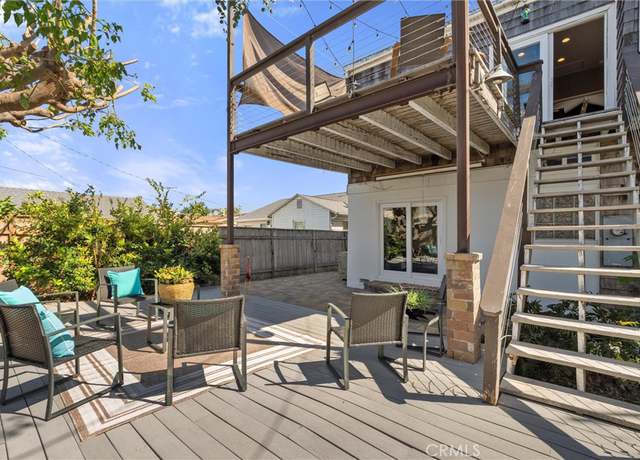
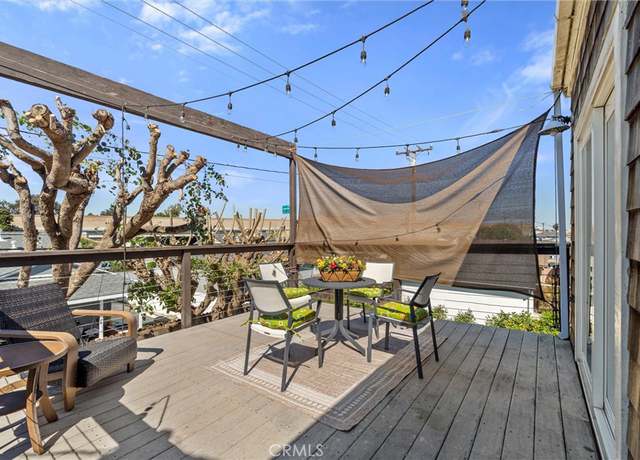
Welcome to this picturesque 2-story home nestled in the highly sought-after Seaside Ranchos 'sleepy hollow' community of South Torrance. Boasting excellent curb appeal and a charming front porch, this home sits on an oversized 11,157 SF lot, offering ample space for both relaxation and entertainment. The main level of this 2,300 SF home includes 4 bedrooms and 2 bathrooms, a living room, and a very spacious deck, perfect for everyday living and hosting guests. The generous primary suite offers a sizable walk-in closet, a full bathroom, and access to the rear deck. On the lower level, the heart of the home awaits - a spacious open great room that seamlessly integrates a modern kitchen with a
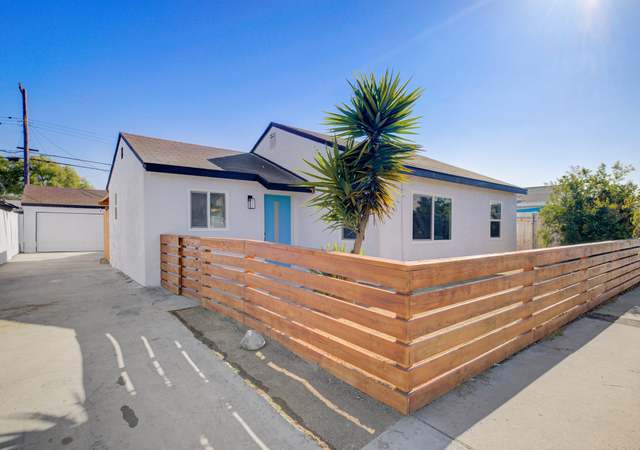
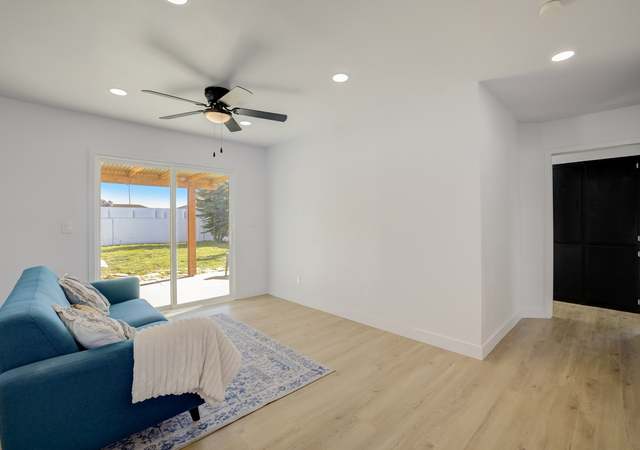
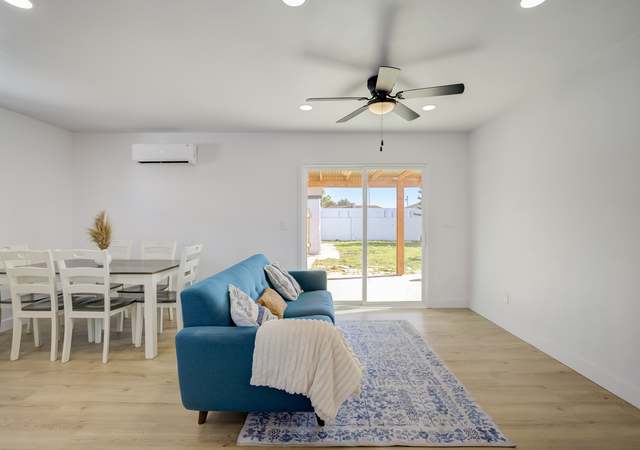
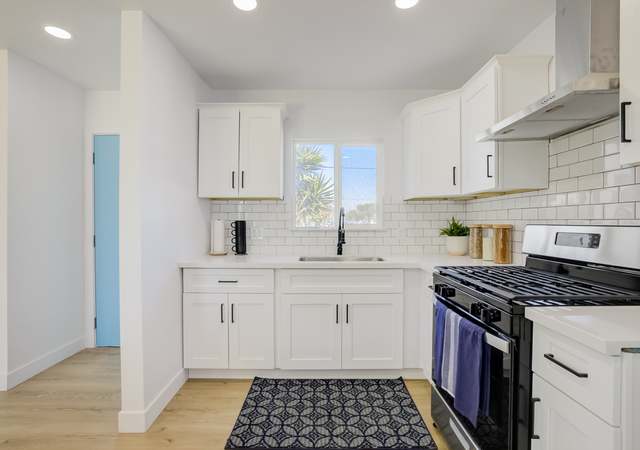
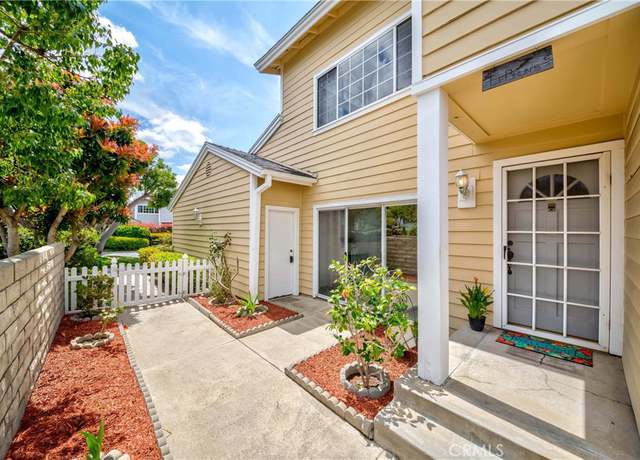
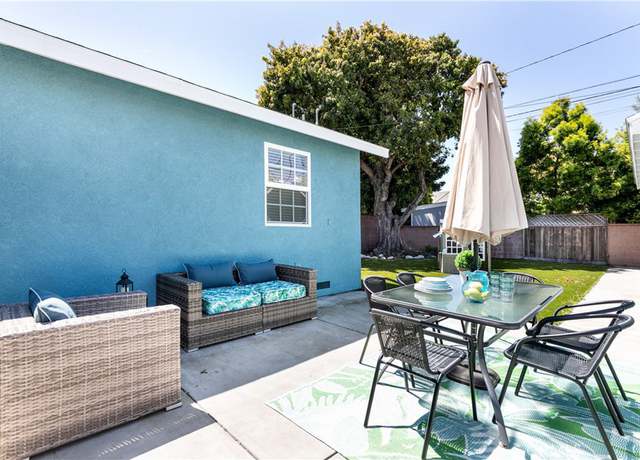
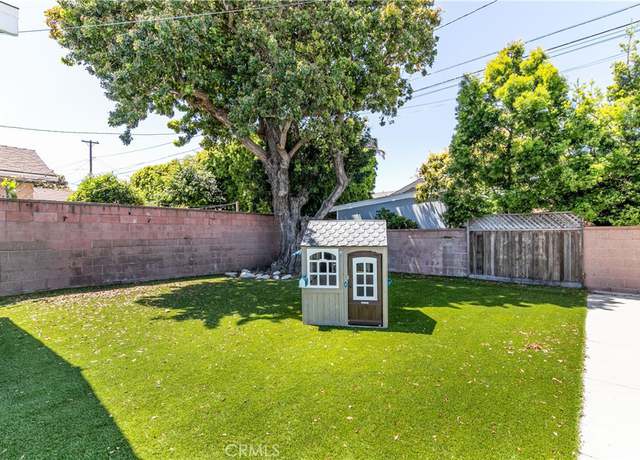
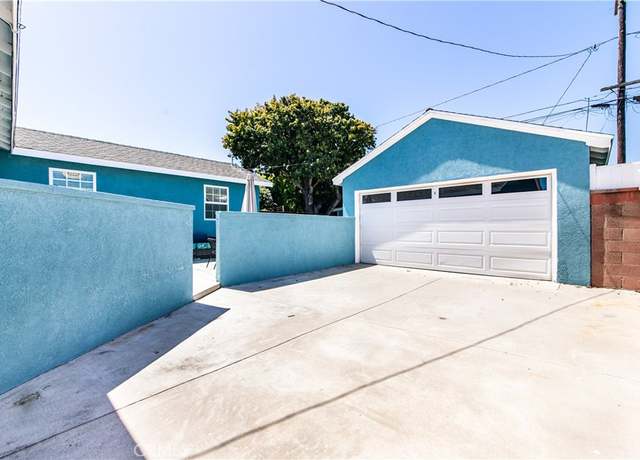
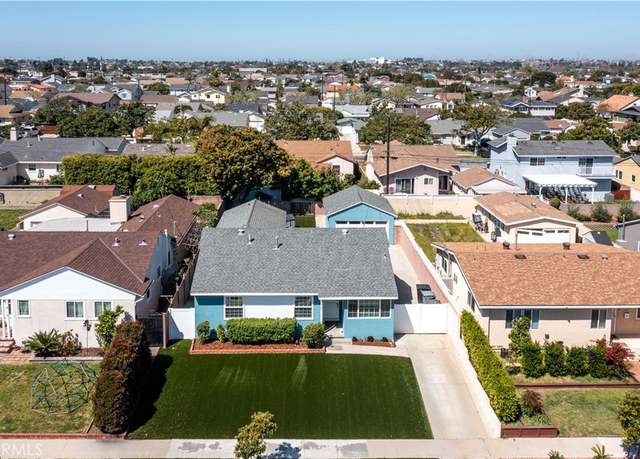
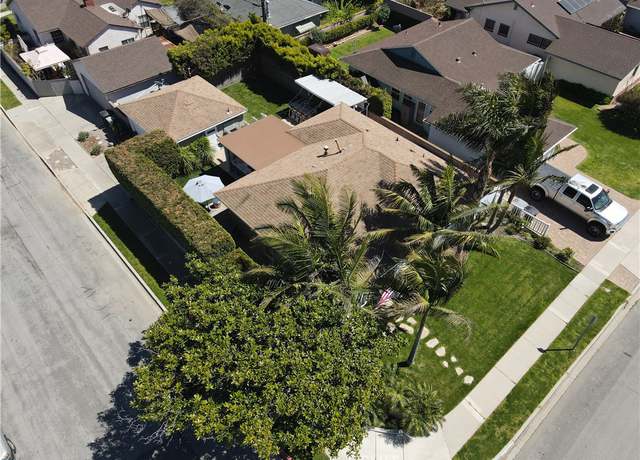
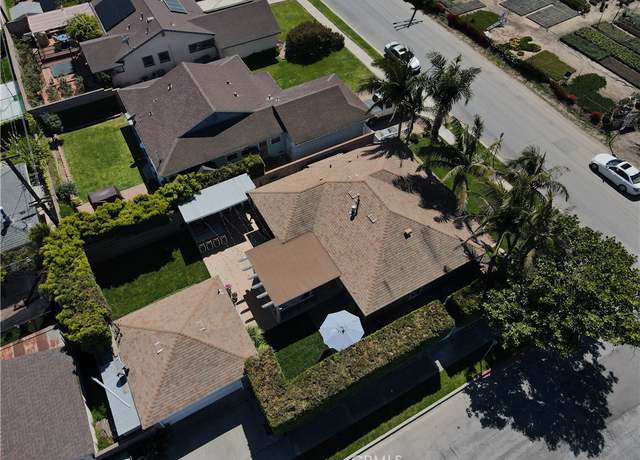
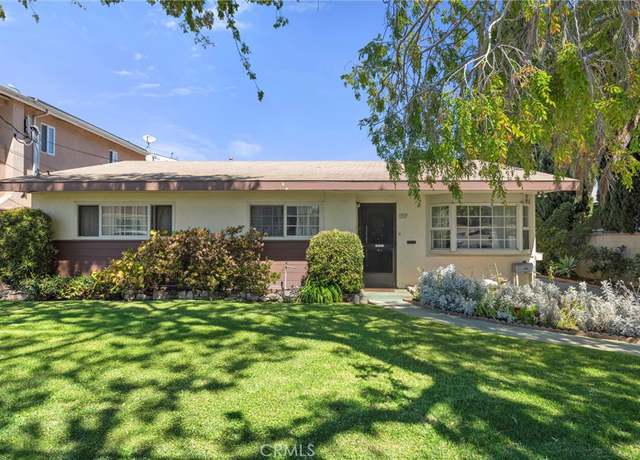
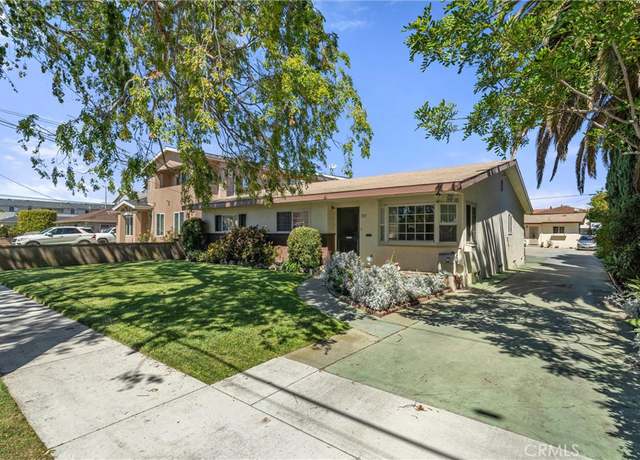
Opportunity Knocks! A corner lot, and an open floorplan in the extremely desirable Seaside Ranchos neighborhood of South Torrance! Featuring a great curb appeal, Upgraded electrical and plumbing! Spacious 3 bedrooms, 1 bath home with a fenced-in front yard offering complete privacy! Featuring a fully upgraded bathroom with tile shower, newer dual pane windows, upgraded kitchen cabinets, stainless streel appliances, wood floors throughout the home, tile flooring in wet areas, family room with a cozy wood burning fireplace, recess lights, central air, sprinkler system, and much more! A spacious entertainer’s backyard with enough room to play, BBQ, and features elegant landscaping, and p
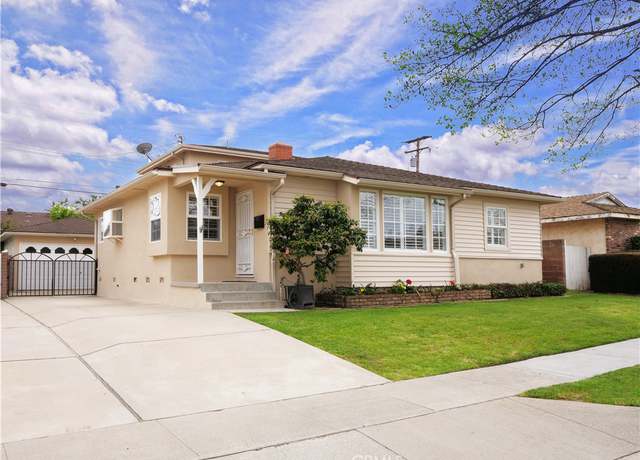
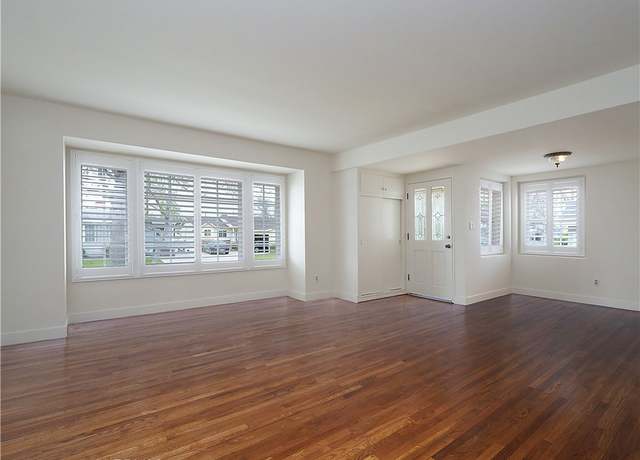
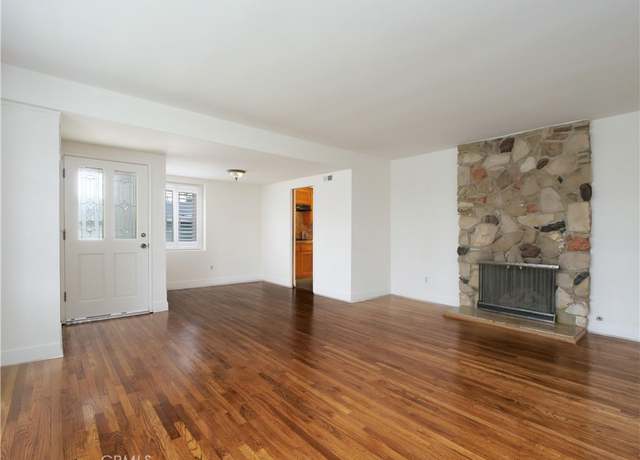
Welcome to your opportunity to own a beautiful home nestled in the heart of one of the most desirable neighborhoods in Torrance. Upon entering this charming single-story home you will be greeted by the warm embrace of original hardwood flooring in the living rooms and hallway and newer carpet in 4 bedrooms and tile in 2 remodeled bathrooms. The home features over 1500+ sf of spacious living space and an exceptionally large 8100+ sf lot. The yard has plenty of room for a possible ADU if you want to check with the city. The home is graced by an open floor plan feel with large living room, bay window and cozy brick fireplace just off the dining room. There is ample storage and closets througho
Corner Lot Home in Colony at the Park! Beautifully landscaped gated community with pool and spa. 3 bedroom, 2 1/2 bathroom, 2 story detached home. Primary bedroom with beamed ceiling & en suite primary bathroom. Spacious living room with gas fireplace. Family room that leads out to a large patio for entertaining. Very bright kitchen with bay window. Forced air heating and air conditioning. 2 car garage. This home is ready for you to fix up and customize with your choice of finishes. Close to freeway, stores, and restaurants!
Nestled in the middle of a tree-lined street, this move-in ready property has much to offer. With 2190 sq ft, 4 bedrooms and 3 bathrooms (one full bath and two ¾ baths) there is plenty of space for everyone. The property has a comfortable flow with beautifully refinished hard wood floors in the living room, dining area, hallway, and two of the bedrooms as well as custom made Norman wood shutters on windows throughout most of the property. As you enter, you will first see the spacious living room with hardwood floors, wood burning fireplace, and wood shutters. From the dining area, you enter the kitchen with granite counters and high-end appliances (KitchenAid double oven, Samsung sta
Welcome to your slice of heaven in Torrance! This home is the real deal—perched on an elevated lot. Nicely remodeled throughout. Inside, it's like a whole new world. The new kitchen and dining area? Bright with windows and lighting, beautiful shiny quartz countertops and cabinets and drawers that close oh-so-smoothly. Plenty of room. With 3 bedrooms, including a primary suite that's like your own little sanctuary, there's plenty of space for everyone. Both bathrooms are updated with new showers, lighting, vanities (double sink in the primary). There is also a separate laundry room with an indoor tankless water heater. When it's time to relax, cozy up by the gas fireplace in the living
Three Bedroom Torrance Home with Large Family room. Home Improvement necessary. Kitchen and baths makeover a must. An opportunity for the do-it-yourself individuals. Torrance Schools just a few blocks away.
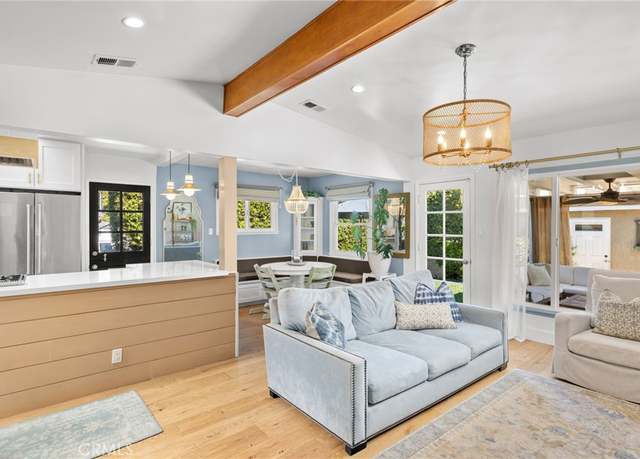
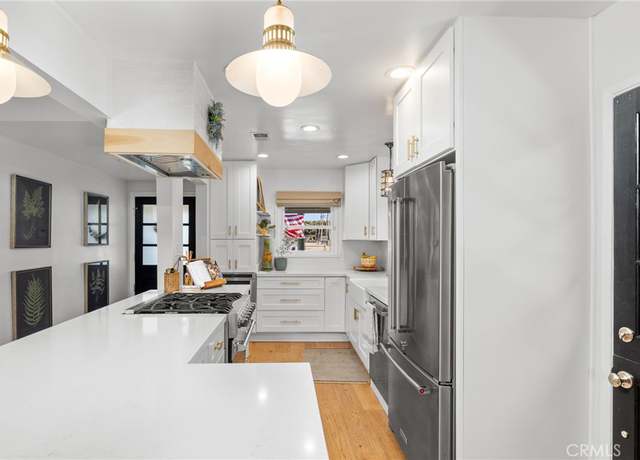
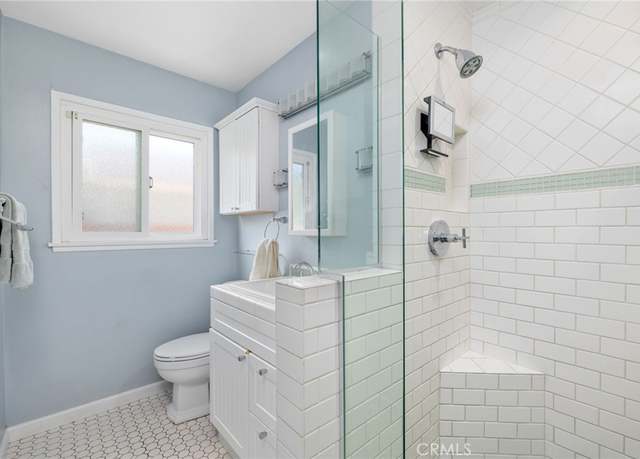
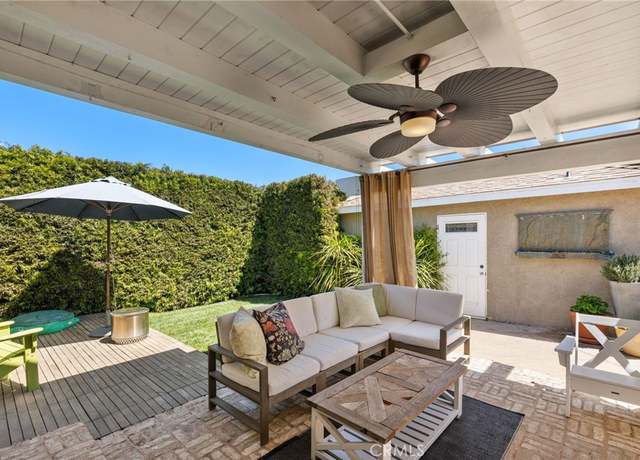
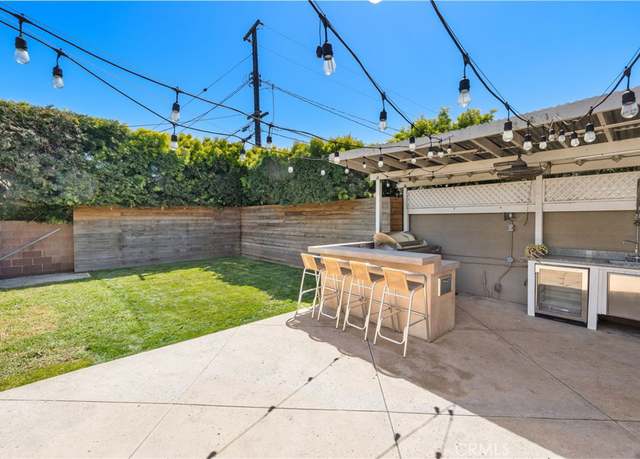
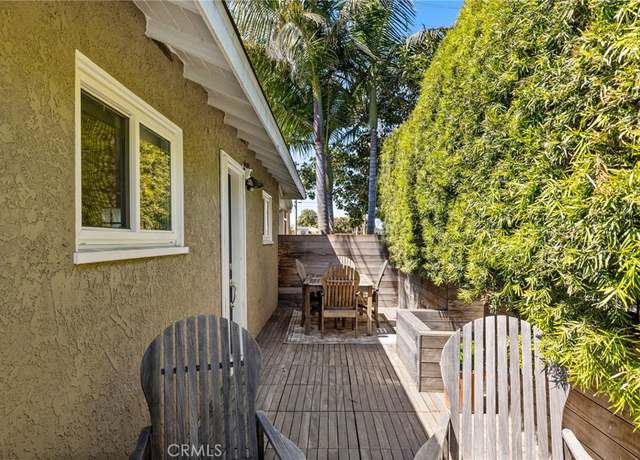
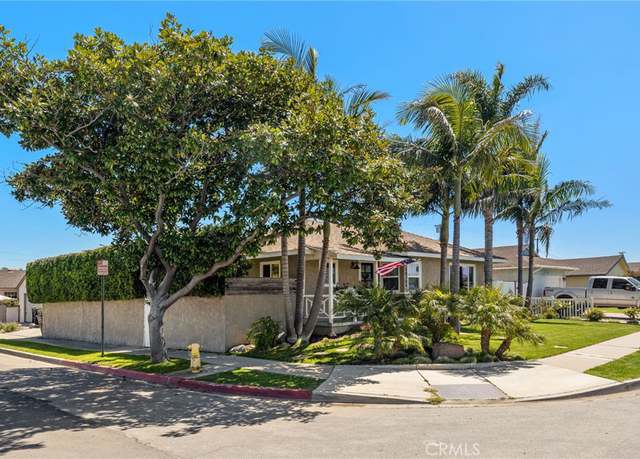
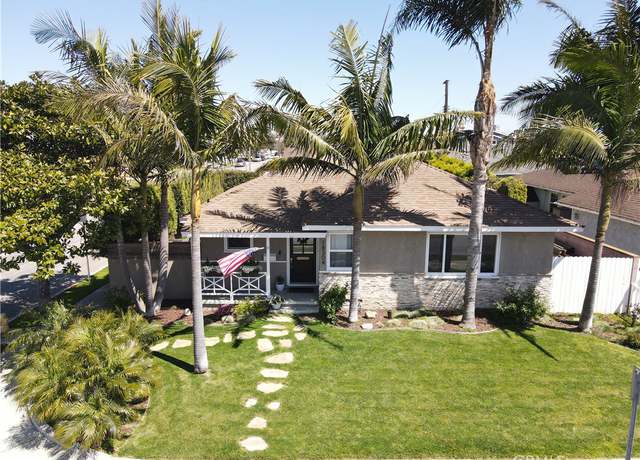
An unobstructed ocean view with a backyard paradise! Arguably one of the largest lots and best views in the Hollywood Riviera, with a backyard oasis to entertain all your friends, or enjoy the tranquility and privacy of the ultimate luxury beach lifestyle, complete with sparkling swimming pool, sports court, and putting green. This cute ONE-LEVEL coastal vibe home includes 4 bedrooms, 1 3/4 bathrooms, perched up on a rare 12,385 square foot lot. The bright and cheery open floor plan includes living room with crackling wood-burning fireplace, dining area and family room, all flooded with light and opening up to the fabulous backyard. Enjoy a short stroll to the beach and Riviera Village shop
Welcome to a property that caters to the comfort and style of modern living. The primary bathroom is a sanctuary of relaxation with double sinks, and the luxury continues with a separate tub and shower designed for ultimate comfort. The kitchen, fitted with all stainless steel appliances, exudes chic sophistication. A cozy fireplace adds charm and warmth to the living area, serving as a beautiful focal point. The interior of the home sparkles thanks to a fresh coat of neutral color paint scheme, enhancing the overall visual appeal. The outdoors of the property are as impressive, boasting a covered patio - perfect for BBQ nights or morning coffees - complemented by a fenced in backyard ensur
Come check out this well-maintained home built in 1993. From the high rise ceiling in the kitchen to the enclosed patio and four fruit trees in the back yard (lemon, orange, persimmon and loquat). Desirable Torrance school district and close to El Camino College.
Newly renovated move-in ready single level 3-bedroom 2-bathroom unit is located in the Pacific Terrace gated community. It's conveniently located minutes away from a highly ranked elementary school in the Torrance unified school district, parks, shopping, restaurants, and a medical center. Its top floor corner location high ceilings, open floor plan, and mountain views. The community has Spanish-style courtyards, large swimming pool, and spa, a party in the clubhouse, and exercise room. The kitchen is beautifully appointed with new stainless-steel appliances and opens to the great room with a fireplace. Spacious bedrooms and a flexible floorplan make working from home. Side-by-side parking
Experience the epitome of suburban living in this stunning 2,580 sq. ft. single-family home nestled in the prestigious Park Place gated community in North West Torrance. This beautifully designed home offers a perfect blend of space, style, and comfort with its 4 bedrooms, 3.5 bathrooms, and a versatile den that can be used as a home office, formal living room, guest bedroom, or recreation room. As you enter, you are greeted by an open floor plan that seamlessly connects the living room, dining area, and kitchen, making it ideal for entertaining and everyday living. The kitchen is a chef's dream with top-of-the-line appliances, ample counter space, and exquisite finishes, ensuring both func
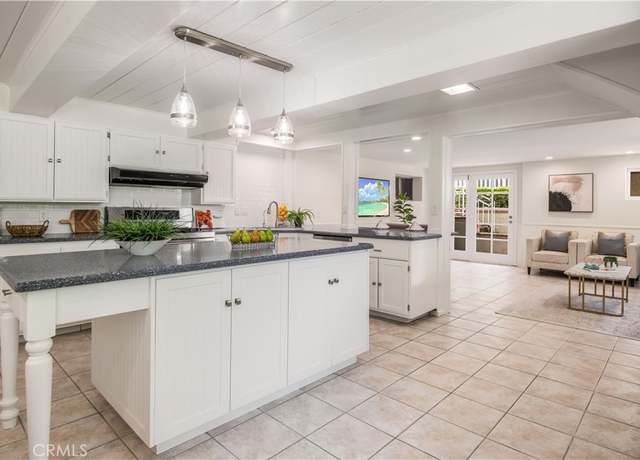
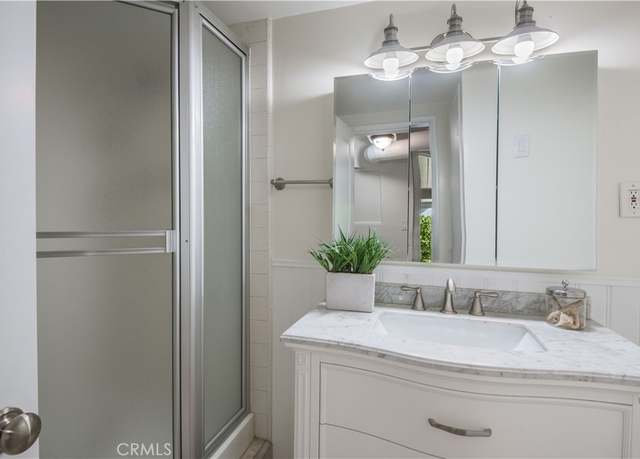
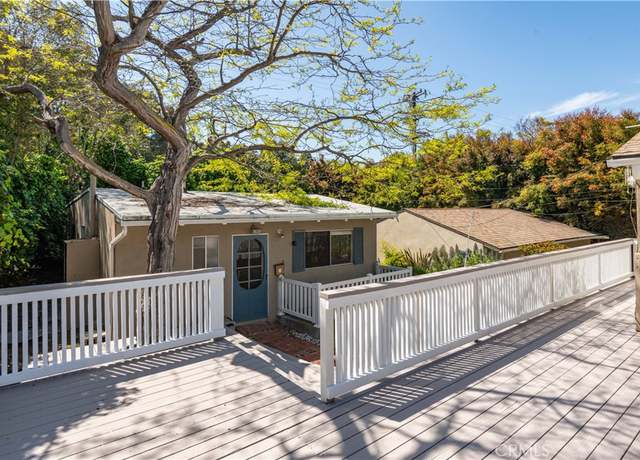
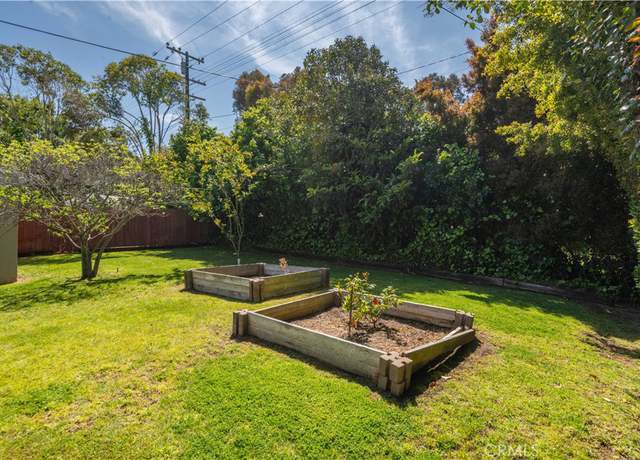
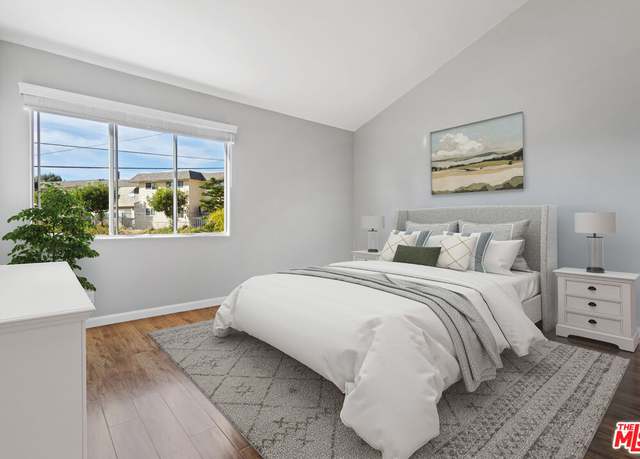
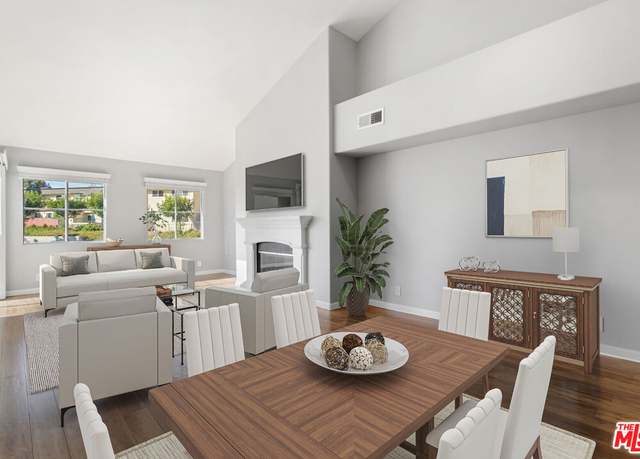
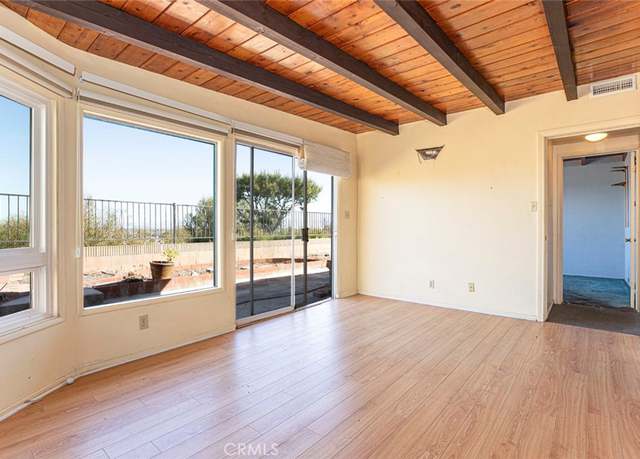
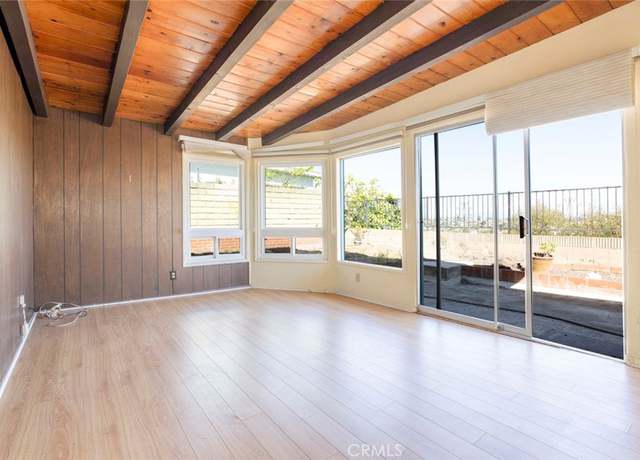
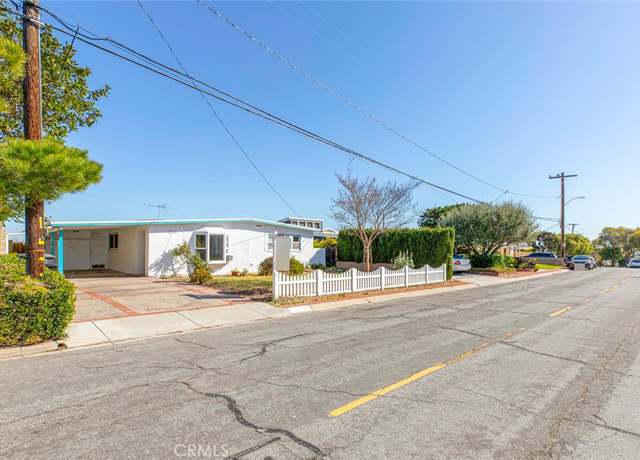
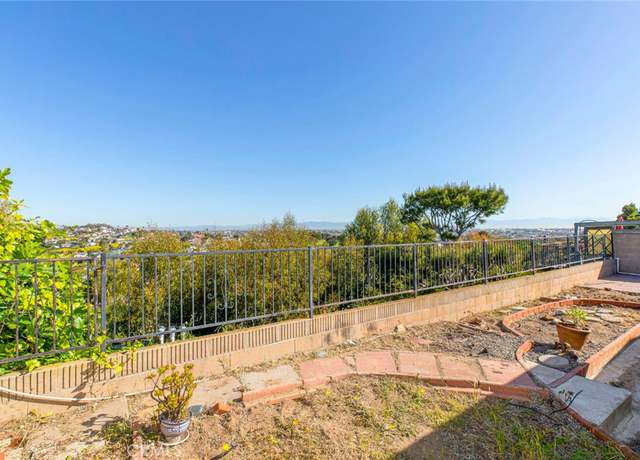
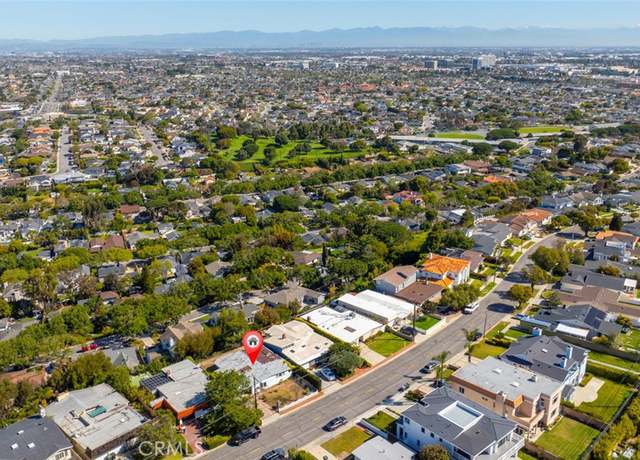
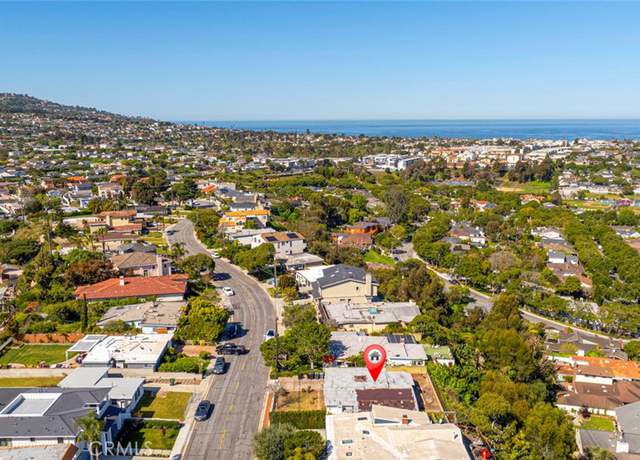
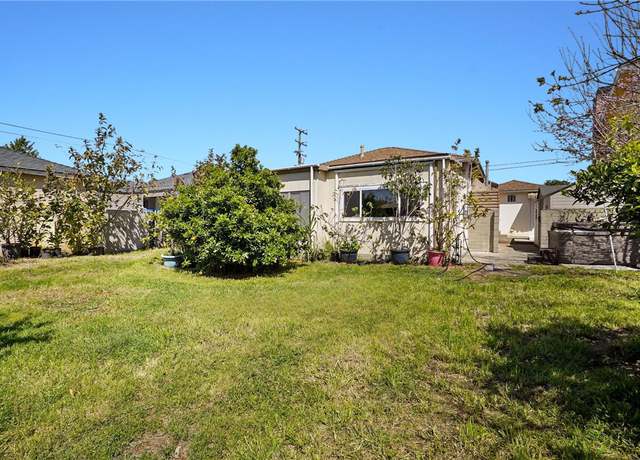
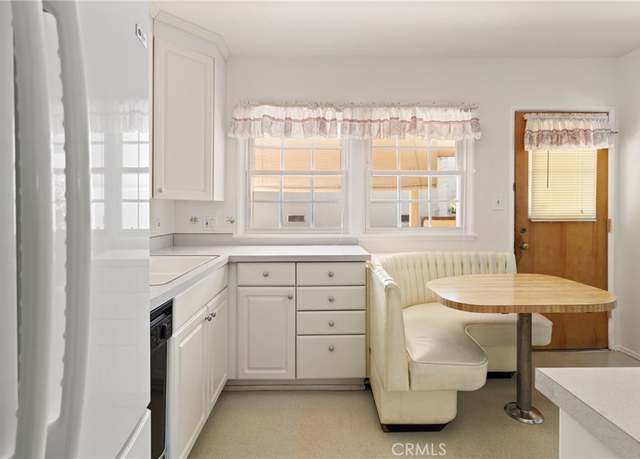
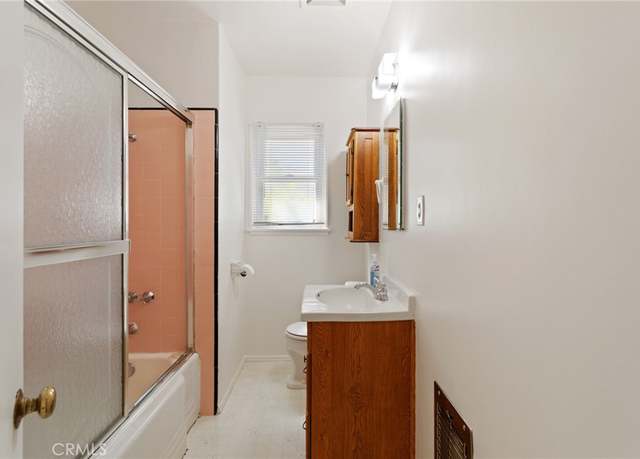
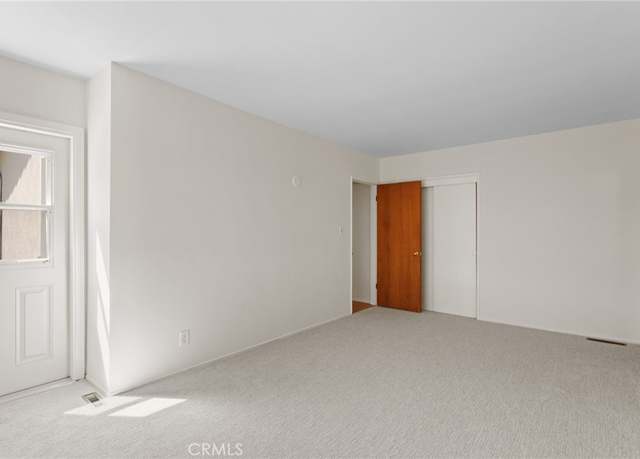
Location, location, location! Here is your exciting opportunity to personalize your own fixer upper in Seaside, South Torrance, that offers amazing views from your backyard! This is the first time for this single-family home to come on the market in over 70 years! Just minutes from Del Amo Mall, Torrance Beach, and walking distance to Seaside Heroes Park. Families will appreciate being nearby award-winning South High School, Seaside Elementary, and Calle Mayor Middle School, while golfers will enjoy being close to Sea-Aire Golf Course. And for those with holiday spirit, this neighborhood participates in annual holiday lights display! Admire the wood beam ceilings, and the convenience of a s
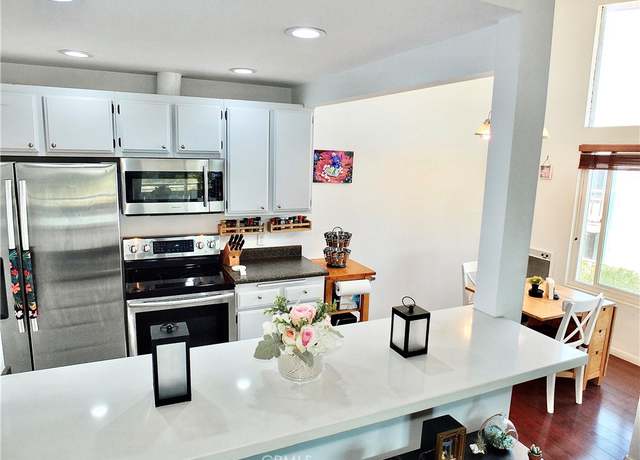
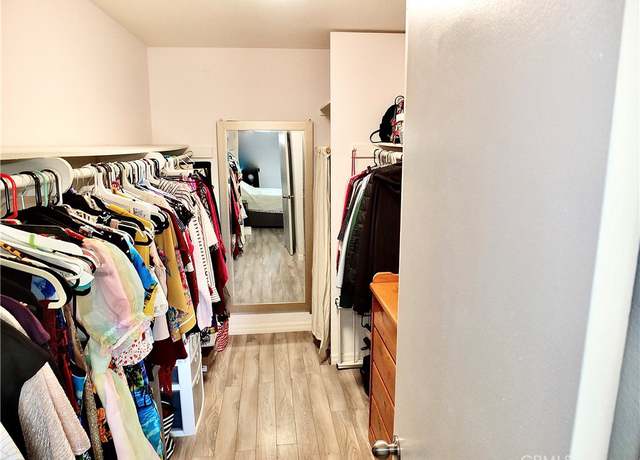
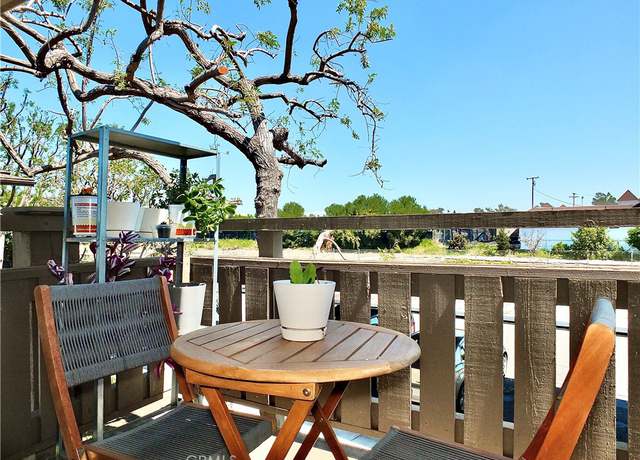
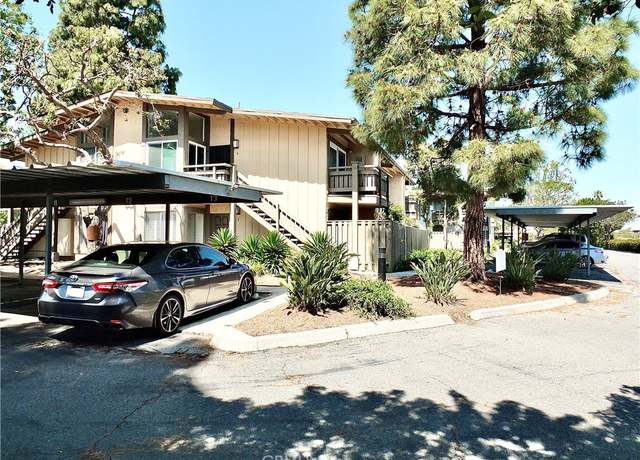
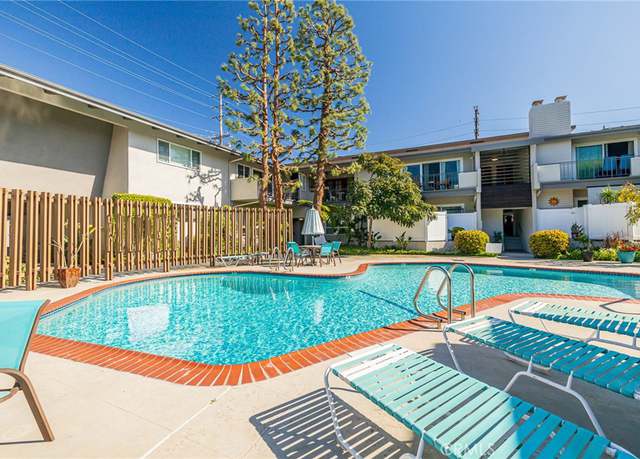
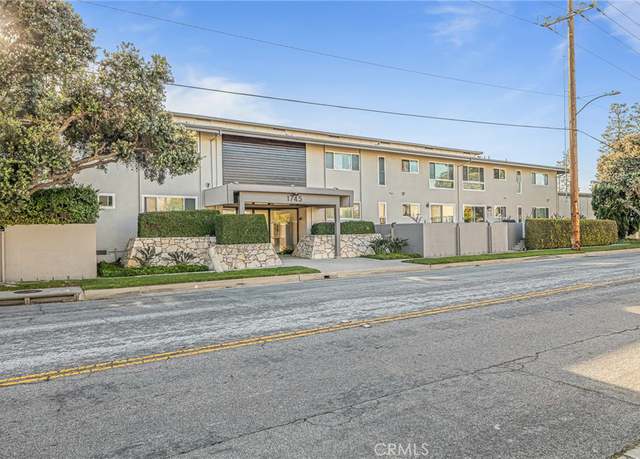
Nicely remodeled 1 bedroom, 1 bathroom top-floor condo located in the prestigious gated Ponderosa Pines community. This flawless unit features soaring ceilings, elegant new faux-wood flooring, a modernized kitchen with pristine white countertops, and a tastefully refreshed bathroom. The expansive living room boasts a sliding glass door that opens to a covered balcony, complete with additional storage. Other highlights include a walk-in closet, two designated parking spaces, communal laundry facilities, a rejuvenating pool and spa, and modest HOA dues of just $385/month. Situated on the second floor, this corner condo offers privacy, tranquility, and convenience. Built in 1978 and set across
Welcome to 2801 Sonoma Street in the highly desirable area of Central Torrance. This charming 4-bedroom, 2-bathroom home offers a cozy retreat on a quiet street. Boasting 1788 square feet of living space on a generous 6024 square foot lot, this property features a 75+ year old avocado tree, providing a serene backdrop for outdoor enjoyment. Recently updated with new interior and exterior paint, as well as new flooring, the home exudes a fresh and inviting ambiance. The remodeled bathrooms and kitchen add modern flair. With a long driveway for RV or boat parking, this home is ready to accommodate your lifestyle. Don't miss the opportunity to make this delightful property your own!
Extremely well-maintained condominium steps from Torrance Park. Move right in with the confidence that this home has been lovingly cared for. This complex has great curb appeal - walk up through private gate to a huge patio in front of unit which provides plenty of room for plants and outdoor furniture. Hardwood floors (not laminate) are found throughout the unit, and there are beautiful plantation shutters in all windows. The living room and dining area are open to kitchen with one half-bathroom downstairs. Tiled counters and gorgeous celadon cabinets with adjoining small balcony give the first floor vibrancy. Upstairs, there are two good-sized bedrooms with a double-vanity bathroom and lo
Welcome home to this spacious Torrance home with three bedrooms, remodeled bathroom, large backyard, work shed and garage as well. Fresh paint and flooring makes this home really stand out.
This wonderful single level home is in the premium Seaside neighborhood of South Torrance. First time on the market in approximately 60 years. 3 beds - 2 baths on a 7,144 square foot lot. May have potential to build an ADU. The home has been updated over time with a primary bedroom, bathroom and walk-in closet addition. Extra "Sun Room" - Bonus Sun room at the rear (not included in sq. ft. ) Includes a Front living room, Dining room off Kitchen, Large rear Family room. Previously updated Kitchen, HVAC, Vinyl windows, Copper plumbing, and a 200 Amp electrical panel, with a freshly painted interior. Detached garage with a storage room and spacious driveway. Conveniently located, it&
Welcome to your new home at 2440 West 239th Street. Located in the highly desirable Southeast Torrance neighborhood. This charming property offers 3 bedrooms and 2 stylish bathrooms within its 1129 square feet. Situated on a generous 5495 square foot lot, this gem boasts a private tree-lined back yard, providing a serene retreat for relaxation or entertaining. Recently remodeled, this residence exudes a fresh and modern ambiance, with new flooring and paint throughout. The updated kitchen and bathrooms add a touch of contemporary elegance. Nestled on a flag lot with a semi-private drive, this home offers a sense of seclusion and tranquility. Whether you're enjoying the peaceful outdoor spac
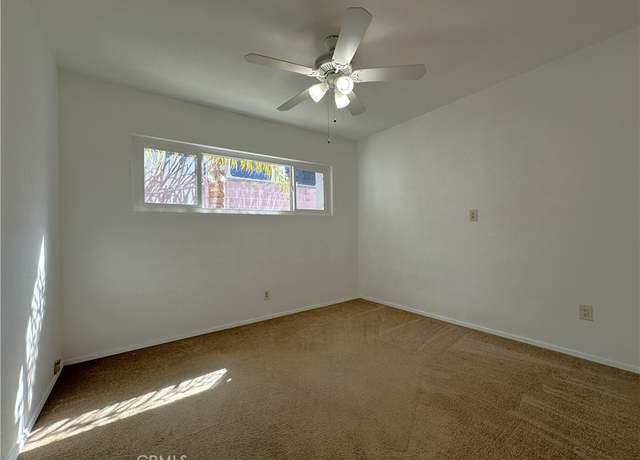
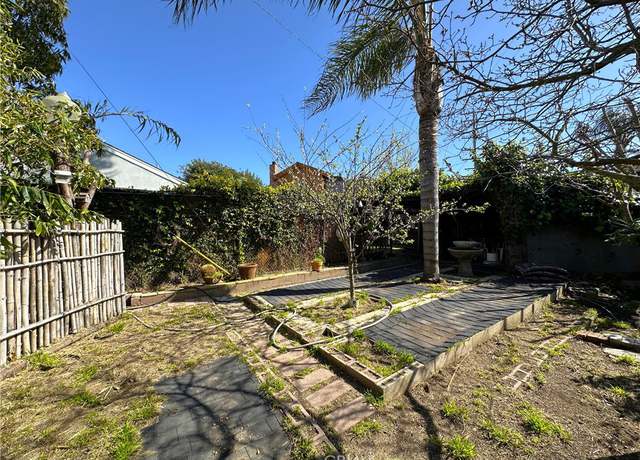
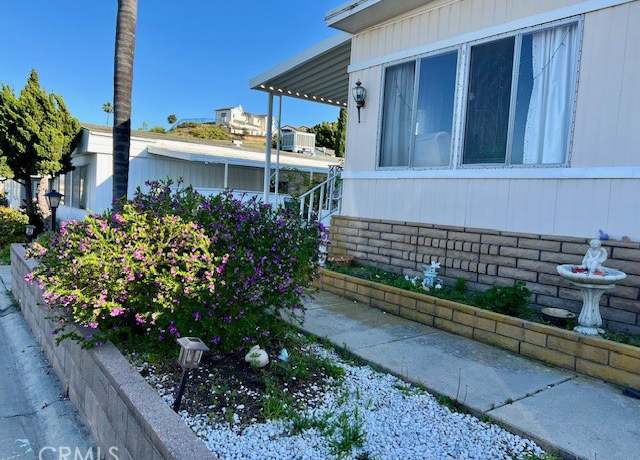
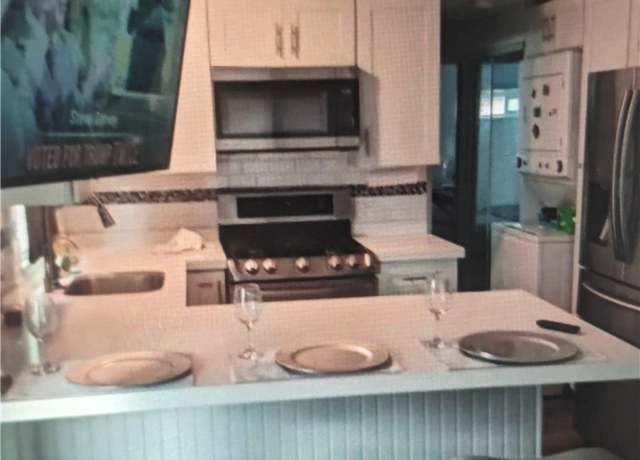
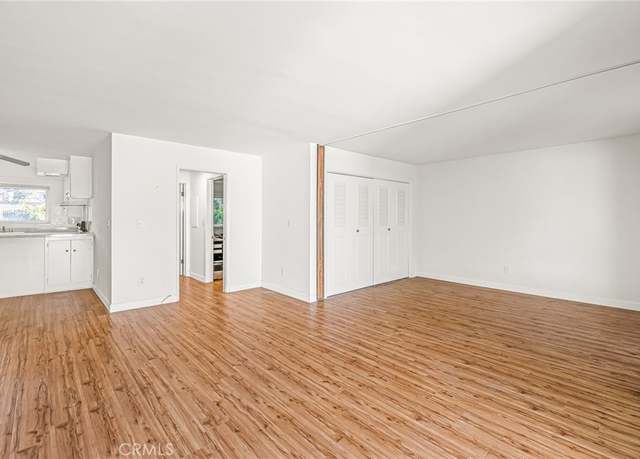
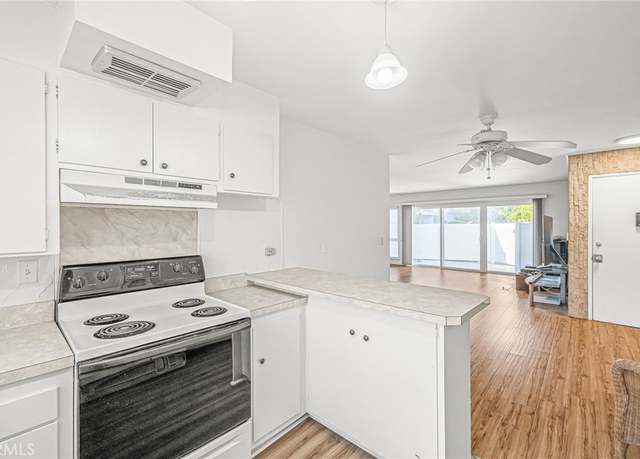
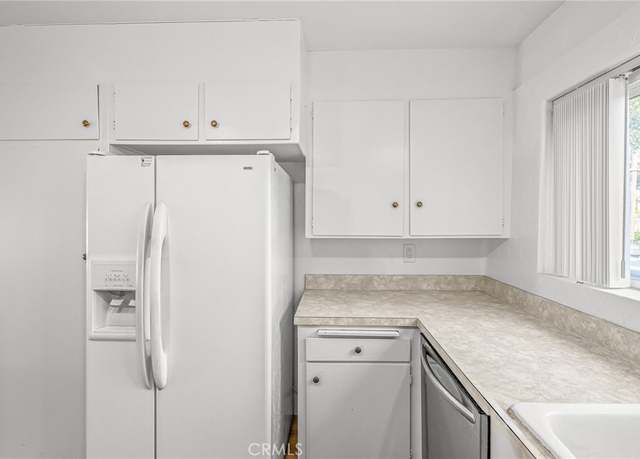
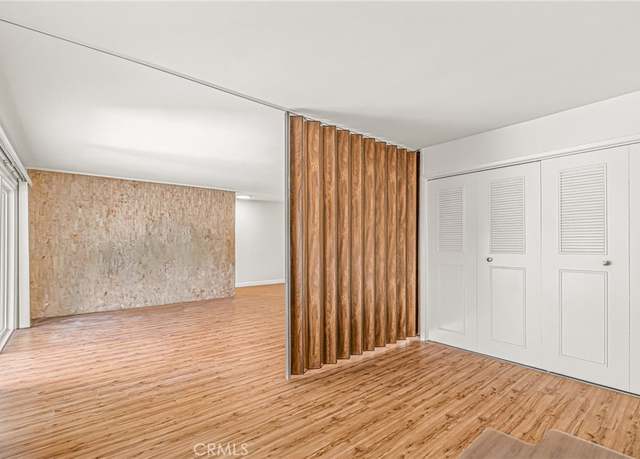
Great location at top of hill with extra large deck on a large lot located in desirable Skyline Mobile Home Park. This spacious well maintained two bedroom home has laminate flooring throughout. Central heating and air. When entering the home the first thing you notice is the large open space floor plan with open kitchen. Country kitchen and bathroom have been upgraded. Large master bath. Included are refrigerator, range and shed. Skyline is a 55+ community offering many amenities such as pool, hot tub, billiard room with two pool tables, recreation room and lots of activities. Covered carport with room for two cars. Located across the street from Rolling Hills Shopping Center, close to res
1/17
$249,000
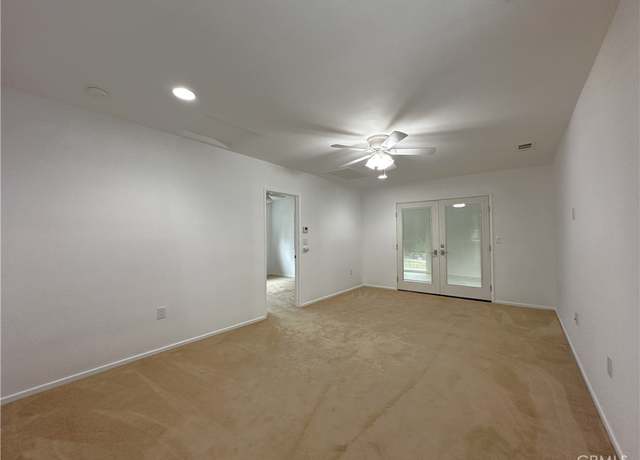
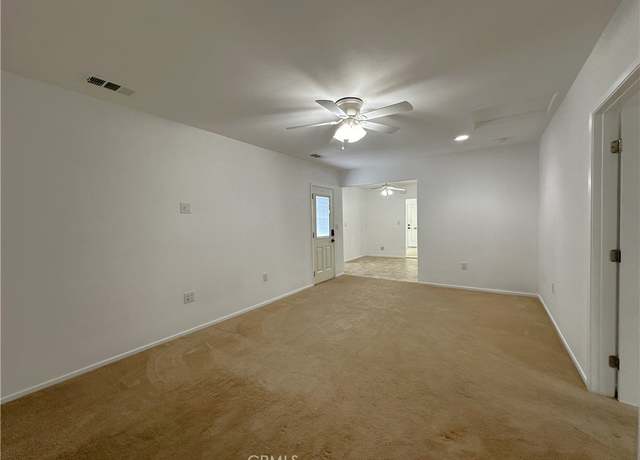
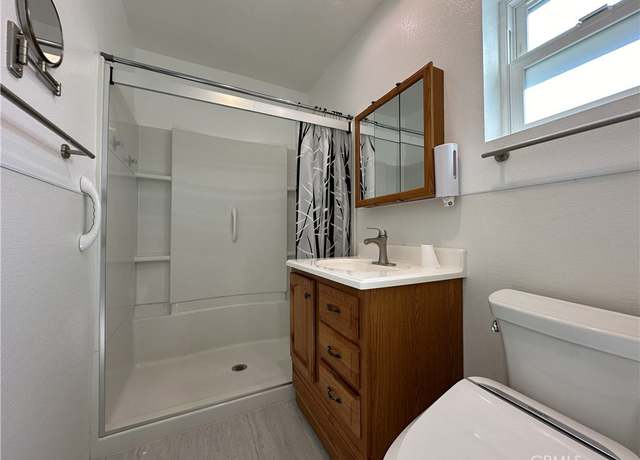
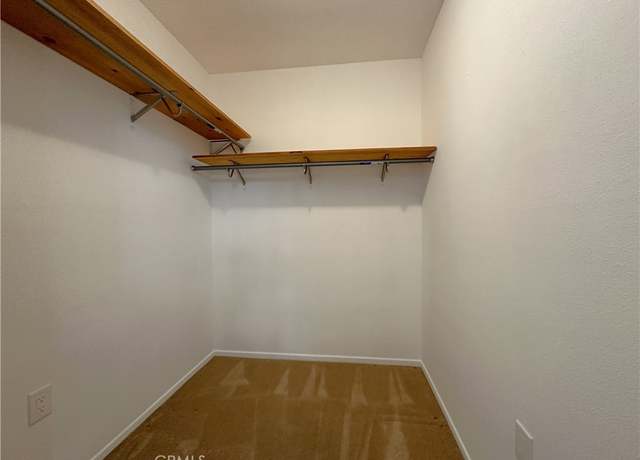
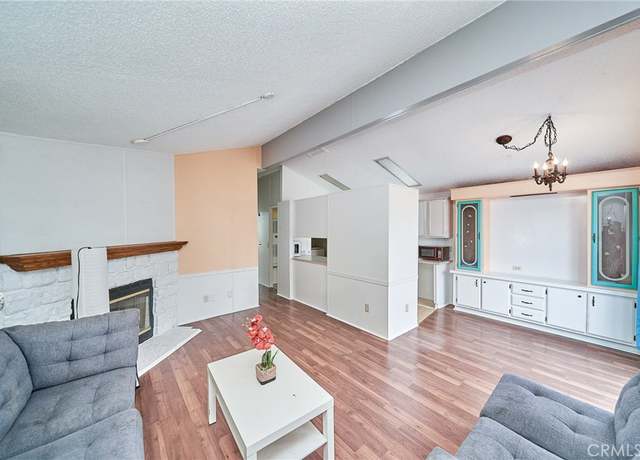
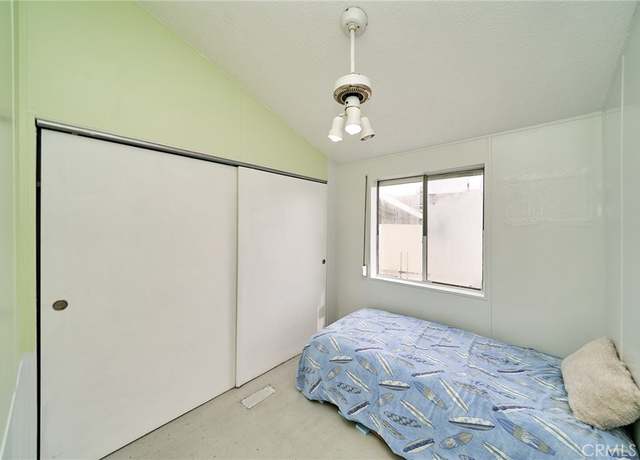
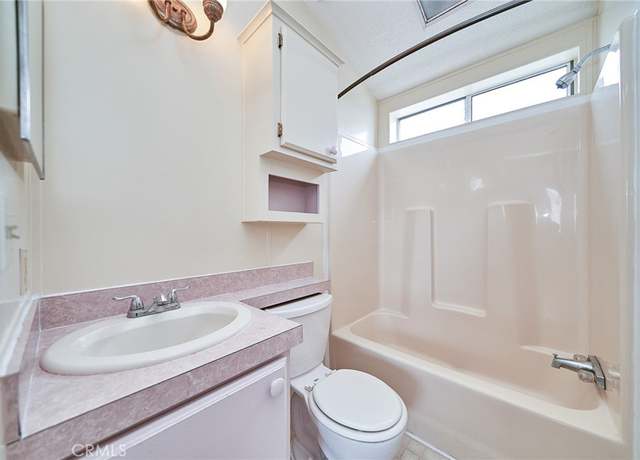
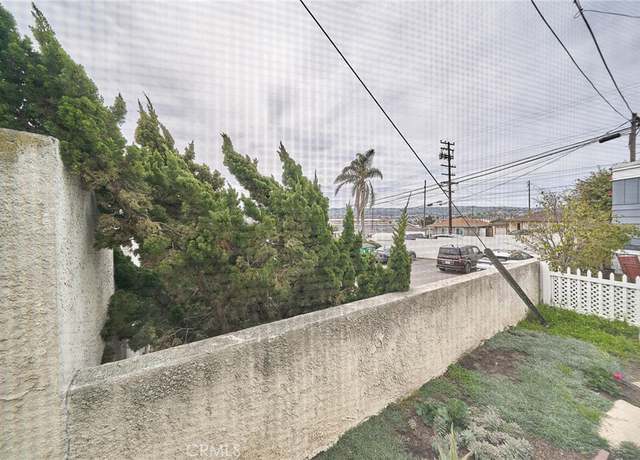
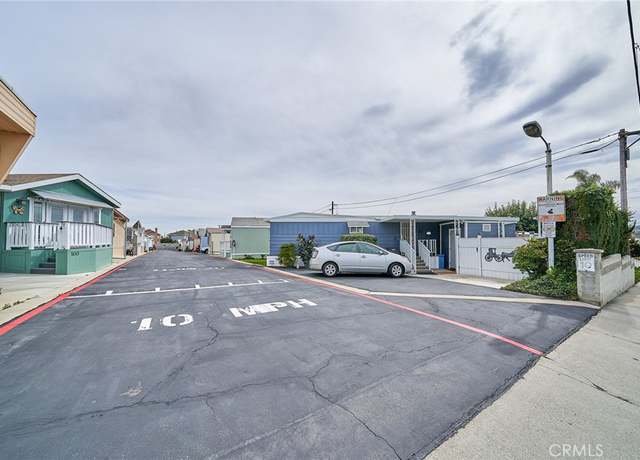
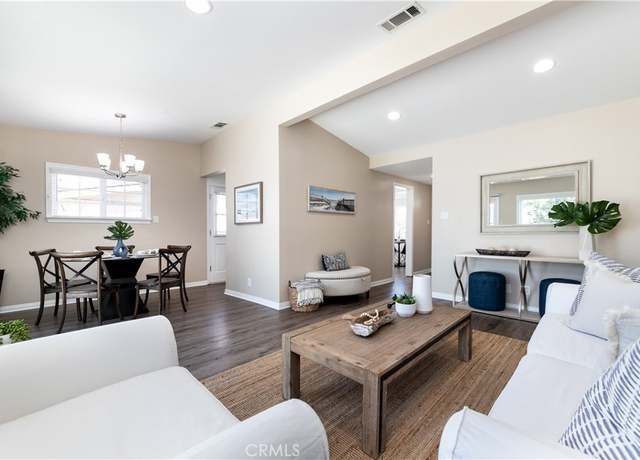
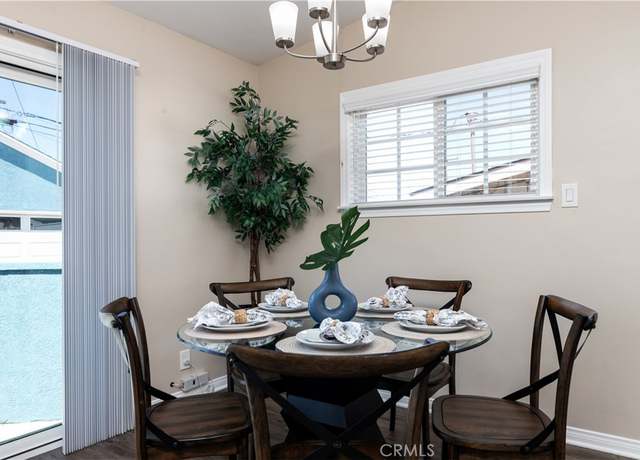
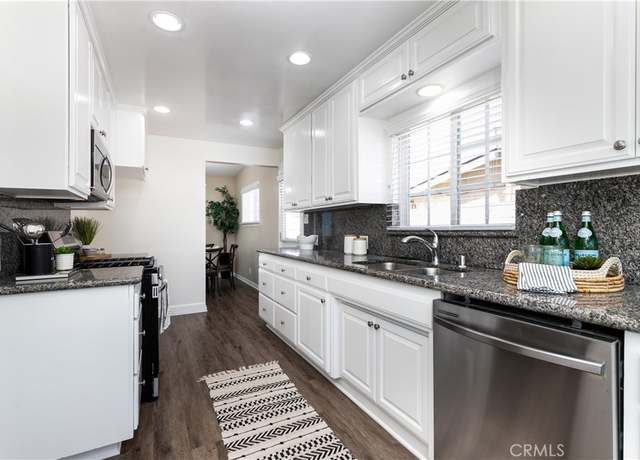
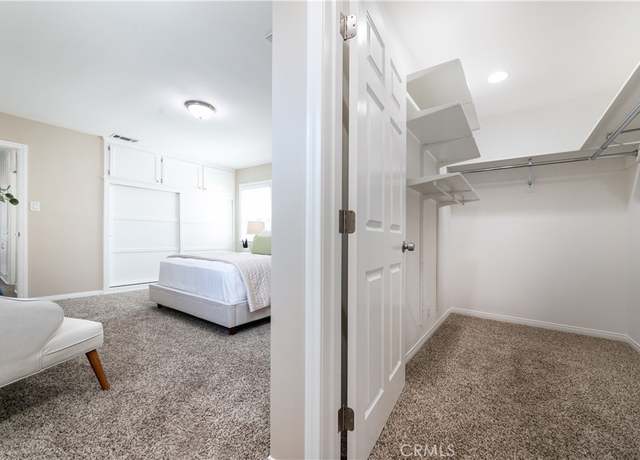
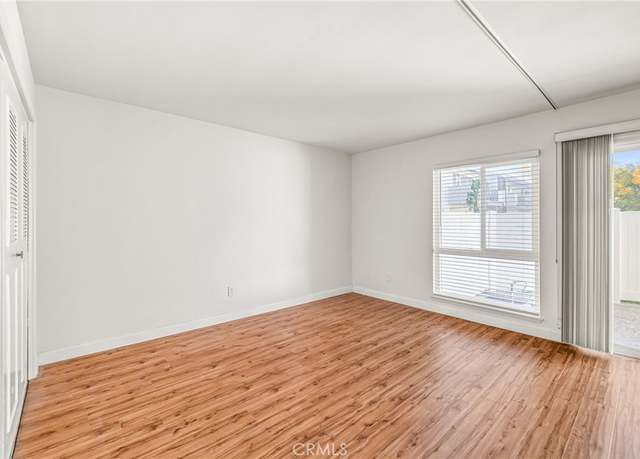
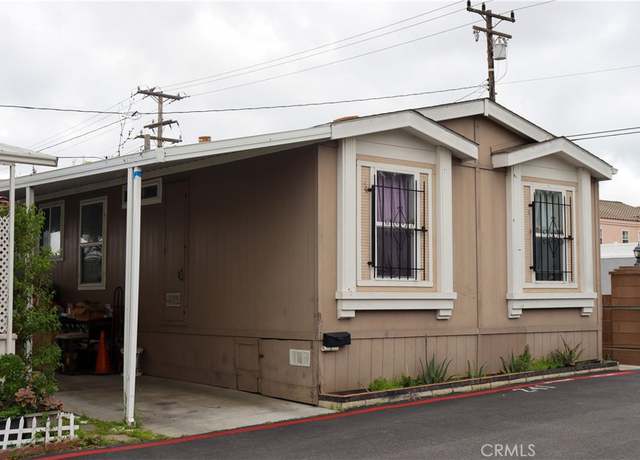
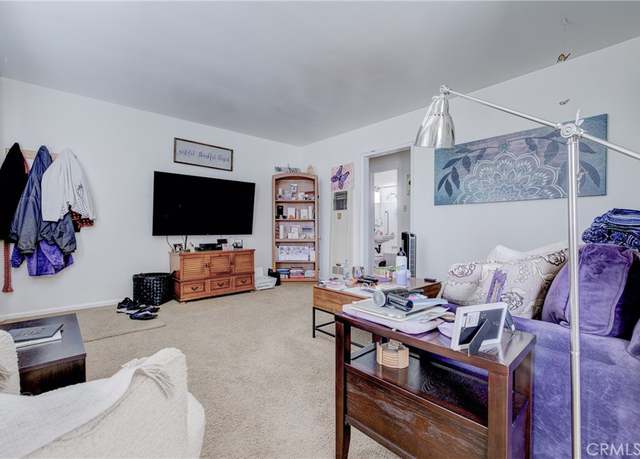
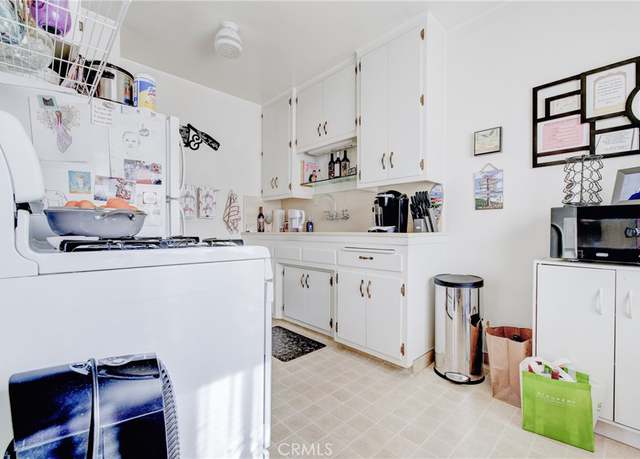
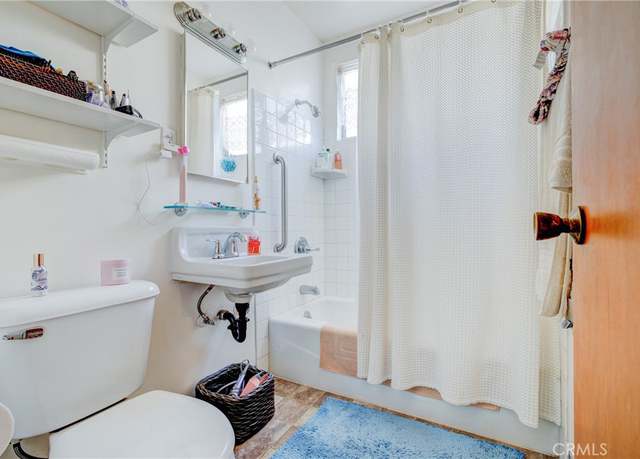
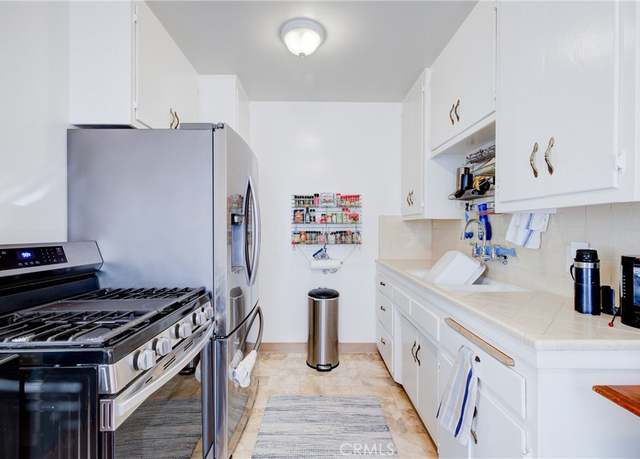
2 beds1.5 baths1,440 sq ft
2550 Pacific Coast Highway #243, Torrance, CA 90505
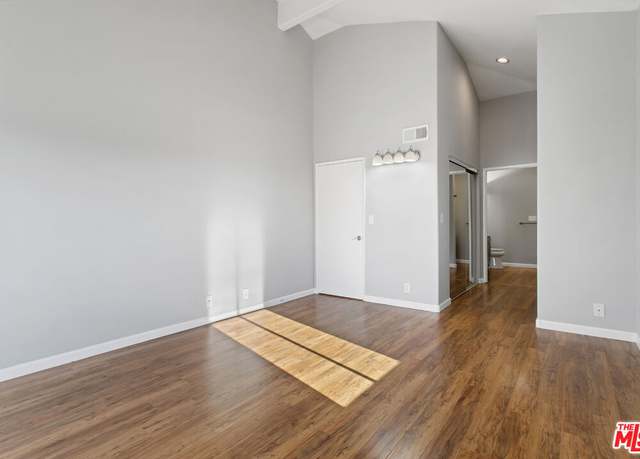
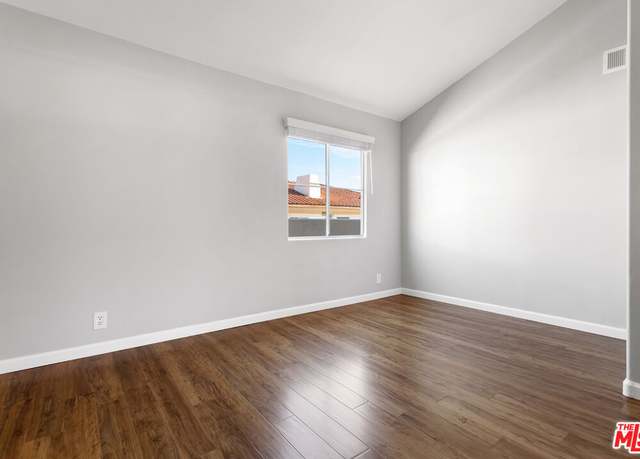
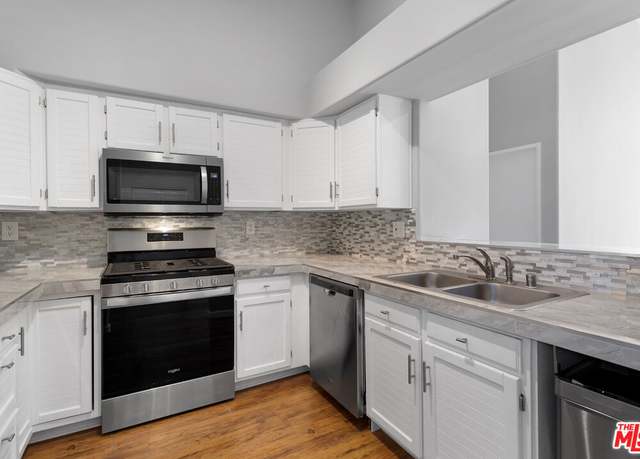
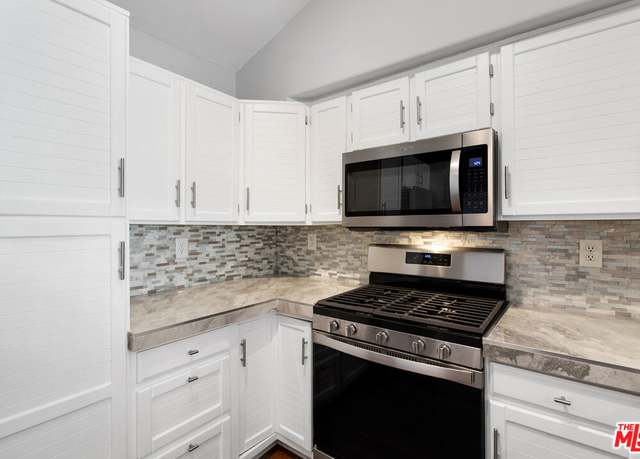
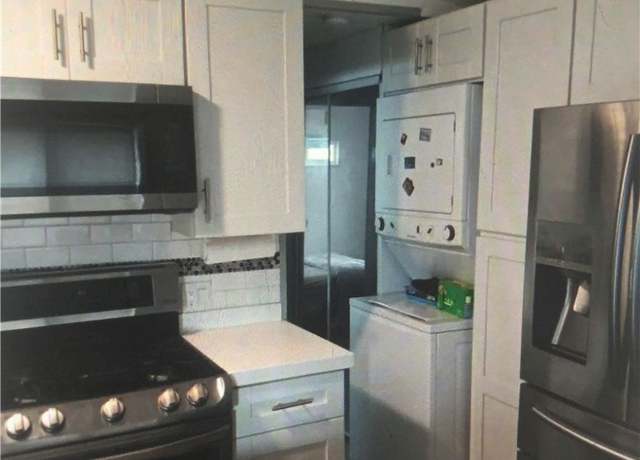
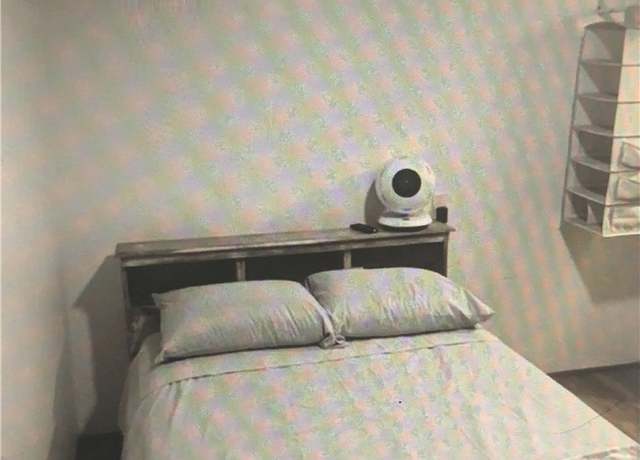
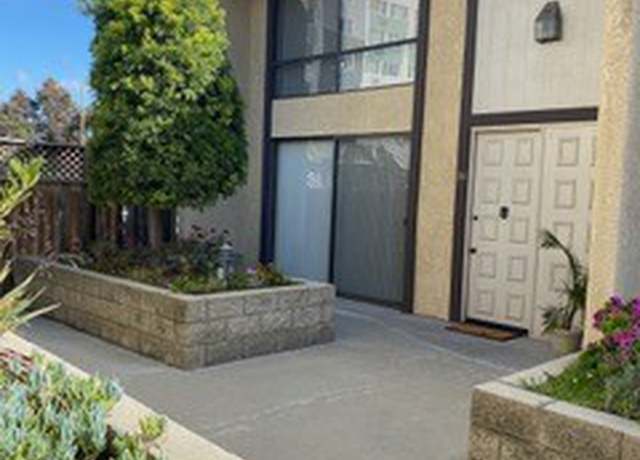
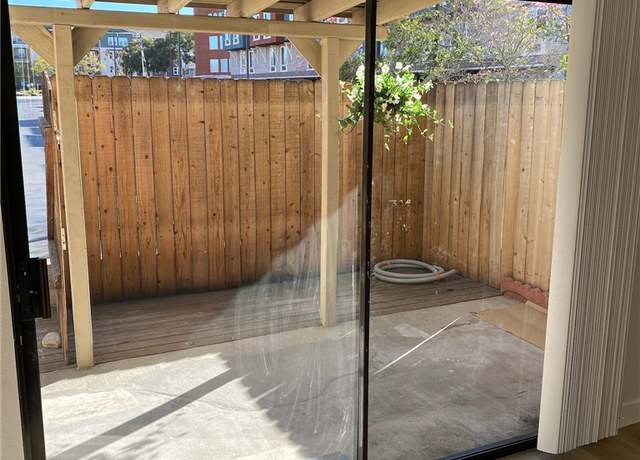
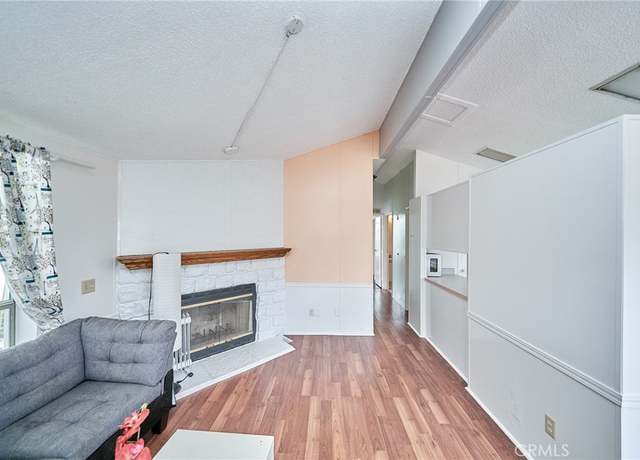
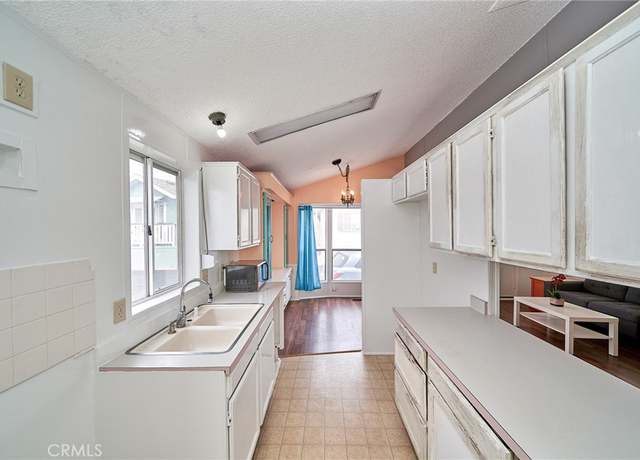
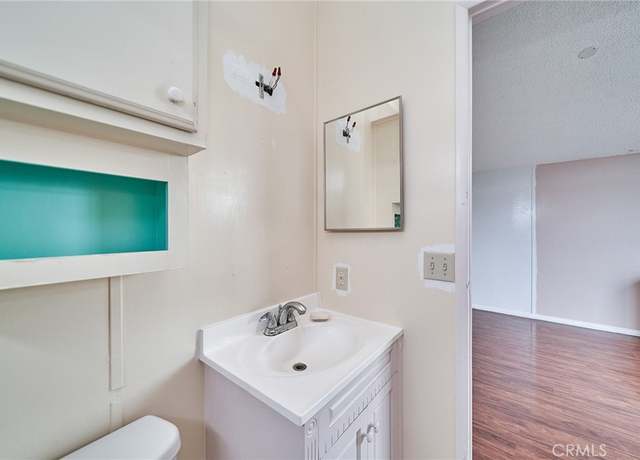
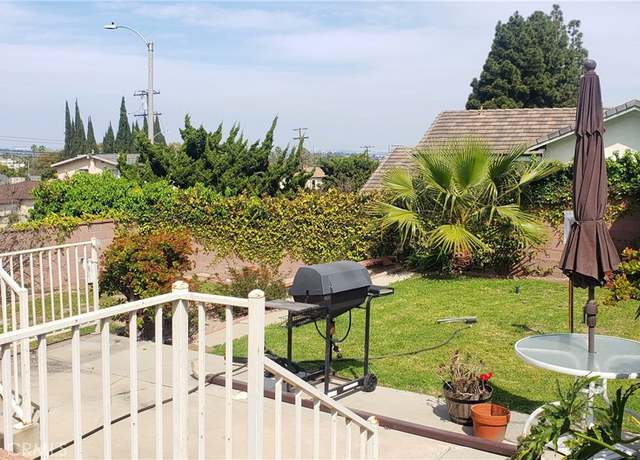
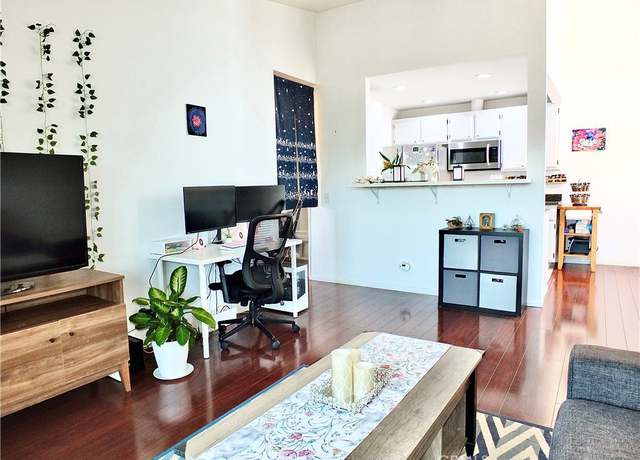
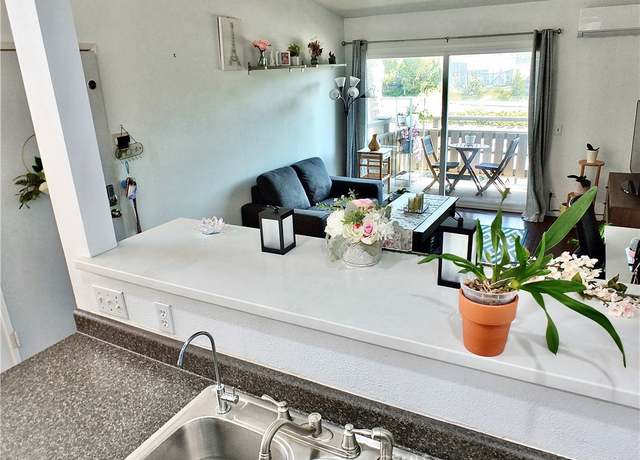
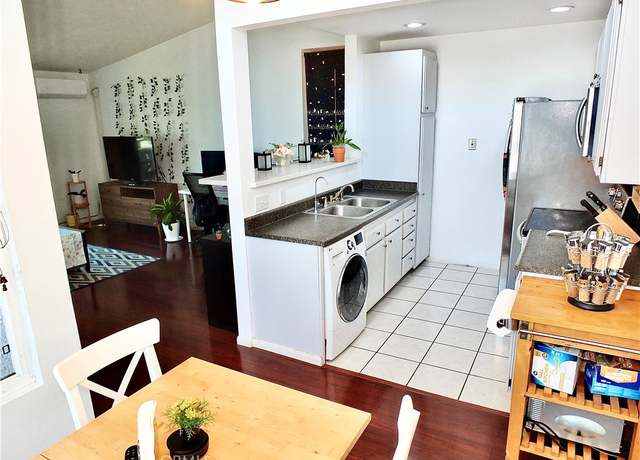
Priced to sell, fully furnished, with two parking spots, community pool and ready to move into, this cozy and nicely laid out home in a family park in North Torrance, is the perfect starter upper home for a couple just starting out or a single person. It is conveniently located on Artesia just a block west of Western on the borderline of Torrance and Gardena very near to Yorgos, Gardena Shopping Center Albertsons, In-And-Out Burgers, Chipotle, Papa Johns, Panda Express, Jersey Mikes, etc. Please , call to make an appointment, hablo Espanol, can help you to get financed
PRICED TO SELL!! Corner End unit, Perfect remodeled spacious 2 Master bedrooms, 3 bath, walk-in closets, high ceilings, laundry room, private balcony an end unit townhouse with 2 detached parking garage and Six6 Guest parking including storage in south/west Torrance with sparkling pool and hot tub. Large living and dining room open to remodeled kitchen with Quartzite countertop. Hardwood floor vinyl all over the house, recessed lights and fireplace. This is an End unit with only one shared wall, very quiet townhome. AC and central heating. Two assigned parking spaces and a nice sized storage unit. Walking distance to Del Amo Fashion center mall and plenty of restaurants and shopping around.
Charming Cul-de-Sac Retreat in Torrance! Discover the perfect blend of comfort and convenience in this beautifully remodeled single-level home, nestled in a peaceful cul-de-sac. With 3 bedrooms, 2 bathrooms, and a cozy fenced backyard, this property is an ideal sanctuary for relaxation and entertainment. From the moment you step inside, you’ll be greeted by a fresh and modern ambiance, featuring new luxury vinyl plank flooring and vibrant interior/exterior paint. The kitchen is a culinary delight, equipped with stainless steel appliances, a dishwasher, a stylish basin sink with a gooseneck faucet, and sleek shaker cabinets with quartz countertops. Additional features include inte
Stylish Torrance Haven – Remodeled & Spacious! Welcome to your dream home in Torrance! This single-level stunner modern charmer updated and features four bedrooms, 2 bathrooms, and a vast fenced backyard perfect for gatherings or tranquil evenings. Enjoy the convenience of a detached two-car garage plus additional RV parking, catering to all your storage and hobby needs or perhaps an ADU. Step inside to discover a fresh and modern living space with new luxury vinyl plank flooring and vibrant interior/exterior paint. The heart of the home is the kitchen, equipped with stainless steel appliances, a sleek dishwasher, a basin sink with a gooseneck faucet, and beautiful shaker c
Welcome to an architectural delight where custom design meets modern tastes. This home, now available for sale for the first time in 34 years, has been cherished and meticulously cared for. Its incredible curb appeal will immediately capture your attention and enchant you with its charm. Upon entering, you'll be greeted by an open floor plan, vaulted ceilings, recessed lighting, and hardwood flooring throughout. The three bedrooms and two bathrooms downstairs provide comfortable living space. As you ascend the stairs, you'll discover an inviting family room with a fireplace, adjacent to a separate office, den, or library. An additional eating area and kitchenette await, all overlooking a sp
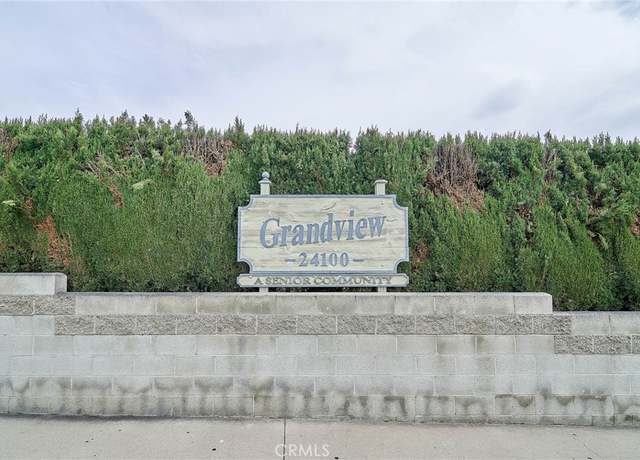
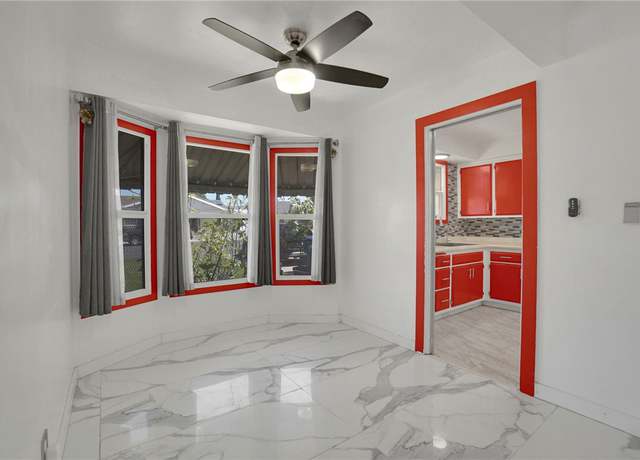
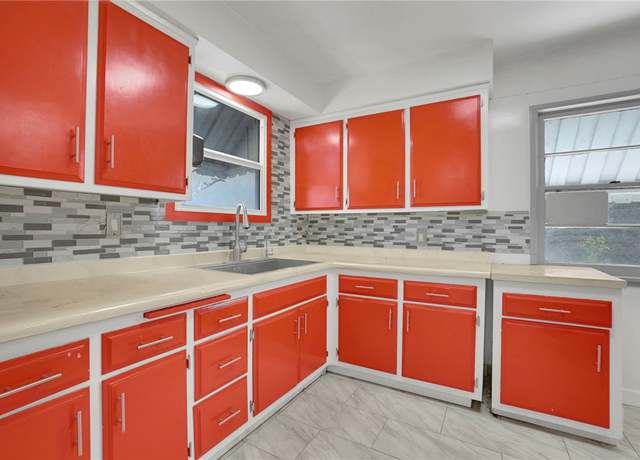
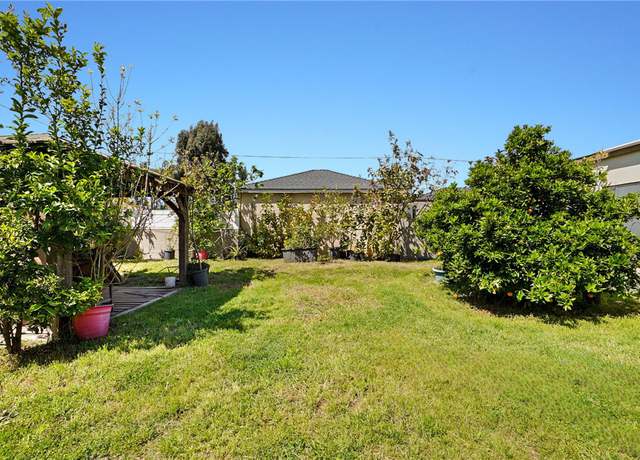
No Land Fee! Welcome to Grandview Mobile Home Park, a premier Resident Land Owned senior community where you can enjoy the perks of homeownership without the hassle of ground rent. This charming single-family manufactured home comes with the added benefit of owning your own land, eliminating any monthly land fees. Each homeowner holds ownership of their unit as well as a 1/40th interest in the underlying land. Managed by the Homeowners Association, Grandview MHP community ensures a well-maintained environment for all residents. For a monthly due of $185.00, inclusive of trash, water, and common area upkeep. Unit #103 boasts a prime location within the park, featuring 2 bedrooms, 2 bathroom
Welcome to the epitome of potential nestled within a vibrant community! This charming 1,156 square foot residence, situated on a sprawling 7,502 square foot lot, beckons with endless possibilities for expansion and transformation. With a prime location ripe for additions or the creation of an ADU (Accessory Dwelling Unit), this is a rare opportunity to craft the home of your dreams in a coveted neighborhood. Originally boasting 2 bedrooms and 1 bathroom, this home has been thoughtfully enhanced with an enclosed patio extension, significantly amplifying its livable space and versatility. With a generous 150-foot lot depth, the canvas for customization is vast, offering ample room to continue
Located in the desirable Victoria Knolls neighborhood and the award winning Torrance School District, this 3 bedroom 2 bath home has been lovingly cared for throughout the years. This is the perfect blank slate for you to make your own. The large 7000+ sqft lot with a view of the city lights will spur your ideas for a backyard sanctuary. You will be in close proximity to dining, shopping, and entertainment options. Come take a look, your next home is waiting for you!
Welcome to your new home in the charming Ponderosa Pines community! This tastefully upgraded upper level condo offers a delightful living experience from the moment you step inside. As you enter, you'll be greeted by vaulted ceilings that create an airy and expansive atmosphere, seamlessly connecting the living room, kitchen, and dining area. The kitchen boasts modern appliances and includes a convenient European style washer/dryer combo, making laundry day a breeze. Natural light floods the rooms through the double pane windows, creating a warm and inviting ambiance throughout. The generously sized bedroom features a large walk-in closet, providing ample storage space for all your needs. S
Imagine living on a street where its residents clearly care about each other and their homes with full hearts. Mansel Avenue is one of those streets—and now is your chance to be part of the community! Within the almost 1400-square-foot floorplan of this West Torrance home, you’ll find many updates throughout the gathering spaces, 3 bedrooms, and 2 freshened bathrooms. As you step through the inviting entry area, you’ll find a good-sized living room that naturally leads into the bright, remodeled galley-style kitchen. Updated with well-thought-out cabinets, trending countertops, a lovely breakfast nook surrounded by large windows, and a dedicated dining space, the kitchen o
Charming duplex in Historic Torrance. 2 beds and 1 bath in the main house + 2 beds and 1 bed in the back ADU with a 2 car-garage! Dream property that will be delivered vacant. Ready for investor or end user with loads of upside! Fix-up and flip-it or keep it and live in one house and rent out the other! Two houses on one lot! Calling all investors!! This is a bargain! Perfect for an end-user who wants sweat equity! Opportunities like this are hard to find!
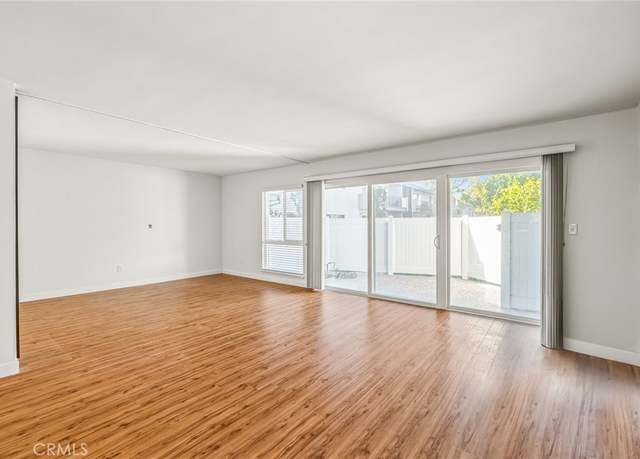
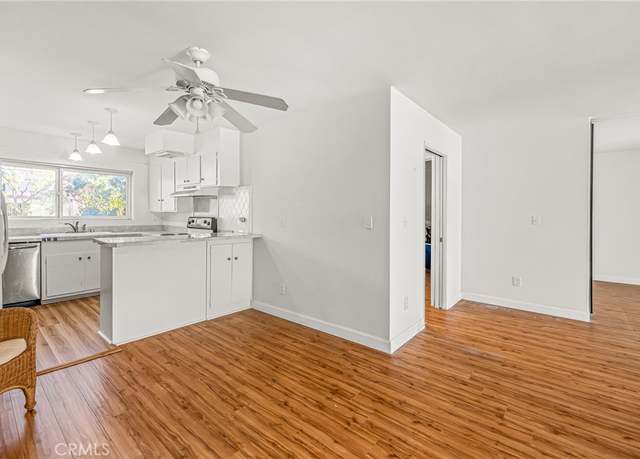
Welcome to this inviting first floor condo, where understated elegance meets versatile living. Inside you will discover a bright and spacious layout filled with an abundance of natural light that highlights the neutral finishes and airy atmosphere. Adorned with blonde laminate flooring and crisp white walls, the spacious layout creates a clean canvas for your personal touches. Indulge in the flexibility of the space, featuring a versatile area complete with a closet, ideal for transforming into a second bedroom or a private office. The dining area, cooled by a ceiling fan, effortlessly flows into the kitchen via a convenient breakfast bar, offering a perfect spot for casual dining while enj
Spacious 3bd / 2bth double wide manufactured home, built in 2007, the home offers an open floor plan living room, with an upgraded kitchen & island, lots of natural lighting. Recently upgraded kitchen with quartz countertops, custom cabinets, cathedral ceilings with skylight in kitchen, hardwood floors in living room area. The bedrooms are split on opposite ends of the home, with the master bedroom hosting its own full bathroom, also included are 2 space covered parking, separate laundry room with dual entries to the home. The park offers a calm & quiet living, with several amenities; pool, security, guest parking, pet-friendly, with a large park only walking distance from home
3 Bed New Home, 3.5 Bath, 3 large bedrooms, each having walk in closets and private bathroom. Fireplace in Living Room, extra cabinet, private laundry room. Beautiful Waterproof vinyl Plank Flooring, Master Bath has Roma tub and Marble shower and wall, Walk in shower. Dining Room, and Kitchen Island, Central air conditioning, French door Refrigerator included, Convection microwave, 2 car garage and high garage door, Convenient electric car charger. Easy access to large patio /yard.
Pull up out in front of this gorgeous home and you can feel how the proud new owner will - Sharp remodeled with curb appeal 3 bedroom 2 bath (1+3/4) both remodel home in move-in-condition on a corner lot - Step inside and you immediately notice all the light and the open floorplan - great remodeled kitchen with lots of white cabinets, apron farm sink, Viking oven and range - recessed lighting, quartz counters, microwave, wood floors and more for the chef- super kitchen is completely open to the dining area (with a chandelier) and the living room - comfortable living room with high ceilings, wood floors, recessed lighting, brick fireplace with a gas starter - both bathrooms are remolded
Welcome to this incredible triplex in the city of Torrance! This property features a 10,800 sqft lot and three units! The front house has three bedrooms and two bathrooms with a large kitchen and dining area, a spacious living room and a primary suite. The middle unit is a studio with a kitchen and bathroom with shower. The back house is two bedrooms and 1.5 bathrooms, the primary suite has a walk-in closet and attached half bath and is complete with its own private backyard space. Each unit has an assigned private garage and plenty of driveway parking. Located in the heart of the Southbay close to freeways, dining, shopping and LA, you won't want to miss this opportunity!
Beautifully updated home combining architectural charm with modern and classic interior scheme. This property offers the best of living in Old Torrance in tranquil surroundings on a picturesque street. With its small community feel and close proximity to top-rated Torrance schools, Old Torrance boasts beautifully designed Craftsman and vintage homes reminiscent of yesteryear. Walk to its historic downtown featuring a multitude of local merchants including a farmer's market, antique stores, eclectic restaurants and a community favorite Torrance Bakery. This lovely Craftsman house is a thoughtfully designed 2 bedroom, 1 bath featuring open-concept living style with warmth, natural light and c
Welcome to Brisas Del Prado. Located in the heart of old Torrance this unit is truly walkable with great access to local restaurants, bakeries, coffee shops and neighborhood wine bar. This top-floor unit has great city views and is the most sought after location within the complex. Step inside and be greeted by a well-designed open floor plan which includes freshly refinished Brazilian cherry wood floors and new interior paint. This unit receives wonderful natural light from the huge living room windows and sliding glass doors. The amenities in this complex are truly impressive, featuring a gym, common outdoor space, pool and spa and multiple restaurants and shops right outside of the compl
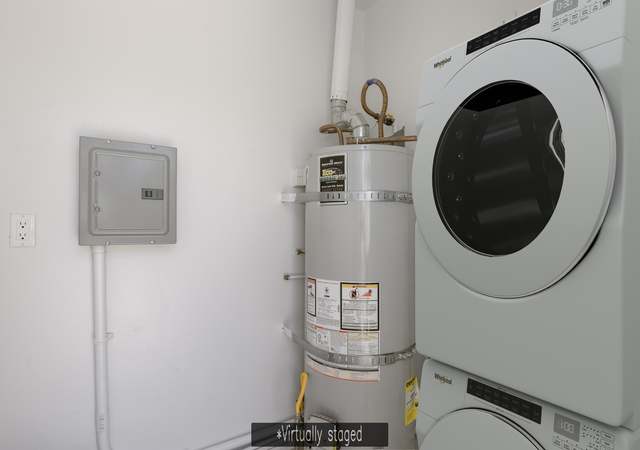
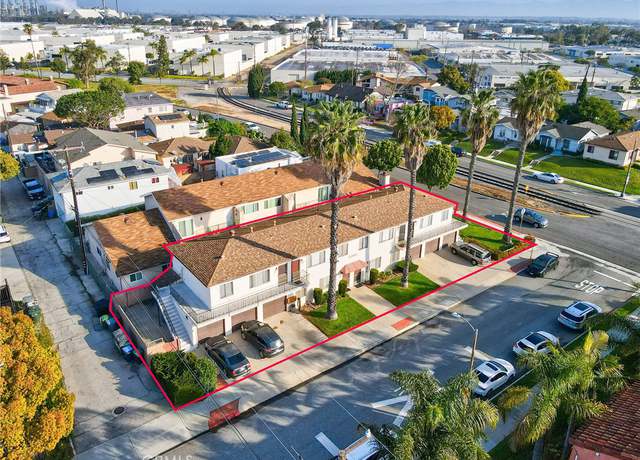
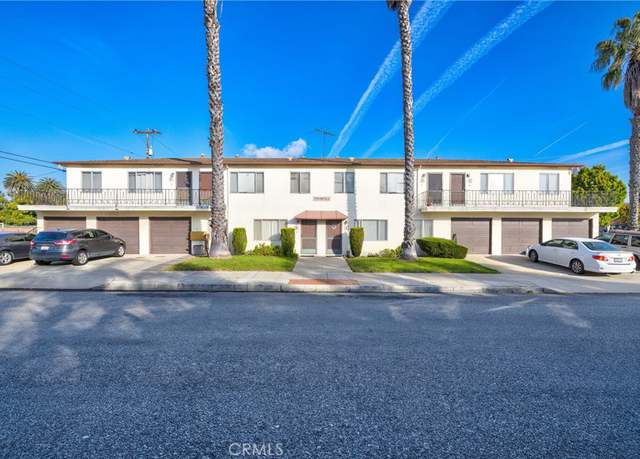
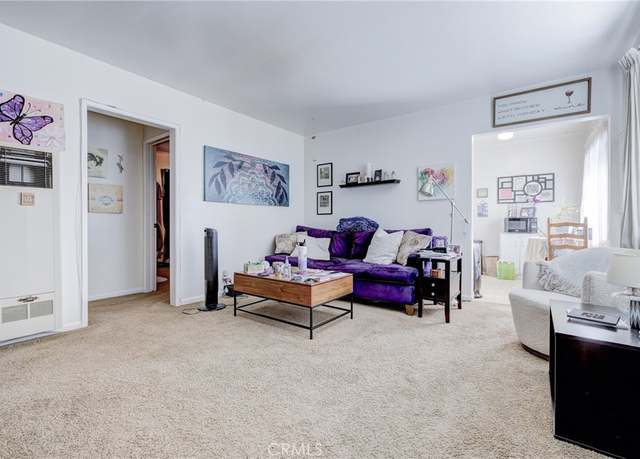
775 Portola Ave is an amazing opportunity to own six units offered at only $282k/unit. The subject property has over 50% upside in rental income. Whether you are long term or a value-add investor, the subject property is the perfect assets to help achieve your investment goals. 775 Portola Ave features a unit mix of (6) 1-Bed/1-Bath - each unit features 2 parking space (1 garage and 1 tandem), as well as washer/dyer hookups. Once fully rented for market and ADU is constructed ($300k), the property will operate at a 8.61% CAP and 7.64 GRM. This investment is located near Old Torrance- one of the more desirable pockets in Torrance. There are many shops and restaurants close by, as
This area's enrollment policy is not based solely on geography. Please check the school district website for more information.
Elementary schools
Middle schools
High schools
GreatSchools Summary Rating
10/10
Hermosa View Elementary School
Public, K-3
10/10
Walteria Elementary School
Public, K-5
9/10
Anza Elementary School
Public, K-5
9/10
Madison Elementary School
Public, K-5
9/10
Meadows Avenue Elementary School
Public, K-5
Only showing 5 of
38 elementary schools.
School data is provided by GreatSchools, a nonprofit organization. Redfin recommends buyers and renters use GreatSchools information and ratings as a first step, and conduct their own investigation to determine their desired schools or school districts, including by contacting and visiting the schools themselves.Redfin does not endorse or guarantee this information. School service boundaries are intended to be used as a reference only; they may change and are not guaranteed to be accurate. To verify school enrollment eligibility, contact the school district directly.
Torrance, California offers a variety of transportation options, including a well-structured public transportation system. The city is served by Torrance Transit, providing residents with bus services to local and regional destinations. For those who prefer driving, traffic levels can be high during peak hours, particularly in the downtown area. Additionally, Torrance is conveniently located near several major highways and freeways, including the I-405 and I-110, making car travel to surrounding areas straightforward and efficient. Learn more on our Torrance city guide.
What types of properties are available in Torrance?
Torrance, California offers a variety of single-family home types, including ranch-style, contemporary, and modern designs, with options ranging from 2 to 5 bedrooms and built in various years. These homes can be found throughout Torrance, with neighborhoods like Southwood, Walteria, and Hollywood Riviera offering a diverse selection of properties. To explore different property types for sale in Torrance, California, use the 'Home type' filter located above the active listings. Customize your search by selecting options like single-family homes, condos, townhomes, and more.
What is life like in Torrance?
Torrance, California offers a pleasant living experience with its diverse community and vibrant atmosphere. The city boasts a picturesque landscape, characterized by stunning beaches and lush green spaces. The weather in Torrance is typically mild, with warm summers and cool winters, perfect for outdoor activities. Job opportunities are abundant in various industries, including technology, healthcare, and manufacturing, providing a strong economic foundation. Residents can enjoy a wide range of recreational activities, such as hiking, biking, and exploring local parks, ensuring there's always something exciting to do.
What are the schools and amenities like in Torrance?
Torrance, California offers an array of public amenities to enhance the lifestyle of its residents. The city boasts numerous restaurants, serving a wide variety of cuisines to cater to diverse culinary preferences. In addition, numerous parks provide spaces for relaxation, recreation, and enjoyment of the outdoors. For daily necessities, there are several grocery stores throughout the city, making shopping convenient. Furthermore, Torrance is home to other amenities like fitness centers, libraries, and shopping centers, ensuring a comfortable and enjoyable living experience.
In the past month, 89 homes have been sold in Torrance. In addition to houses in Torrance, there were also 27 condos, 37 townhouses, and 7 multi-family units for sale in Torrance last month. Torrance is a moderately walkable city in Los Angeles County with a Walk Score of 67. Torrance is home to approximately 145,414 people and 98,491 jobs. Find your dream home in Torrance using the tools above. Use filters to narrow your search by price, square feet, beds, and baths to find homes that fit your criteria. Our top-rated real estate agents in Torrance are local experts and are ready to answer your questions about properties, neighborhoods, schools, and the newest listings for sale in Torrance. Our Torrance real estate stats and trends will give you more information about home buying and selling trends in Torrance. If you're looking to sell your home in the Torrance area, our listing agents can help you get the best price. Redfin is redefining real estate and the home buying process in Torrance with industry-leading technology, full-service agents, and lower fees that provide a better value for Redfin buyers and sellers.


 REDFIN IS COMMITTED TO AND ABIDES BY THE FAIR HOUSING ACT AND EQUAL OPPORTUNITY ACT. READ REDFIN'S FAIR HOUSING POLICY AND THE NEW YORK STATE FAIR HOUSING NOTICE.
 United States
 Canada