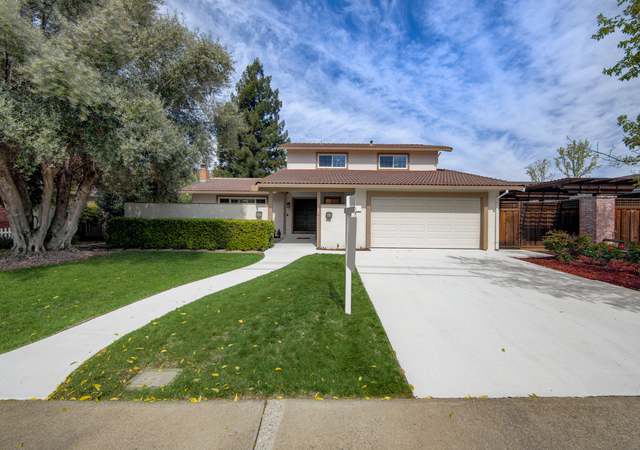
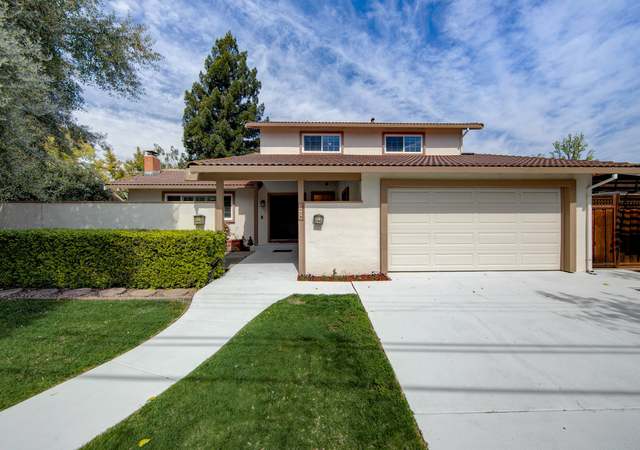
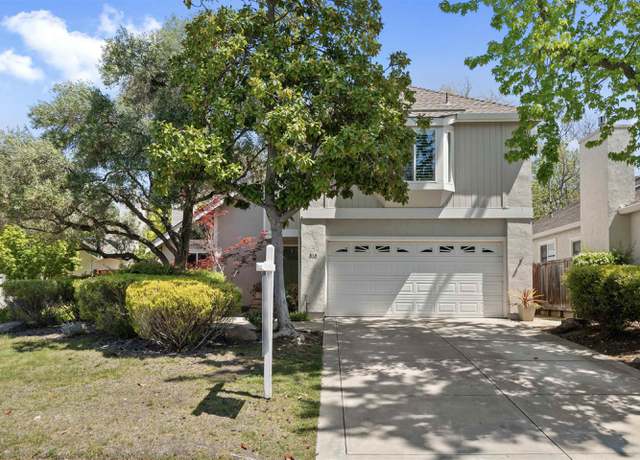
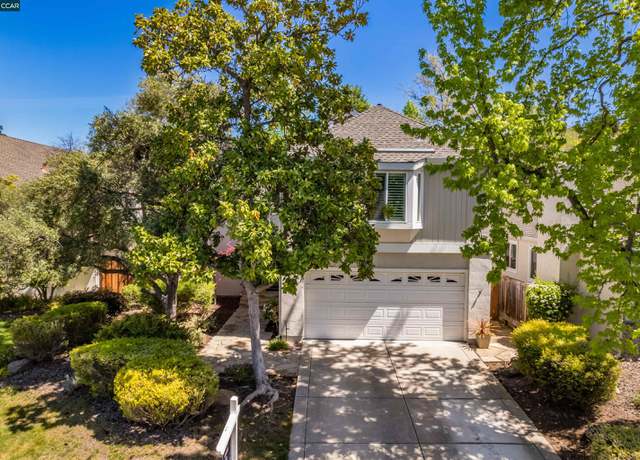
Don't miss this wonderful Walnut Creek home close to Lime Ridge and canal trails. This Beautiful two story home features a great floor plan with a full bedroom and full bath downstairs. Updated kitchen, newer furnace and air conditioner, beautiful hardwood floors. Views of Mt Diablo and the rolling hills from the upstairs bedrooms. No rear neighbors. Private back yard with large deck and lawn area with fruit trees. Close to shopping and top Northgate Schools. The home is freshly painted and ready for you to move in and make it your own.
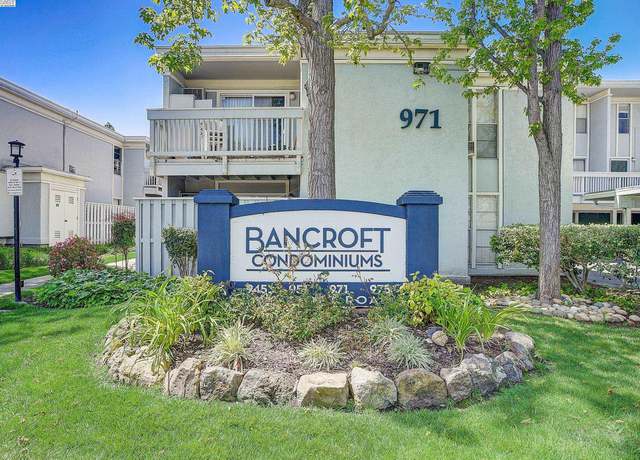
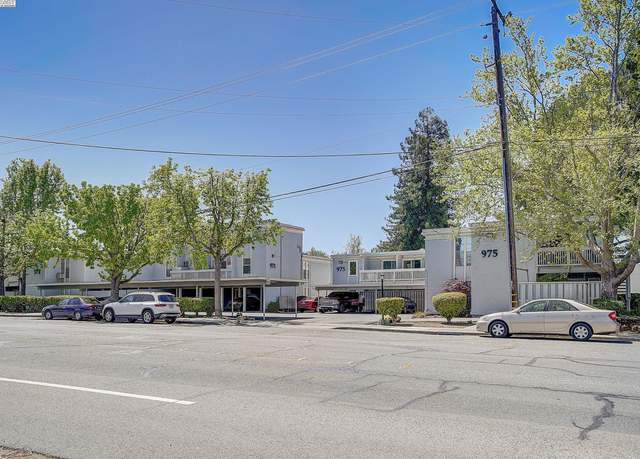
Cozy ground level unit with patio, in a centrally located condominium complex, this one-bedroom, one-bathroom abode exudes warmth and modernity. Stepping through the no-step threshold, you're greeted by the inviting new paint that coats the walls in a soothing palette, creating an airy ambiance that complements the new carpet. The open floor plan brings the living, dining, and kitchen areas together with brand new modern light fixtures. Brand new range and vent with a pop of green on accent wall and cabinets brings a twist of fun. The bedroom is spacious with a wall of closet, and windows that brings in natural light. Two hall closets and patio cabinet for extra storage. Conveniently locate
Immaculate custom contemporary, this gorgeous home sits comfortably on a beautifully landscaped quiet street. Approximately 2787 sq. ft. , with 4 bedrooms, and 2.5 baths. A high ceiling living room, formal dining room, spacious family room, laundry room and kitchen looking out to a beautiful back patio. A two-level home built in 1979, thoughtfully updated, with gorgeous hardwood floors, recessed lighting, vaulted ceilings and marble tile bathrooms. The spacious primary en-suite bedroom with a sitting area is complemented by a bathroom that features a soaking tub, walk in shower, stone counter, warm floor w/ tile accents & walk-in closet. Front yard exterior maintenance is also include
Amazing Livorna Estates home. The Grand interior entry leads you to the formal Living and Dining Room areas. Living Room has built-in cabinetry. The dining room also has a wet bar area complete with liquor cabinet, a wine refrigerators. The Kitchen has solid counter tops, high-end appliances, formal eating area as well as a breakfast bar. You have direct access to the beautiful back yard and saltwater pool from both the dining room and primary bedroom. Nice family room with tile flooring. Primary suite is quite large and has good natural light. Two additional bedrooms, one set up as an office with a built-in desk and bookshelf area. The 1300 square lot brings you a huge park-like backyard w
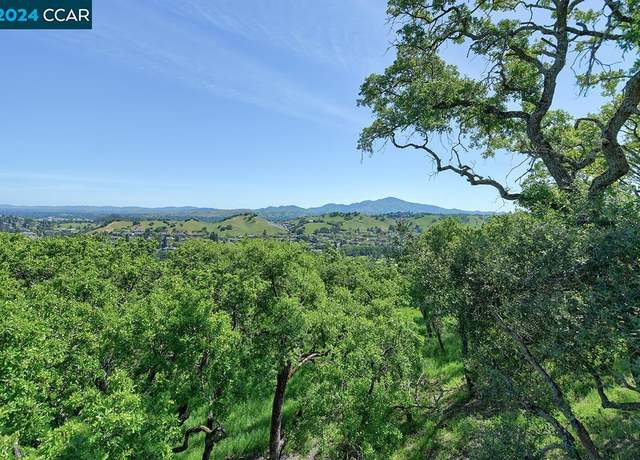
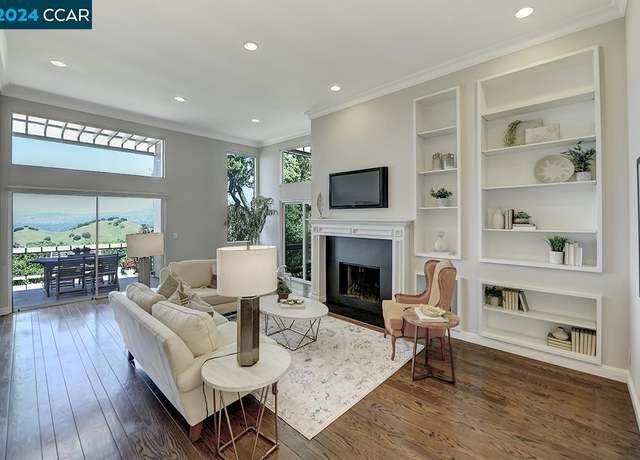
Rarely available Villa Cerro model nestled in the coveted Stanley Dollar Hills neighborhood with one of the MOST SPECTACULAR views Rossmoor has to offer! The 180-degree view allows you to see for miles complementing your everyday way of living, which brings more joy than you can imagine. This Notable home has a versatile living space specifically designed to showcase the ultimate California lifestyle seamlessly combining indoor & outdoor living with refined lines & soaring ceilings that offer the open concept influence retaining a warm & inviting ambiance. The unique features this home offers is endless. .. .culinary minded kitchen that has been beautifully remodeled with
1/60
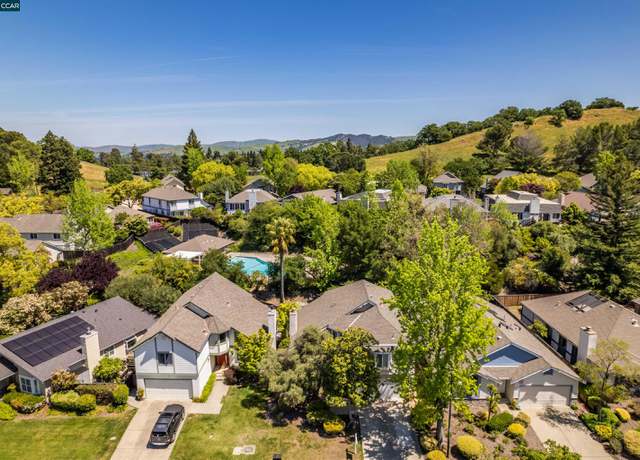
$1,250,000
2 beds2 baths1,574 sq ft
1752 Stanley Dollar Dr Unit 1B, Walnut Creek, CA 94595
Elegant and ideally located condo in The Waterford at Rossmoor. This top floor view home offers a spacious, unencumbered 55+ lifestyle. Rare Huntington model in the south building with beautiful natural light from the kitchen to the bedrooms to the great room and outdoor balcony, this Waterford model is refined with granite counter tops, plantation shutters and custom built in cabinetry. Close, easy access to elevators, dining, storage and carport parking. This residence flows perfectly from the entry into the great room’s living space, library/media corner, balcony and dining area with adjoining kitchen. The primary suite is spacious throughout while the hall bed/study and full bath
Nestled between Downtown Lafayette & Walnut Creek, 260 King Drive offers a Tahoe-like retreat w/ breathtaking views & a prime location w/ easy access to hwys 24 & 680 making commuting a breeze. Enjoy the proximity to top-rated Lafayette schools ensuring quality education for all ages. For outdoor enthusiasts, the Lafayette Moraga trail is just moments away, perfect for hiking, biking, or leisurely strolls amidst nature's beauty. This stunning, custom property features a rental-ready in-law unit for additional income. With a 6-car garage, RV parking, a flat, usable driveway & income potential, this home offers both convenience & opportunity. Inside, you'll find
Upon entering this rarely available single story townhouse in Rancho Dorado, you'll immediately notice the vaulted ceilings in the living area, allowing for abundant natural light, along with a central wood burning fireplace with gas starter. A formal dining area is adjacent to the living room, as is a private rear patio. The kitchen has been recently re-done with new shaker style cabinetry, LED lighting, quartz countertops, and new GE appliances including a gas range. Enjoy the abundant counter space and pantry cabinet, as well as a convenient breakfast nook overlooking the rear patio. Along the other side of the home, an oversized primary suite awaits you, including a
Complete remodel with modern updates & on-trend design. Step inside to discover white & more white, creating a bright & airy ambiance. The interior showcases the feel of NEW with European oak wide-plank hardwood floors, new carpet, designer finishes at every turn, unique light fixtures & chandeliers, all new cabinets & hardware, new interior doors, tall baseboards, gorgeous bathrooms with quartz countertops, marble tile, new fixtures & accessories. Open-concept floor plan perfect for entertaining & everyday living. Chef's kitchen with stainless appliances, beverage fridge, oversized island with ample seating, farmhouse sink with view to the spectacu
Win this fabulous condo for $335,371 and enjoy the quiet side of Walnut Creek. A very suitable end unit with a covered garage and a million doller of amenities to enjoy year-round. This garden view condo has recently remodeled, Granite countertops, Laminated flooring, Breakfast nook, large patio, Crown Molding, Mirrored Closets, and Fresh Paint. Short distance to BART and public transportation, freeway access, church, and Health facilities. Drive about 5 minutes and enjoy the beautiful downtown walkabout with many shops and fine restaurants and more. Relax by the poolside, play tennis, workout in the Gym, socialize in the clubhouse, Walk the trail, & enjoy the life. Call 9258388777 for
Welcome to your dream townhome! This single-story end unit boasts contemporary upgrades and an open floor plan. Step inside to discover new flooring and recessed lighting that illuminate the spacious living area. The freshly painted interior sets a welcoming tone, complemented by a gas fireplace perfect for cozy evenings. The brand-new kitchen dazzles with sleek Quartz countertops and new appliances that open to the dining area. Retreat to the bedrooms adorned with new ceiling fans for added comfort. Renovated bathrooms exude luxury with all contemporary fixtures, countertops, and a new bath and shower. Convenience is key with new blinds, and central air and heat. Outside, a private courtya
This exceptional end unit features two updated bedrooms and two bathrooms with a glorious atrium separating the bedrooms from the living area. New carpet throughout compliments the updated kitchen with a large picture window looking out onto lush landscaping. Enjoy your updated kitchen with stainless steel appliances and quartz countertops, or cozy up to the gas fireplace. The atrium bathes this home in natural light, and much of the living room wall is glass. The spacious primary bedroom features a private walled patio and ensuite. The second bedroom opens onto the atrium. This home is well insulated and has a new roof (one-year old). This development features three pools to choose from, w
Prime downtown Walnut Creek location. Just one block away from WC Library and short walking distance to shopping, restaurants, Broadway Plaza, BART and Iron Horse Trail. Completely updated! Large family room with recessed lights and access to balcony. Updated kitchen with new cabinets, appliances, quartz counter tops and a breakfast bar. In unit laundry with washer and dryer included. Two spacious bedrooms with mirrored closet doors, new carpet, laminate flooring, light fixtures and paint. Completely renovated bathroom. One parking spot and a large storage room. Close to 12 years of top rated Walnut Creek schools. This one is not to be missed!
Location, Location, Location! At the end of Brantford Court tucked into the hills with views of the hillside toward downtown. This home is exceptionally well cared for with improvements throughout. Remodeled eat-in kitchen with solid granite counters, stainless steel appliances and under counter seating. Open views of the hillside from the rear of the home including the kitchen, primary bedroom, dining room and family room. Both upstairs baths are remodeled with high quality materials and workmanship. The primary suite features a sitting area with views, walk-in closets and custom bath. The exterior is extensively landscaped with a fully fenced front courtyard, large, landscaped side yard,
This home has one of the BEST views in all of Rossmoor with wonderful vista view of rolling hills and lush landscape from a large open deck that elevates your everyday living. At dusk you will enjoy the reflective glow from the Western hills and as the sun sets the valley lights will sparkle. Rarely do you find a home that has been beautifully remodeled with distinctive architecture and design using the highest quality finishes starting with custom cabinetry, quartz counter tops, high grade stainless steel appliance, impressive bathrooms, designer carpet, hard surface vinyl flooring, custom blended paint. This home has classic charm as the layout flows effortlessly from one room to the othe
Location, Location!! Walk to Creekside Grill, Golf , Events Center and Gateway. Full size Washer and Dryer. Upgraded engineered hardwood flooring, dual pane slider & window. Ceiling fans, recessed lighting. Extra Rossmoor approved storage in Carport. New dishwasher, fresh paint, visitor parking. Lemon & Orange trees, private setting.
Welcome to this charming one bedroom, one bath unit in one of the best value communities in Walnut Creek! This is true resort-style living, features amazing amenities: three swimming pools with spas, four lighted tennis courts, an impressive clubhouse with a gym, billiard pool, a pond, basketball, racquet ball and a BBQ area! This beautifully remodeled unit has a great floor plan with so much to offer. The spacious living room with a sliding door opens to a large, shared terrace. The open dining room offers big windows. An updated kitchen features an updated quartz countertop and newly installed appliances. Don’t miss the generous bedroom with a walk-in closet, nor the bathroom with a
With the allure of a storybook, this adorable single-story house featuring a vibrant red door sits nestled at the quiet end of Reiner Lane, radiating charm & coziness. Welcomed by high ceilings & an abundance of natural sunlight the main living space is open & bright with an adjacent dining area & kitchen. Modern upgrades include newer flooring, freshly painted interior, ceiling fans & recessed lighting. Kitchen features stainless steel appliances, painted cabinetry in a designer palette & gas cooktop. Beyond the French Doors is a vast back/side patio yard with storage shed. Enveloped by blossoming trees & rose bushes, with a petite grassy patch, th
Nestled in a picturesque enclave just moments from Walnut Creek's vibrant downtown, discover a hidden gem where east coast charm meets west coast comfort in a private setting. The enchanting curb appeal and mature landscape exudes a sense of peace and privacy. Whether you're dreaming of a turn-key retreat or eager to infuse your own personality into every corner, the possibilities are endless. With further enhancements, transform this gem into a true showstopper that reflects your individuality. Step into the newly refreshed kitchen adorned with quartz counters that exude modern elegance. The space has been tastefully updated with fresh paint, new plumbing fixtures, hardware, LED can lighti
Stunning Piedmont condo with spectacular views of Mt. Diablo and the surrounding valley. This wonderful end-unit recently underwent some much-needed upgrades -- quartz countertops, subway tile backsplash, stainless steel appliances, flooring and carpet throughout, bathroom vanities, complete interior paint and removal of popcorn ceilings. This property has an en-suite downstairs that also could function as an office, den, TV room, etc. -- you will love the flexibility it provides. The spacious primary bedroom includes a secluded balcony, and the generously-sized patio is a sanctuary that offers those stunning views. You will love the dual-pane windows and stacked washer/dryer space. And to
NORTHGATE NEW TO MARKET! Fabulous 4 BR / 3 BA on . 25 acre lot with room for pool or ADU! Beautiful Northgate home with first floor office/guest bedroom + full guest bathroom, spacious living/dining rooms, updated kitchen (KitchenAid panel refrigerator, Dacor built-in oven with 6 burner gas cooktop, Zephyr hood, additional Dacor built-in oven with warming drawer, U-Line beverage fridge). Large primary suite with two walk-in closets/Elfa organizers; updated bathrooms and indoor laundry. BACKYARD space to play, dine, entertain and garden + great space to add pool or ADU! Walking distance to Foothill MS and Northgate High School, parks and swim clubs.
Embark on a resort-style living experience in this bright and spacious 1-bedroom, 1-bathroom condo nestled in the sought-after Keys HOA. Enjoy serene views from the 4th-floor balcony, where you can catch glimpses of rare Sierra pines and Mt. Diablo in the distance. With recent updates including fresh paint, new flooring, and a modern kitchen countertop, this welcoming home is move-in ready for you to relish the array of amenities within the community. These amenities boast secure building access, three refreshing swimming pools, a clubhouse, a fitness center, and tennis/basketball courts. Conveniently located near top-rated K-12 schools, parks, the scenic Iron Horse Trail, shopping and dini
No Steps to this single-level Condominium, in a peaceful, lovely setting. This is an end, corner home, with no upstairs neighbors. The enclosed yard, is ideal for dog lovers. The kitchen has white cabinetry, granite counters, and a skylight. Washer and Dryer are in the home and are included. The Yosemite CONDO model is much larger than the Co-op model, boasting a more spacious living room. This condo has most of the features that make Rossmoor such a desirable community to live, so come and see it as soon as you are able!
This Alamo home, located in the SRVUSD, checks all the boxes. If you imagine the perfect home, there is a blend of an idyllic location, spacious layout, modern amenities and a truly one of a kind serene view. This is that home! The neighborhood is a true treasure find and the home sits prominently at the end of a cul-de-sac with a private and secure setting. This 3600+ sq. ft. home features 5-bedrooms and 4 baths, large and open chefs kitchen, together with spacious living and family rooms. The outdoor space is truly spectacular, featuring a Hawkins built salt water pool installed in 2021, complete with baja tanning shelf, 3 waterfalls w/ LED lights and spa with high output heater. Automati
Introducing a charming urban retreat in an unbeatable location! This delightful 1-bedroom, 1-bath residence offers the perfect blend of city living and resort-style amenities. Situated close to downtown and conveniently near two BART stations, commuting and exploring the city has never been easier. Step inside to discover a cozy living environment with an open layout that creates a seamless flow between the living, dining, and kitchen area. But the true allure lies beyond the walls of this inviting abode. Nestled within a vibrant HOA community, residents enjoy a lifestyle akin to that of a luxurious resort. From tennis and racquetball courts to a rejuvenating sauna and well-equipped gym, th
Welcome to your next project home! This fixer-upper is waiting for your personal touch. Situated on a spacious lot, both the front and back yards offer ample room for landscaping dreams to come true. Single-story layout featuring a generously sized living room bathed in natural light, complete with a cozy wood-burning fireplace. The adjacent dining area flows seamlessly, creating an open and inviting atmosphere. The kitchen has a built-in oven, and plenty of cabinet space for storage. The primary bedroom features another wood-burning fireplace for added ambiance and warmth. With three spacious bedrooms and three baths, there's room for everyone to relax and unwind. Speaking of the outdoors,
Nestled amidst the tranquil embrace of nature, this enchanting 2/2 Cascade retreat is set in a private location just steps away from the Rossmoor Trails. This home offers smooth ceilings, updated white eat-in kitchen, large open living area, fresh paint and new carpet. Outside, the natural beauty of the Cascade surroundings provides a picturesque backdrop for outdoor leisure and recreation. Whether savoring a morning cup of coffee on the secluded patio or enjoying a leisurely stroll through the lush greenery, residents will delight in the peace and tranquility that envelops this enchanting property.
Stylishly remodeled 3 bedrooms, 2.5 bathrooms townhouse in highly sought after community Cardigan. Featuring 2,055 sf of living space, the home boasts a stunning remodeled kitchen with new stainless steel appliances, white cabinetry and quartz countertops. Ample natural light fills the home, accentuated by modern recessed lighting. The open floor plan seamlessly connects the kitchen to the family room and enclosed private patio, perfect for entertaining. New luxury vinyl flooring graces the first floor, while plush new carpets adorn the bedrooms. A formal dining room and a breakfast nook provide versatile dining options, while an indoor laundry room with new washer and dryer adds convenienc
Wonderfully updated and elegant 2 Bedroom Condo located in a prime location of Walnut Creek. This sparkling unit is move in ready, with updated paint, appliances, closet doors and more. The bathroom has also been updated with a soaking tub for relaxation. Conveniently located on the 1st floor there is no need for elevator access. Views include the gorgeous fountain and trees to give that sense of peace and tranquility. Boasting 22 acres of lush landscaping, 3 swimming pools that includes the heated main pool. Enjoy the amenities that include a Clubhouse, Tennis Courts, Sauna and Gym. With minutes to downtown Walnut Creek, you can walk or bike to nearby shopping and restaurants, and the Iron
This ground floor unit is the epitome of contemporary living with its exquisite updates and attention to detail. The seamless flow between the living room and kitchen enhances the spaciousness of the layout. The square paneled accent wall in the kitchen adds a touch of sophistication and modern flair. The primary bedroom boasts thoughtful features like closet organizers for optimal storage and a bath with an extra vanity, adding convenience to everyday life. The charming deck is an ideal spot to soak in the spring and summer weather or unwind during quiet evenings at home. Take advantage of the community amenities, including a pool, clubhouse, and gym, enhancing the overall lifestyle experi
Welcome to your forever home with the most stunning panoramic views of Rossmoor in the valley! Enjoy sweeping views of Rossmoor and miles beyond, with majestic Mt. Diablo as the perfect centerpiece and no nearby buildings or rooftops to distract from the scenic landscape. This level-in Santa Clara condo is situated at the end of a small entry and is surrounded by serene landscaping in a rare secluded location. Privacy abounds with only one attached neighbor, no one above or below, and a private walkway in a garden-like setting with no steps to the front door. Step inside and you'll appreciate a desirable open floor plan with the Kitchen, Dining Area and Living Room making a spacious enterta
Open this Sunday 1-4PM! A stunning 1.78 acre property in Lafayette! This spacious 5 bedroom+office, 3 bath home of 3,366 S. F. enjoys a private yet convenient location. Enjoy the peace and serenity with beautiful panoramic views. The living room with peak beam ceilings, fireplace and an abundance of windows that fill the room with light while enjoying calming wooded views. The primary bedroom, which is on the main level has cathedral ceilings, patio door to deck and an oversized full bathroom with gym/office. The downstairs family room and partially finished basement/bonus room offers lots of extra space to enjoy. The backyard is your own private oasis that features a built-in BBQ, refinish
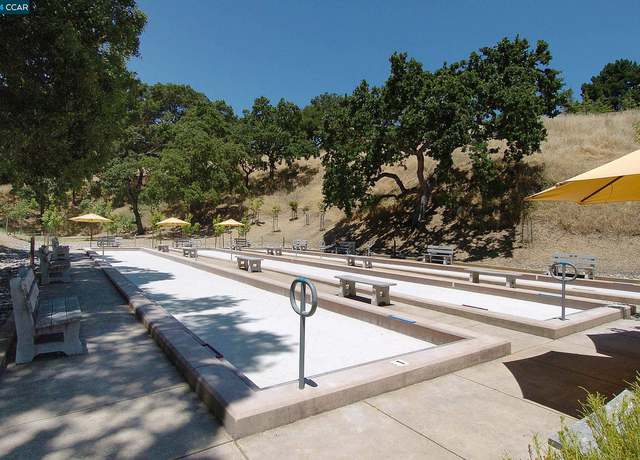
Escape to resort-style living in Rossmoor with approximately 200 clubs and organizations, fitness center, movie theater, golf, swimming, pickleball, bocce ball, hiking trails, hobby rooms, dinners, dancing several clubhouses, and more. The Saratoga end unit features a 2-bed 2-bath original layout, with a spacious enclosed balcony offering nearly 300 sq. ft. of additional space for entertaining, hobbies, office use . .. you name it. Updated kitchen, smooth ceilings, double pane windows in bedrooms, and decorative outlet/light-switch covers. Indulge in the luxury of a primary suite with a dressing area. Parking is straight across from the unit in covered carport 1410-1 with a convenient stora
Open Saturday and Sunday 1-4pm! Welcome to your dream home in the highly sought-after Village community of Walnut Creek. This beautifully updated home features a fully renovated chef’s kitchen, engineered hardwood floors throughout, abundant natural light, a private landscaped yard and soaring ceilings. Enjoy effortless entertaining and easy everyday living with the seamless flow between the living, dining and kitchen areas. The stunning kitchen features ample counter space made of gorgeous Calcutta and quartz, stainless steel appliances, a gas cooktop, an expanded pantry and so much more. You’ll love the light-filled living room boasting floor-to-ceiling windows and French door
Welcome to this lovely, updated Sonoma home, perfectly blending indoor and outdoor living! The full wrap-around veranda offers phenomenal outdoor space, perfect for relaxing, entertaining, or enjoying a morning coffee. Inside, the open floor plan features spacious living and dining rooms, seamlessly flowing into a bright, updated kitchen. Enjoy cooking with granite countertops, a gas stove, and white cabinetry, making mealtime a delight. This Rossmoor home boasts: - 2 nice-sized bedrooms with ample closet space - 2 full bathrooms for added convenience - In-unit laundry for easy living - Newer carpeting and laminate flooring in key areas - Carport #1 for easy access and extra storage - Ampl
Light and bright Monterey model with Open Veranda. End unit surrounded by trees and greenery. Across from the Redwood Park. Close to Gateway and the Fitness Center. Furniture include in the Sale. Move-in Ready!
Discover www. 1617SunnyvaleAvenue.com This single family home is nestled on a peaceful lane, this remarkable 3 bedroom, 2.5 bathroom home offers an idyllic retreat while still being just moments away from two BART stations and easy freeway access. Natural light fills the remodeled kitchen that features new cabinets, quartz countertops, and stainless steel appliances. The living room and dining area share a charming fireplace and sliding door leading to the backyard and covered patio. Retreat to the spacious master suite, featuring a walk-in closet and a private updated bath. Main level laundry room, two car garage, and plenty of storage are additional highlights. Close to parks, trails, fre
Step into the timeless charm and modern comfort of this spacious 6-bedroom, 4 full baths and 2 half bath Ranch home in the heart of Walnut Creek. Boasting a convenient attached in-law setup, this updated residence is perfect for multi-generational living or rental income. Upon entering, natural light fills the spacious layout, accentuating the stylishly updated kitchen featuring granite countertops, a massive center island, and high-end stainless-steel appliances. The inviting great room is the ideal space for gatherings, complete with a cozy fireplace. Retreat to the serene primary suite, where a spa-like private bath awaits. Outside, the professionally landscaped backyard offers an oasis
Upper level end unit. No neighbors above. You will be captivated by the inviting living room and spacious dining area with lots of natural sunlight. The entire unit was extensively updated last year! The renovated kitchen offers shaker style cabinets, stainless steel appliances, simple and elegant quartz solid surface countertops. Full size, interior, side by side washer/dryer in closet for convenience. Tasteful and contemporary luxury vinyl plank (LVP) flooring installed entirely creating a seamless and expansive look. Recessed lighting and dual pane windows throughout. The open floor plan allows for a smooth transition from the living room to dining & kitchen area with slider door a
Beautifully updated, light filled home with lovely views from every window. Newer washer and dryer in unit, granite countertops in kitchen. Newer stainless steel appliances, interior paint and carpeting. Resort like community with 2 golf courses, multiple pools, tennis courts, pickle ball courts, boche ball, state of the art gym facilities, fabulous restaurant, campus for many classes, theater, libraries, meeting rooms, too many amenities to list. Priced for fast sale.
This area's enrollment policy is not based solely on geography. Please check the school district website for more information.
Elementary schools
Middle schools
High schools
GreatSchools Summary Rating
9/10
Walnut Acres Elementary School
Public, K-5
9/10
Burton Valley Elementary School
Public, K-5
8/10
Buena Vista Elementary School
Public, K-5
8/10
Walnut Heights Elementary School
Public, K-5
8/10
Valle Verde Elementary School
Public, K-5
Only showing 5 of
18 elementary schools.
School data is provided by GreatSchools, a nonprofit organization. Redfin recommends buyers and renters use GreatSchools information and ratings as a first step, and conduct their own investigation to determine their desired schools or school districts, including by contacting and visiting the schools themselves.Redfin does not endorse or guarantee this information. School service boundaries are intended to be used as a reference only; they may change and are not guaranteed to be accurate. To verify school enrollment eligibility, contact the school district directly.
Walnut Creek, California boasts a well-connected transportation network, making it convenient for residents to commute by car. However, it's worth noting that during peak hours, traffic levels can be high, especially on major routes. Public transportation is readily available, with the Bay Area Rapid Transit (BART) providing service to the region. Additionally, Walnut Creek is conveniently located near major highways and freeways, including Interstate 680 and State Route 24, offering easy access to surrounding areas. Learn more on our Walnut Creek city guide.
What types of properties are available in Walnut Creek?
Walnut Creek, California offers a variety of single-family home types, including ranch-style, contemporary, and modern homes, among others. These homes can be found throughout the city, with some located in established neighborhoods and others in newer developments. Most properties in Walnut Creek feature three to five bedrooms and were built within the past few decades. To explore different property types for sale in Walnut Creek, California, use the 'Home type' filter located above the active listings. Customize your search by selecting options like single-family homes, condos, townhomes, and more.
What is life like in Walnut Creek?
Walnut Creek, California offers a vibrant living experience with its picturesque landscape that seamlessly blends nature and urban elements. The region boasts a pleasant Mediterranean climate, characterized by mild winters and warm summers, making it ideal for outdoor activities and exploration. The area presents a range of job opportunities across various industries, catering to diverse professional interests. Residents can engage in a plethora of recreational activities, such as hiking, biking, and exploring local parks, ensuring an active and fulfilling lifestyle. Additionally, the city hosts a myriad of cultural events and festivals throughout the year, providing ample opportunities for entertainment and community engagement.
What are the schools and amenities like in Walnut Creek?
Walnut Creek, California, boasts a variety of public amenities for its residents. The city is home to a multitude of restaurants, offering a wide range of cuisines to satisfy diverse culinary preferences. Numerous parks provide ample space for outdoor leisure and recreation. For daily needs, several grocery stores are conveniently located throughout the city. Additional amenities include a public library, fitness centers, and a community arts center, ensuring a well-rounded lifestyle for those residing in Walnut Creek.
In the past month, 89 homes have been sold in Walnut Creek. In addition to houses in Walnut Creek, there were also 166 condos, 20 townhouses, and 1 multi-family unit for sale in Walnut Creek last month. Walnut Creek is a minimally walkable city in Contra Costa County with a Walk Score of 41. Walnut Creek is home to approximately 63,807 people and 54,759 jobs. Find your dream home in Walnut Creek using the tools above. Use filters to narrow your search by price, square feet, beds, and baths to find homes that fit your criteria. Our top-rated real estate agents in Walnut Creek are local experts and are ready to answer your questions about properties, neighborhoods, schools, and the newest listings for sale in Walnut Creek. Our Walnut Creek real estate stats and trends will give you more information about home buying and selling trends in Walnut Creek. If you're looking to sell your home in the Walnut Creek area, our listing agents can help you get the best price. Redfin is redefining real estate and the home buying process in Walnut Creek with industry-leading technology, full-service agents, and lower fees that provide a better value for Redfin buyers and sellers.


 REDFIN IS COMMITTED TO AND ABIDES BY THE FAIR HOUSING ACT AND EQUAL OPPORTUNITY ACT. READ REDFIN'S FAIR HOUSING POLICY AND THE NEW YORK STATE FAIR HOUSING NOTICE.
 United States
 Canada