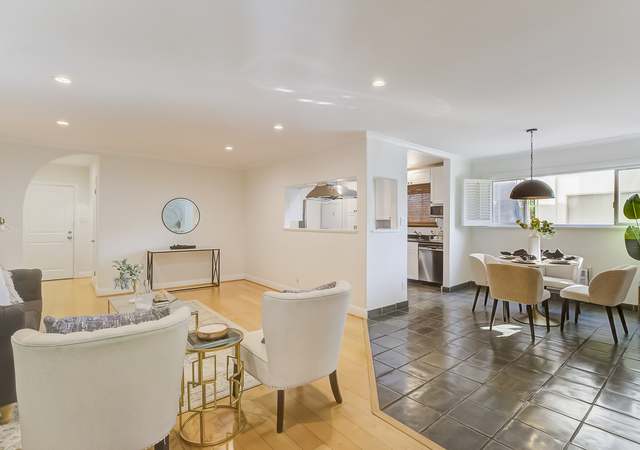
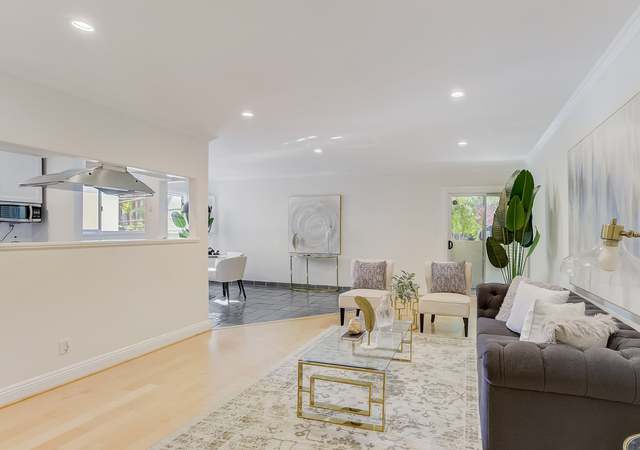
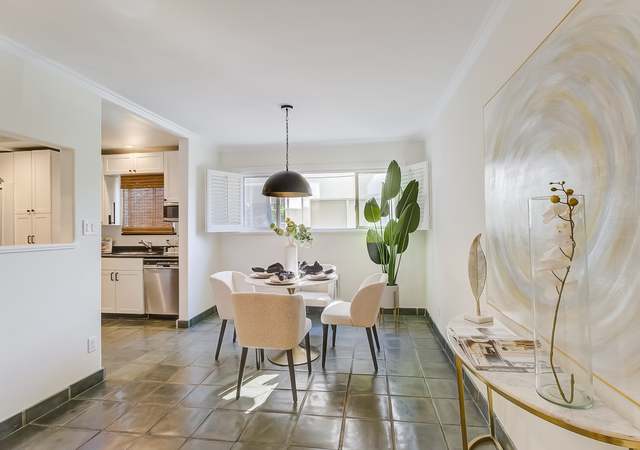
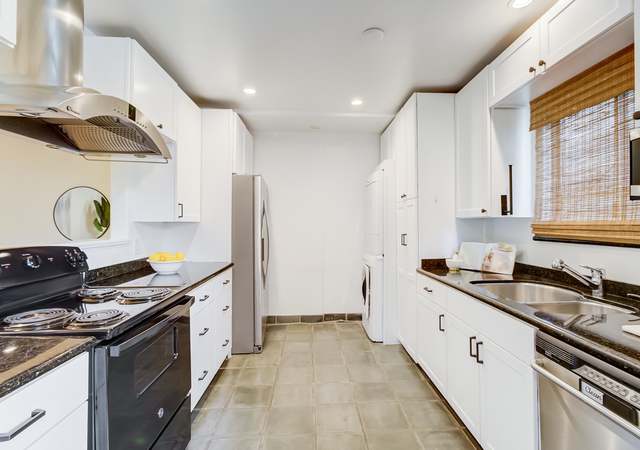
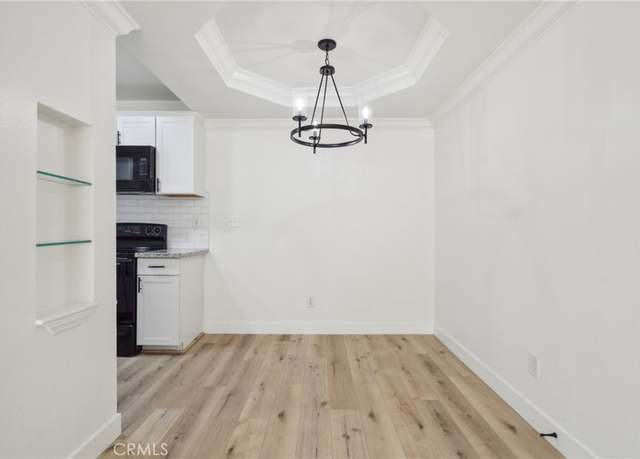
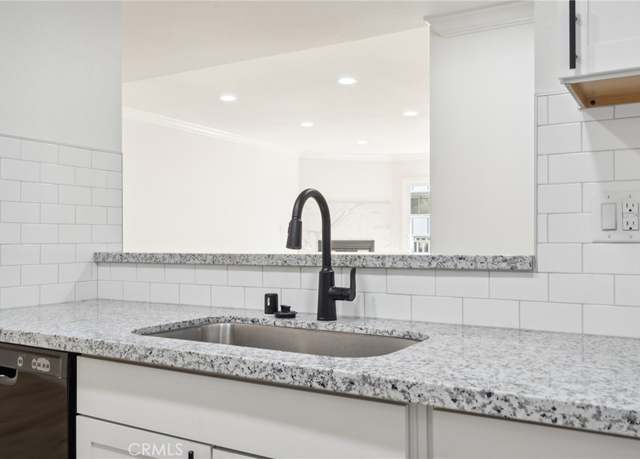
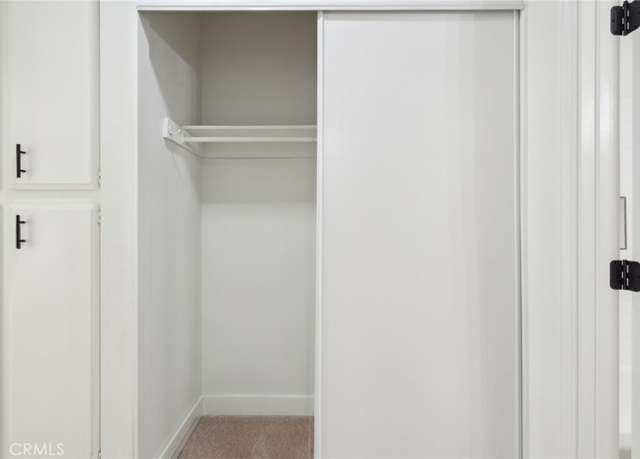
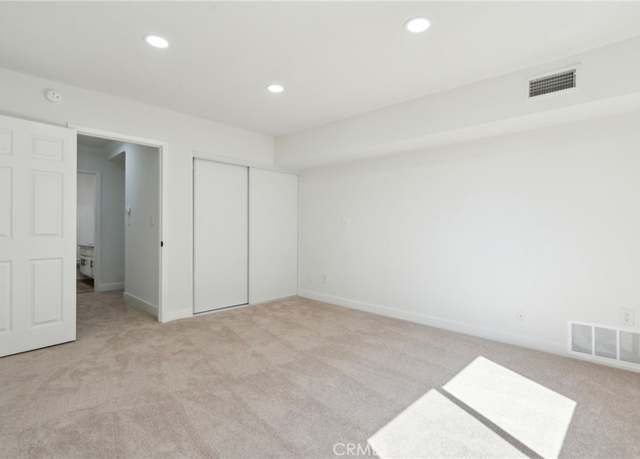
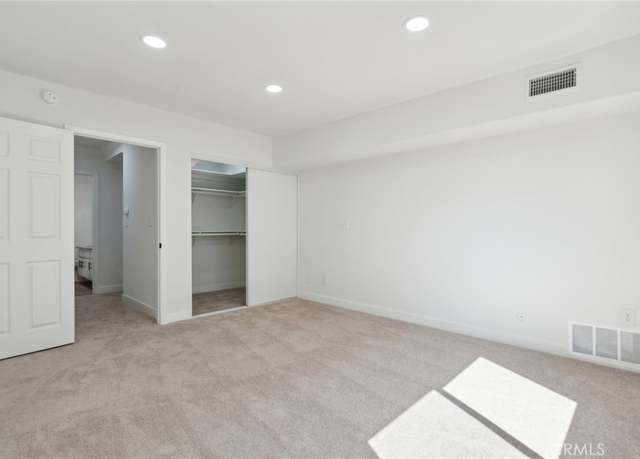
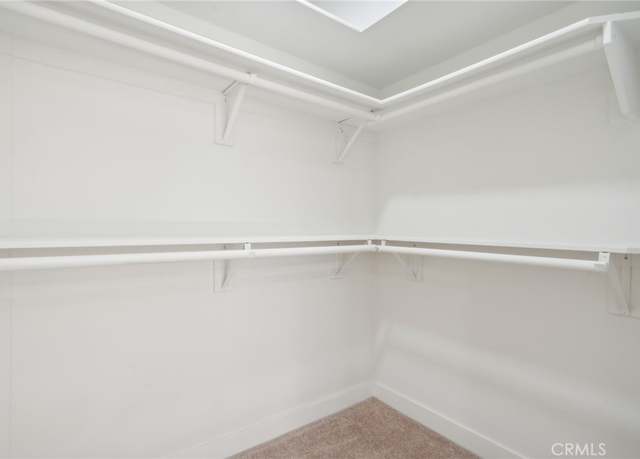
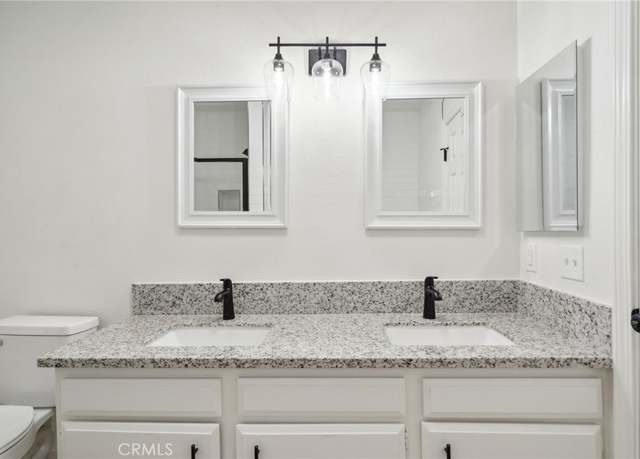
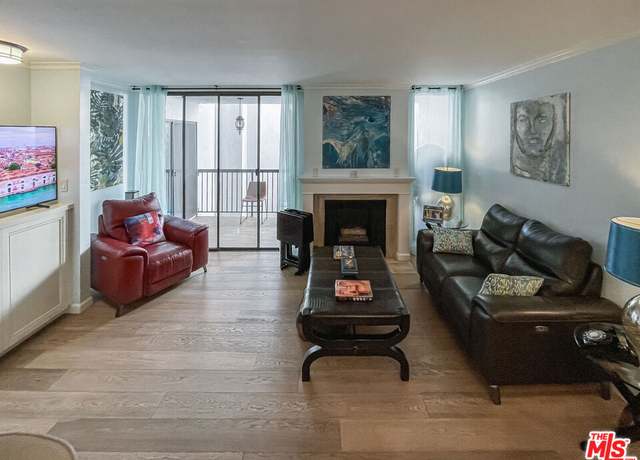
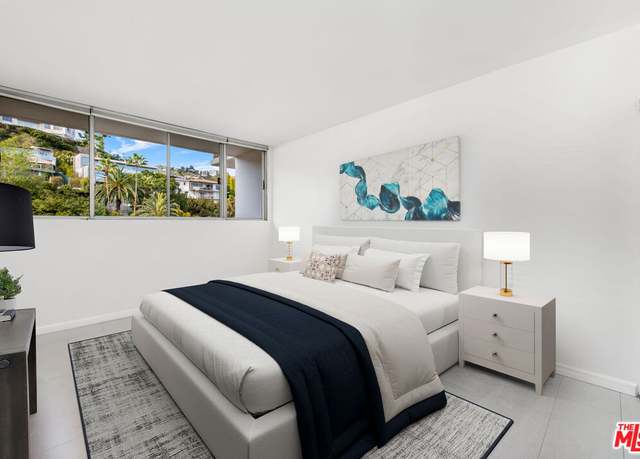
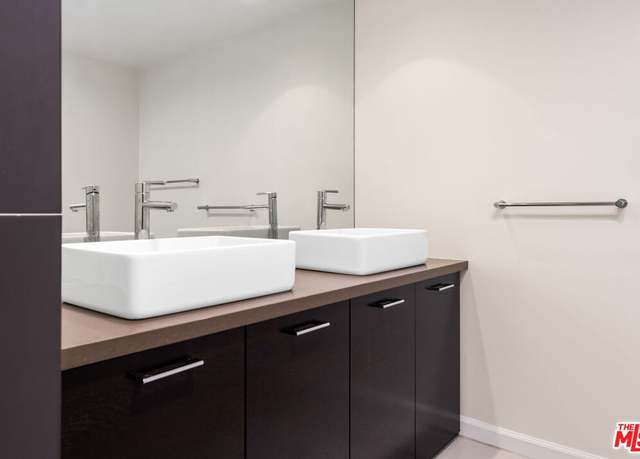
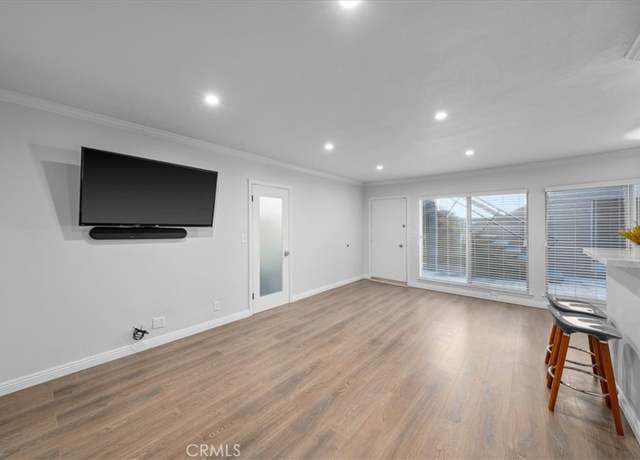
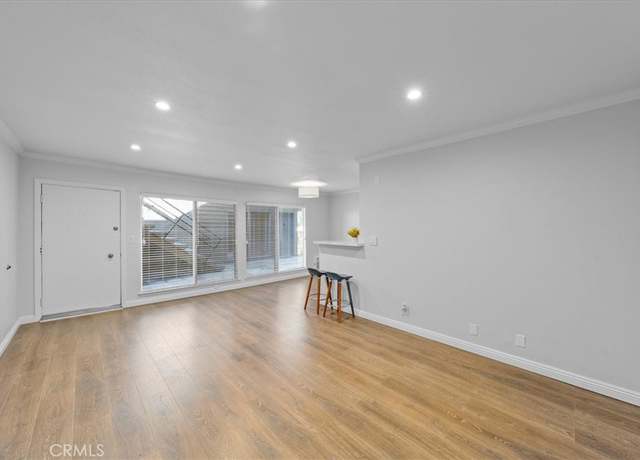
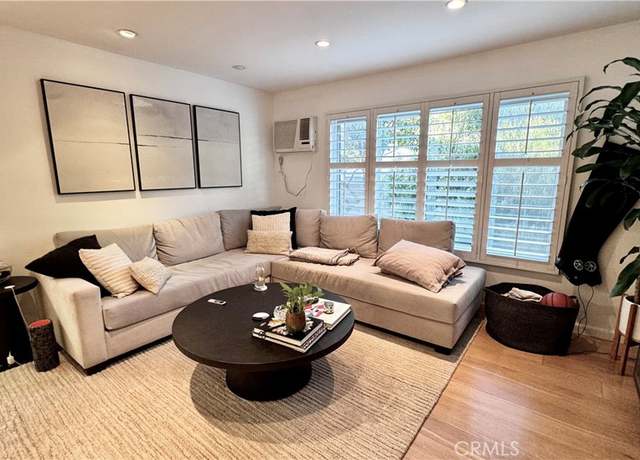
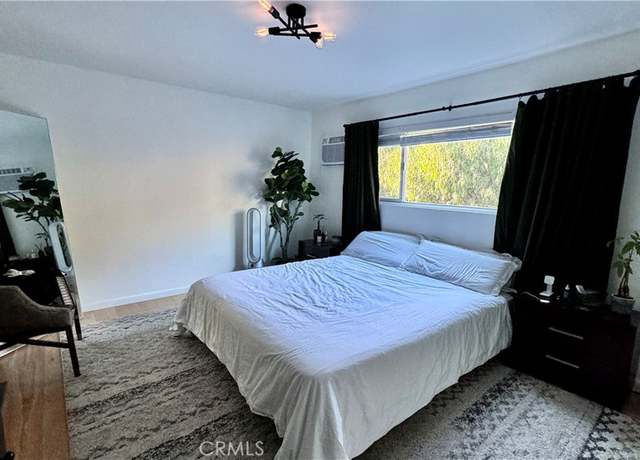
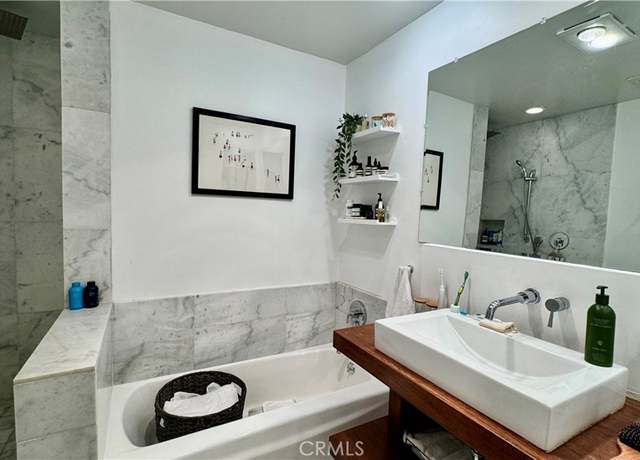
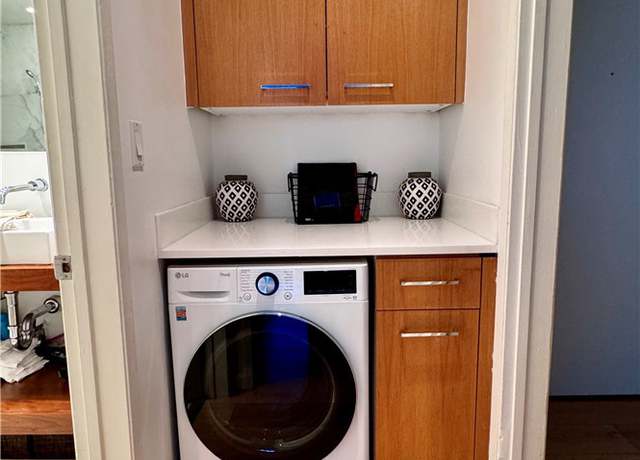
Proud to introduce this incredible condo in the heart of West Hollywood! This 2-bedroom, 2-bathroom corner unit in the renowned Larrabee Manor is a true gem. As you enter into the inviting living room, experience crown molding, recessed lights, and beautiful laminate floors. Enjoy the serenity of your front-facing balcony offering tree-line views, creating the perfect spot to unwind. The galley-style kitchen is graciously spacious, featuring granite counters, modern cabinets, stainless steel appliances, and a convenient stackable in-unit washer and dryer. The large primary bedroom boasts a walk-in closet and a modern en-suite bathroom with a glass-enclosed shower and pristine white tile wal
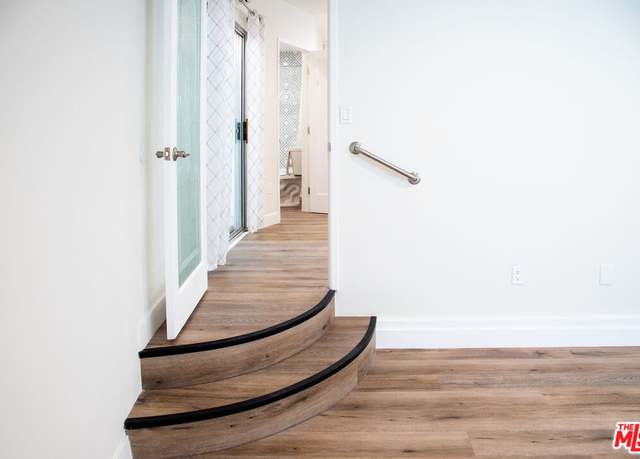
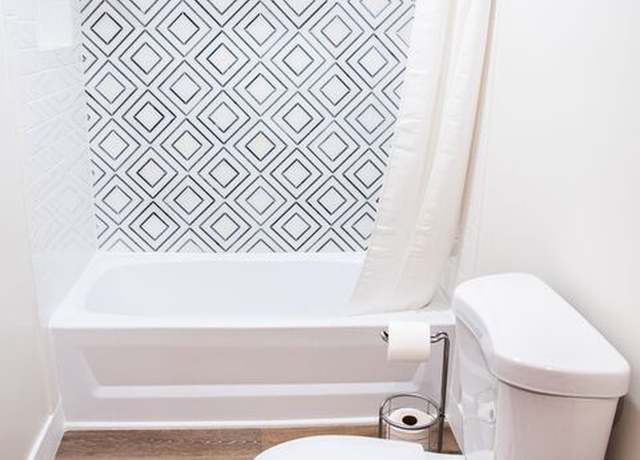
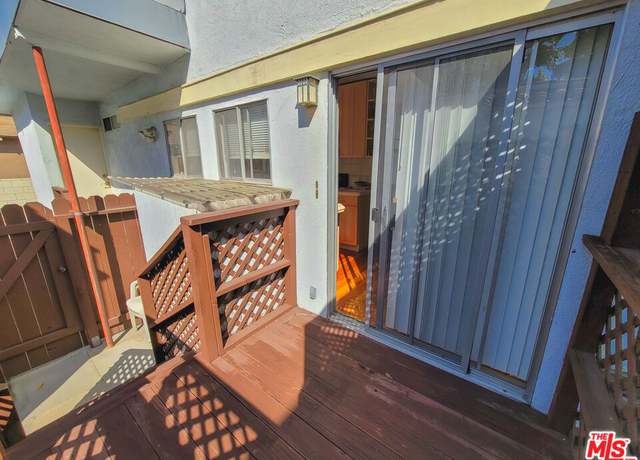
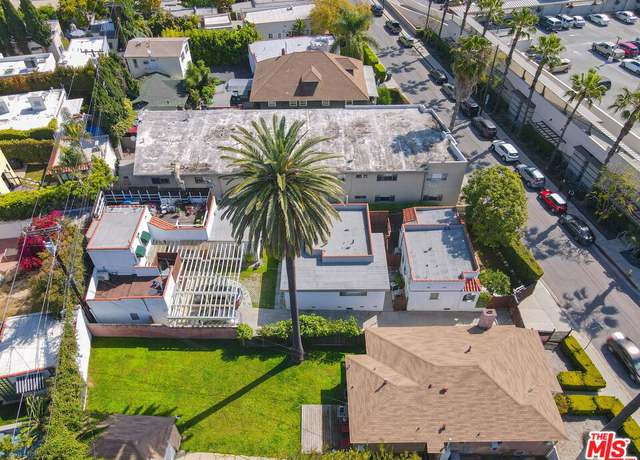
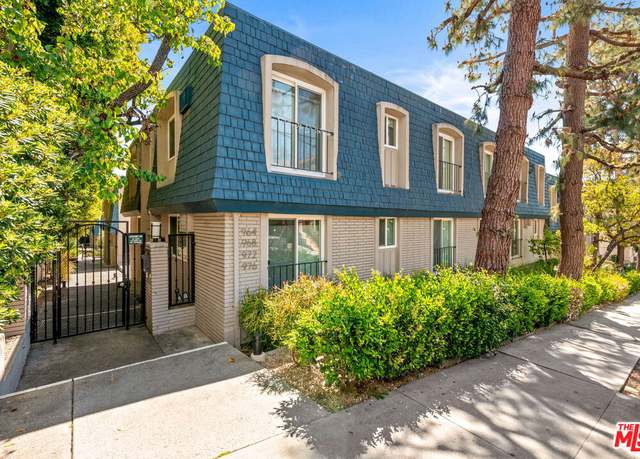
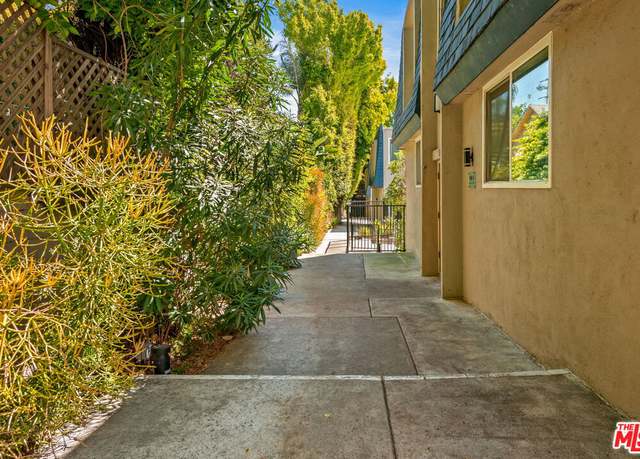
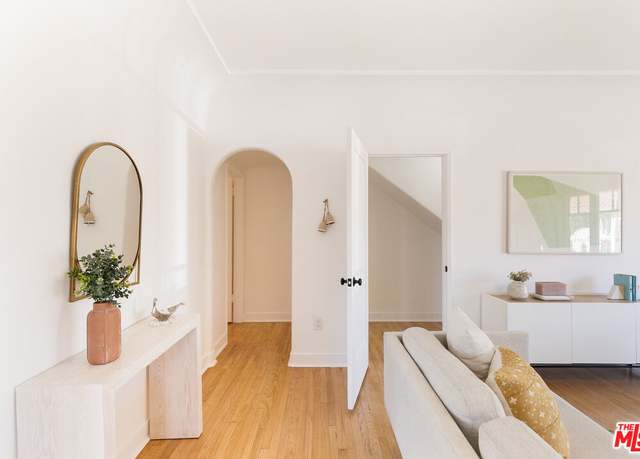
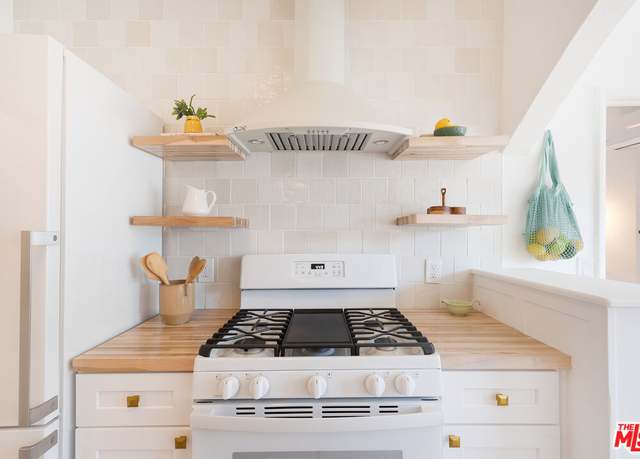
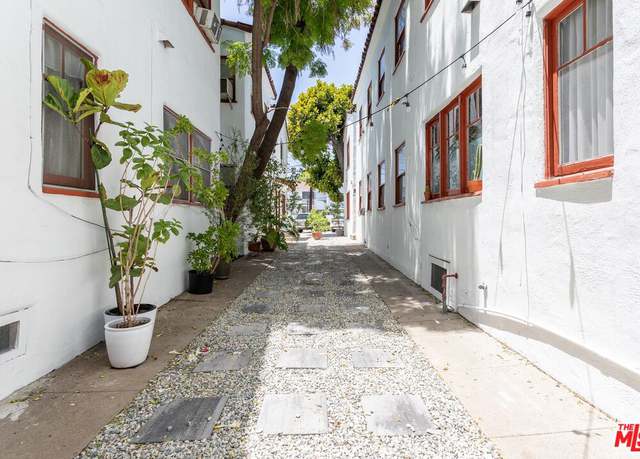
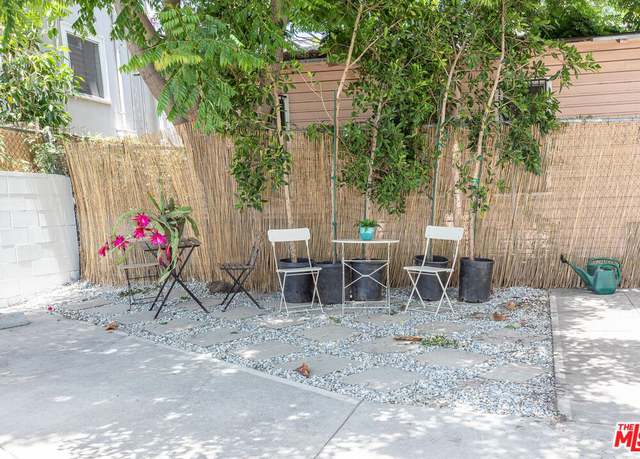
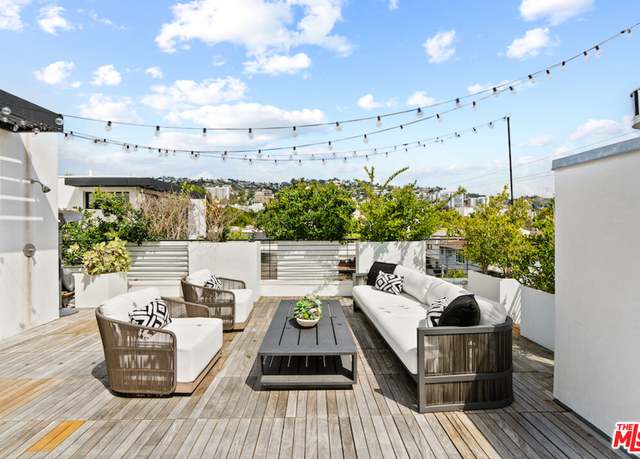
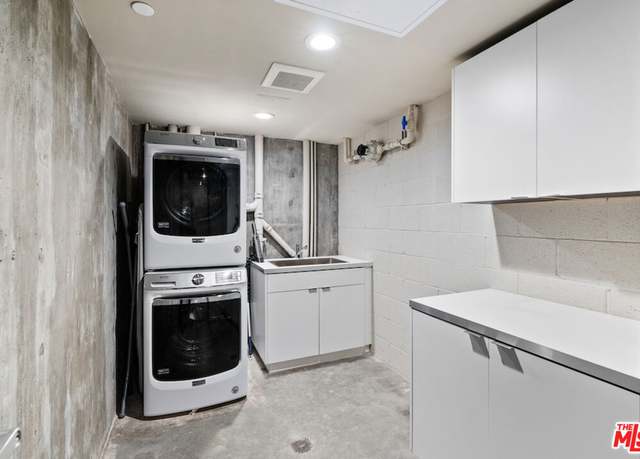
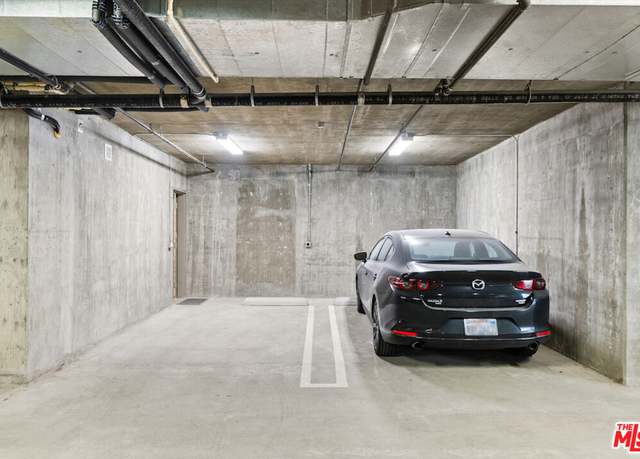
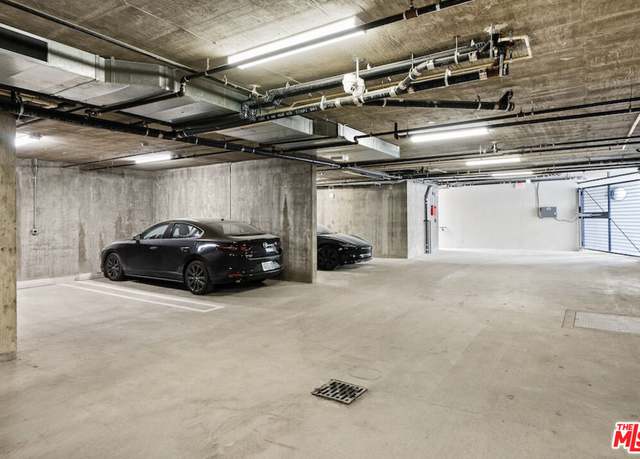
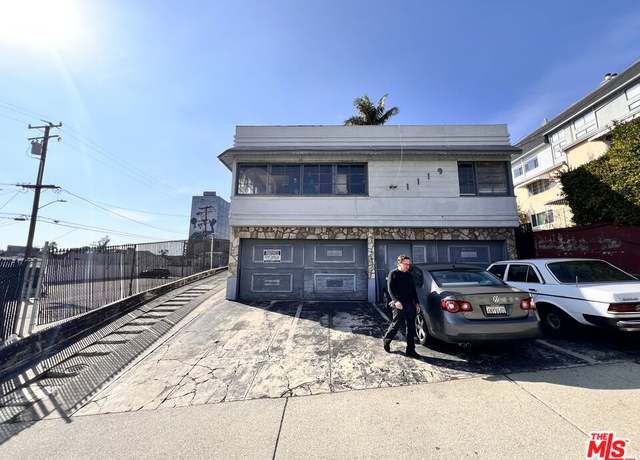
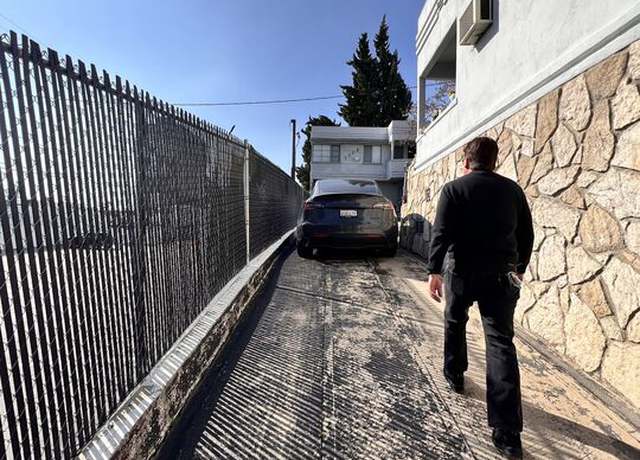
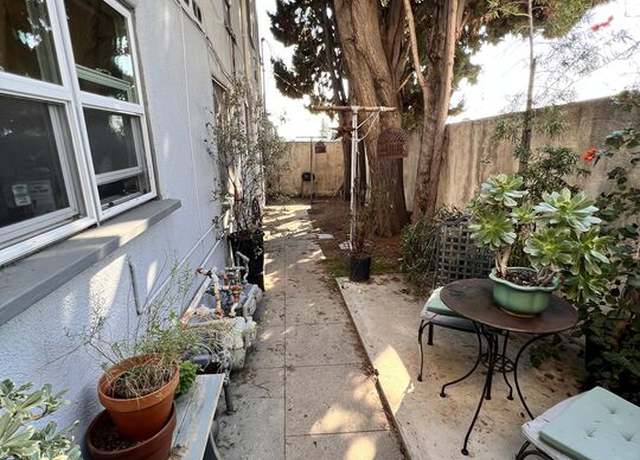
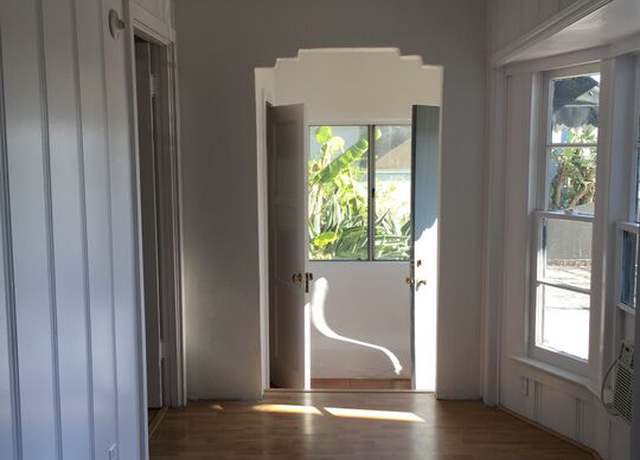
We are pleased to present a four (4) unit apartment building located at 8997 Keith Avenue in West Hollywood, California. The subject property is situated in a prime West Hollywood location, north of Santa Monica Boulevard and east of N Doheny Drive. Built in 1918, this property contains a great unit mix of two (2) one-bedroom / one-bathroom units and two (2) two-bedroom / two-bathroom units. One (1) one-bedroom unit and one (1) two-bedroom unit have spacious rooftop patios. The units are well-maintained with each unit having in-unit washers and dryers or a dedicated washer and dryer in the laundry room for that specific unit. Equipped with a long gated driveway this complex also offers full
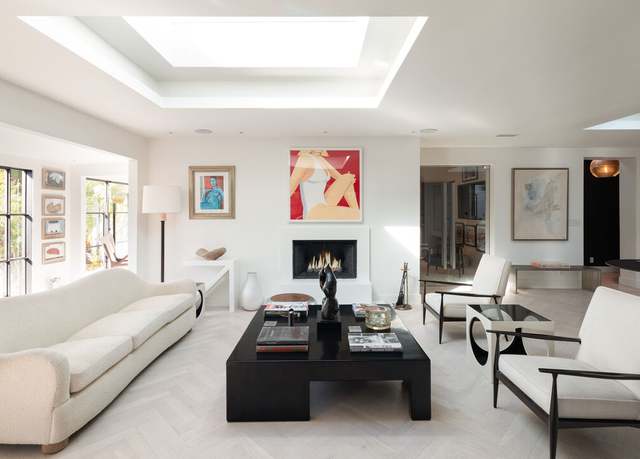
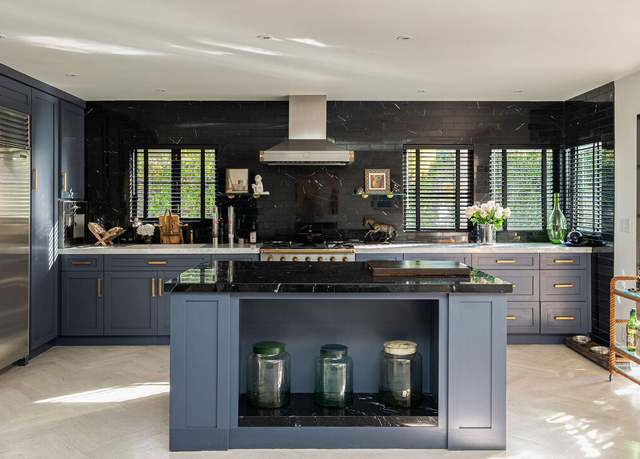
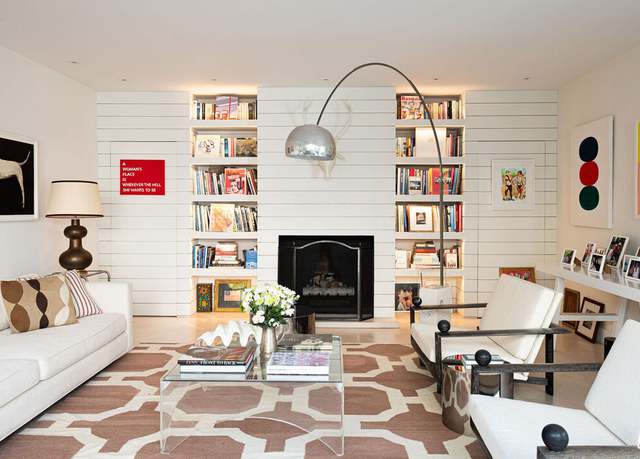
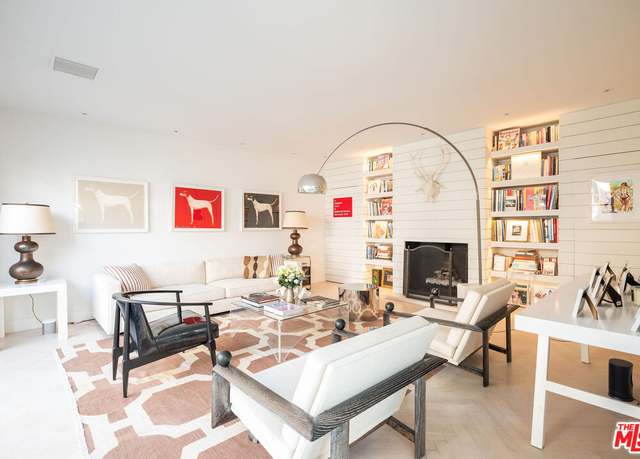
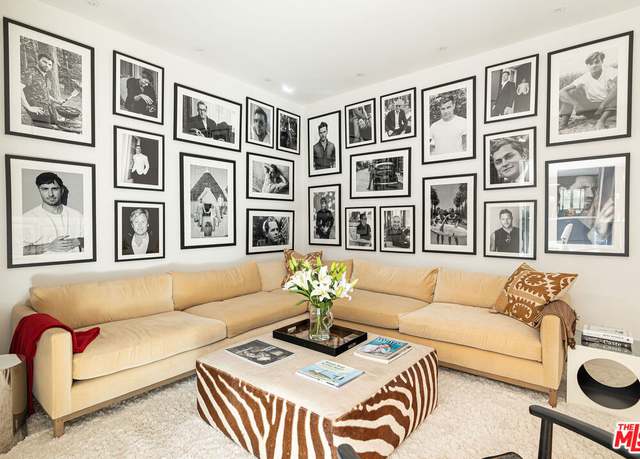
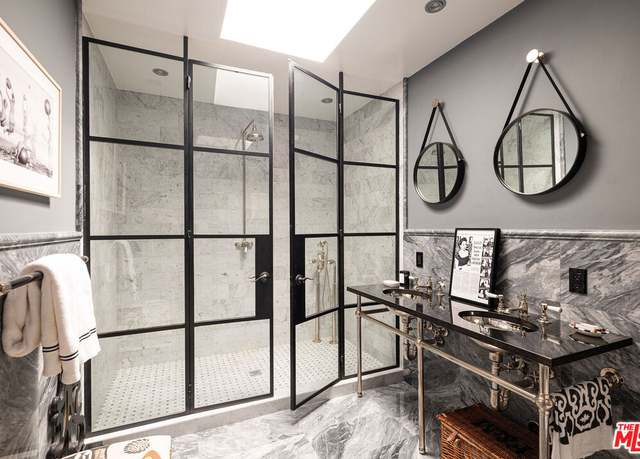
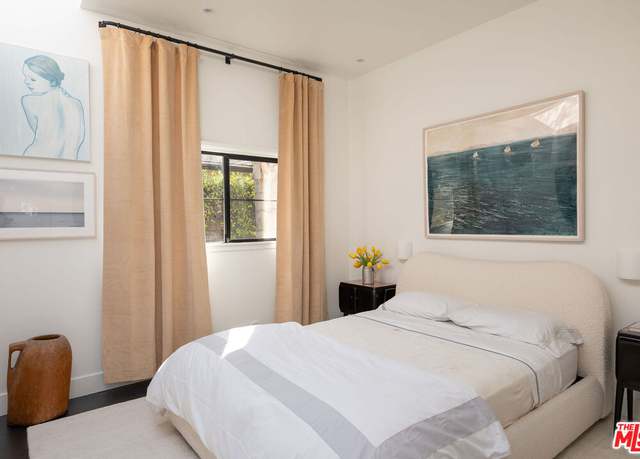
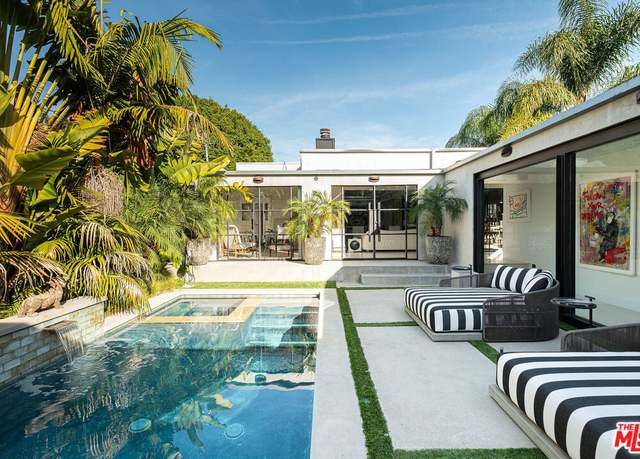
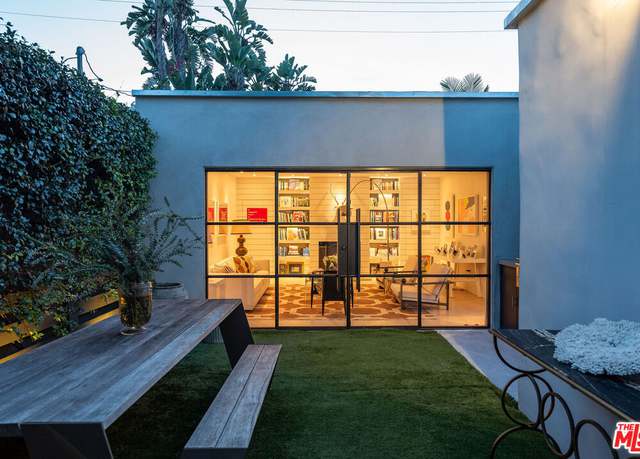
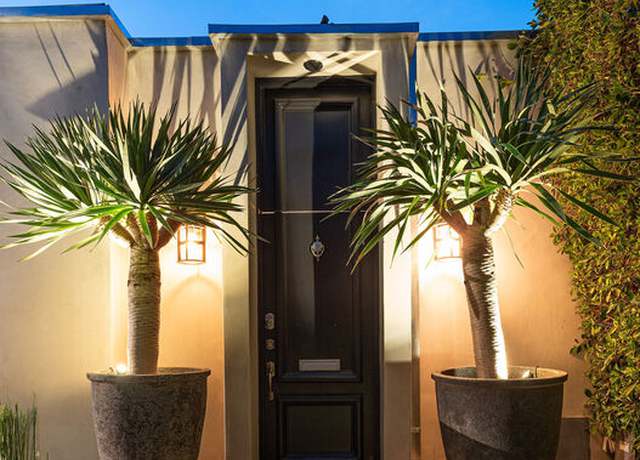
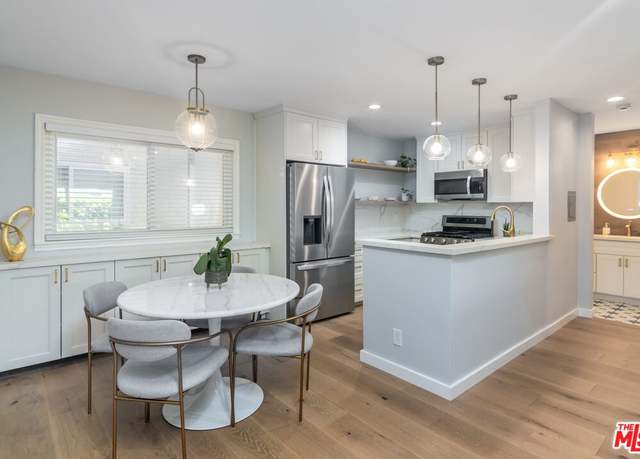
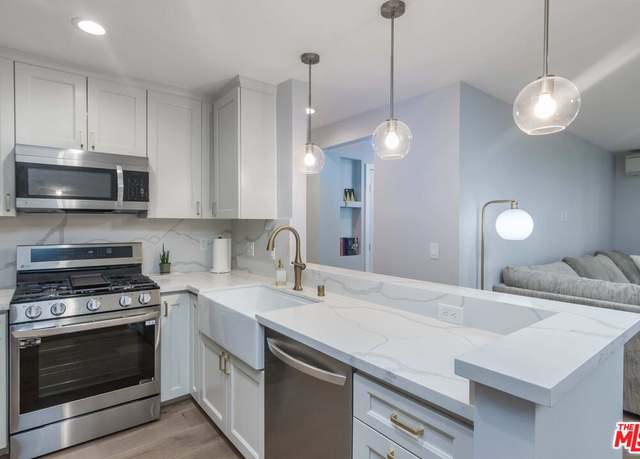
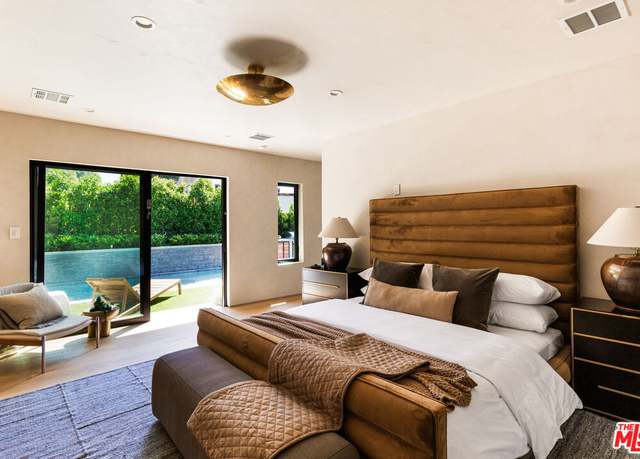
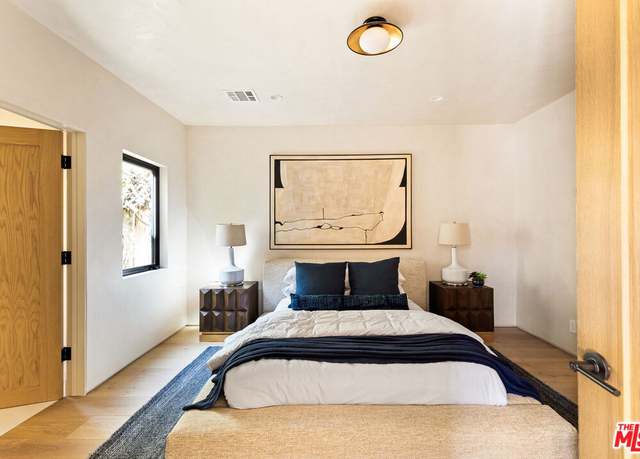
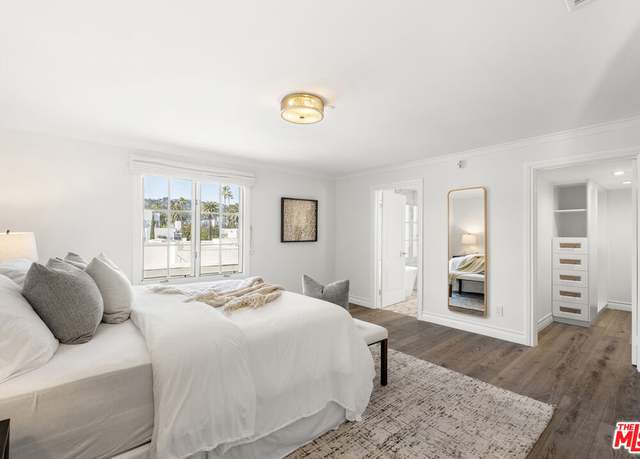
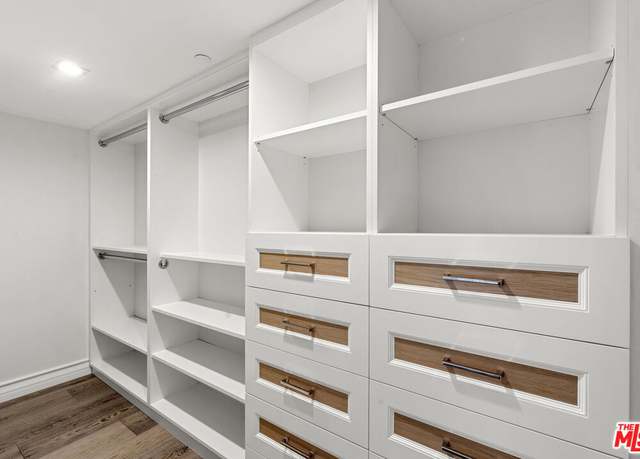
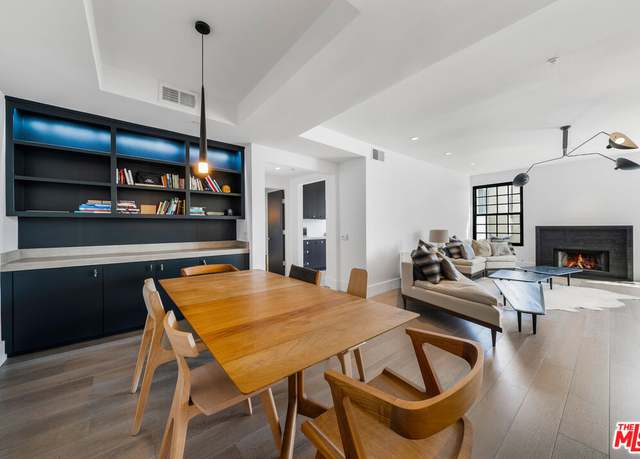
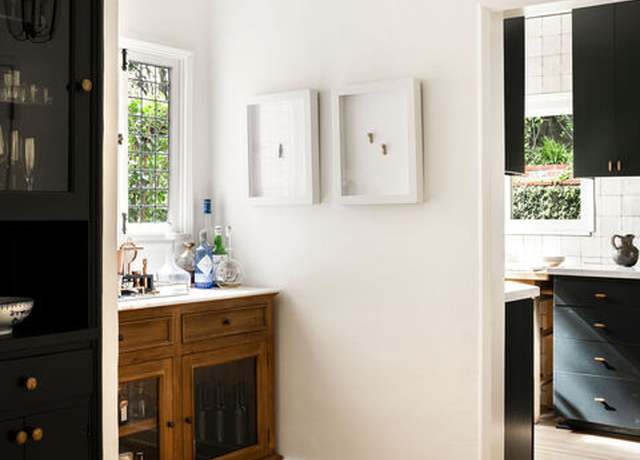
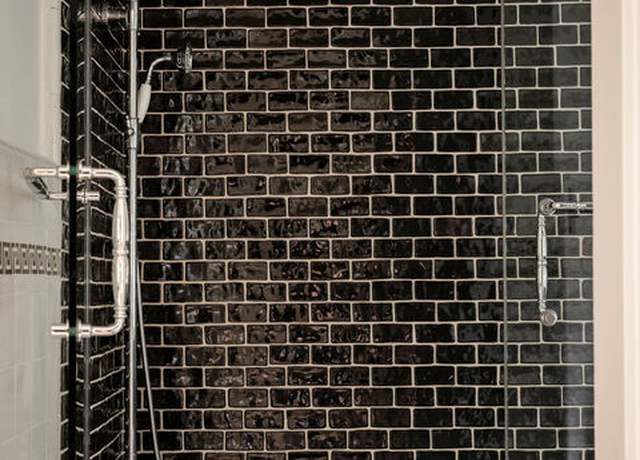
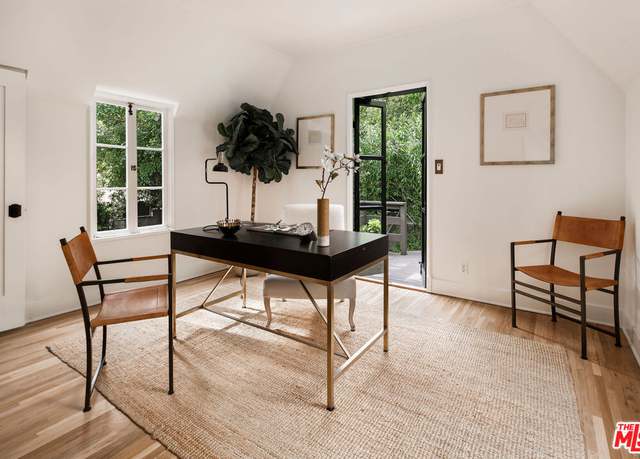
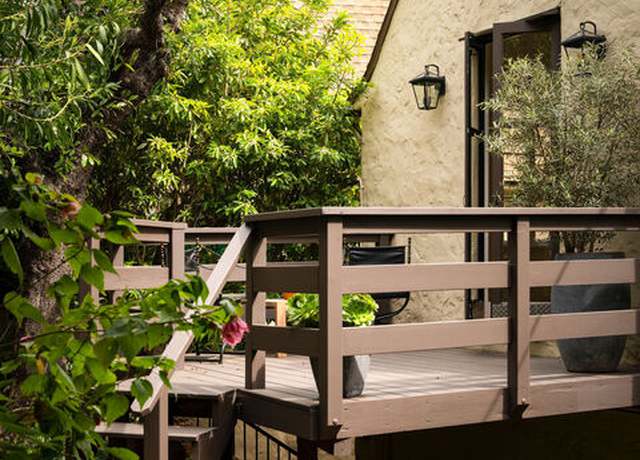
Set behind a large privacy hedge and driveway gate is this mini-compound on a cul-de-sac street in one of West Hollywood's most sought after locations. Hollywood Regency and Contemporary style mingle in a sophisticated, sprawling single-level home spanning over 2,700 sqft - an extremely rare find in West Hollywood West. Re-imagined by Leslie Klotz, who has been featured in Elle Decor and House Beautiful, this residence is executed to the highest degree with no expense spared. High ceilings and skylights allow natural light to pour into a three bedroom, four bathroom home, which features chic living areas, custom kitchen with La Cornue range, fixtures by WaterWorks, and appliances by Gaggena
Discover the epitome of urban living in this exquisitely remodeled one-bedroom, one-bath condominium that blends comfort with chic modernity. Every inch of this home has been thoughtfully updated to maximize both style and functionality. The kitchen, a masterpiece of design, features custom cabinets that provide plenty of storage and stainless steel appliances that add a touch of elegance. Stay comfortable year-round with the newly installed Dual Mini Split with HERS High Ranking. The bedroom boasts a custom walk-in closet designed to organize and showcase your wardrobe. Complementing the sophisticated interior is engineered wood flooring that flows seamlessly throughout, creating a warm an
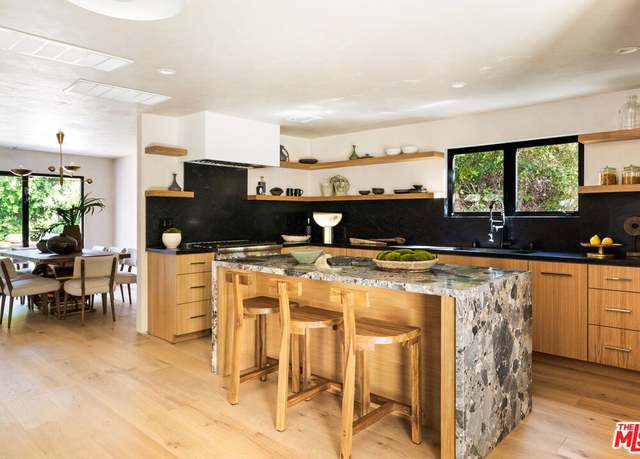
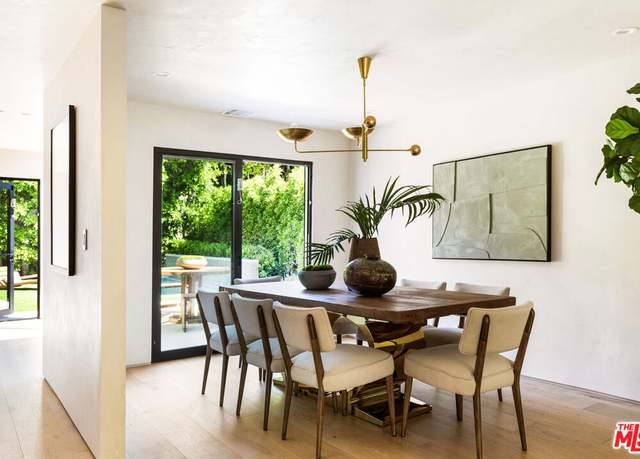
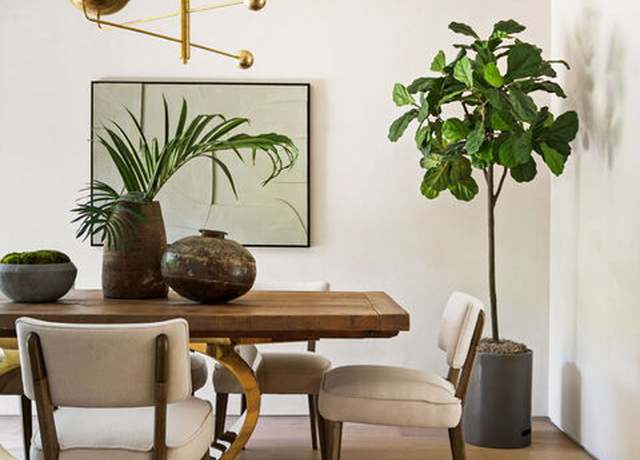
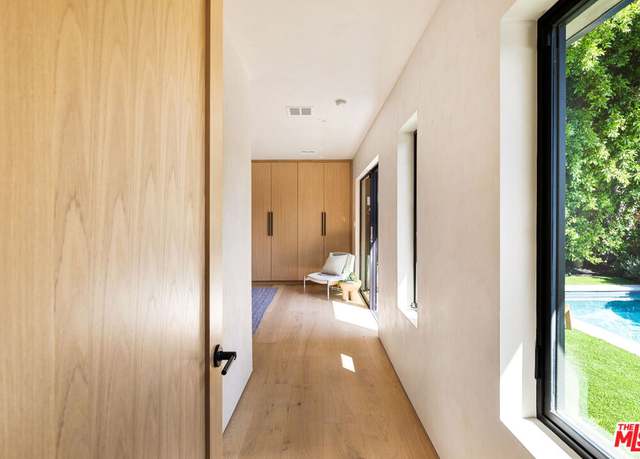
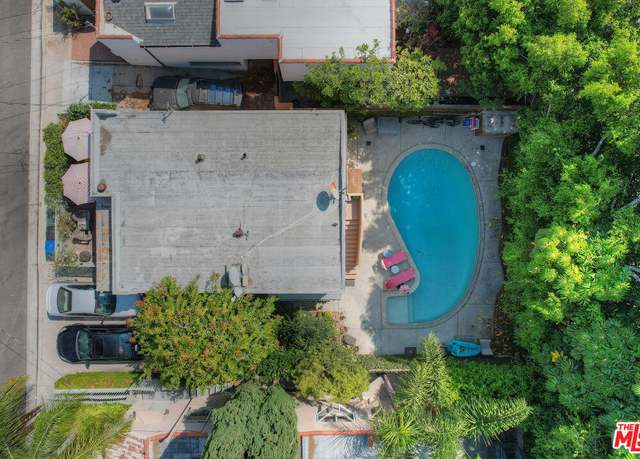
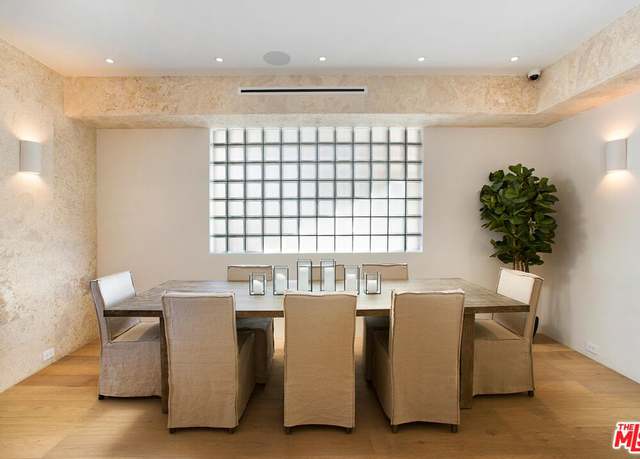
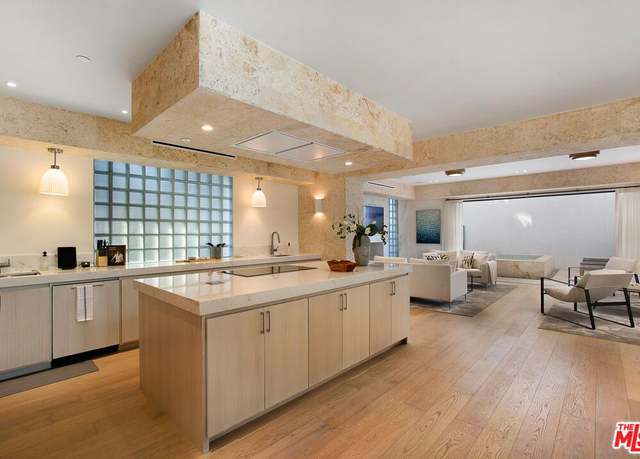
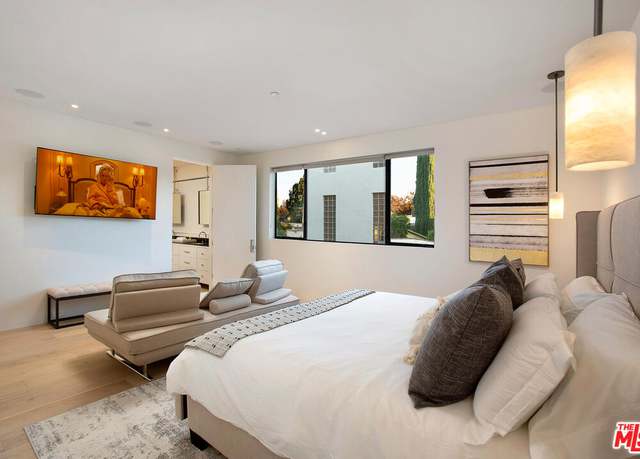
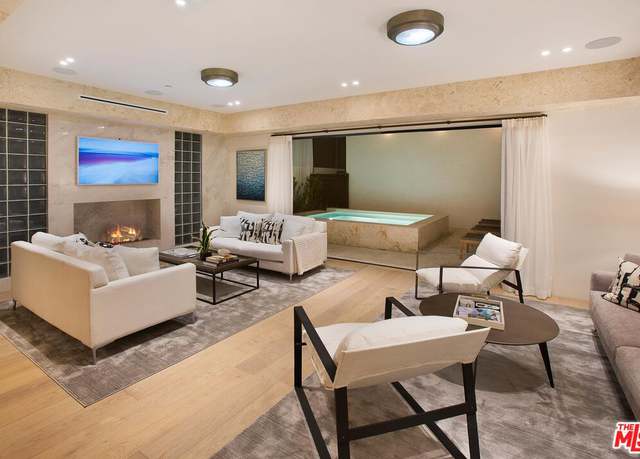
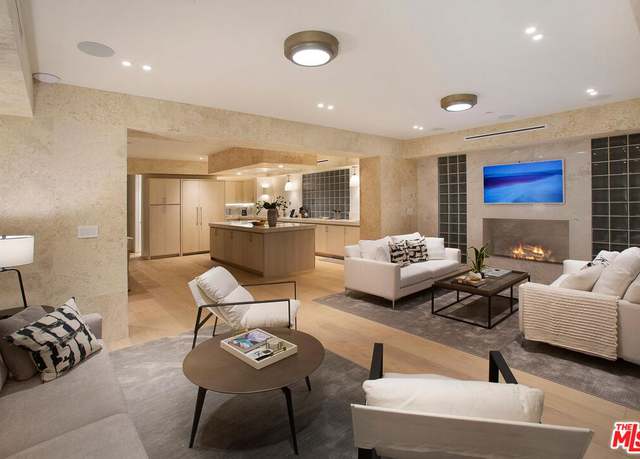
Introducing the Rangely Retreat, a completely renovated 2 Bedroom + Den masterpiece in arguably West Hollywoods best location. This home combines warm architecture with natural elements creating the perfect balance between light, space, and comfort. Unique features include exquisite white oak cabinetry, fleetwood doors, wide plank hardwood flooring, Moca limestone bathrooms, and a gourmet Thermador Kitchen. Enjoy being steps away from the most popular shops, restaurants, and nightlife including Catch, Craig's, Zinque, and Ceccoins. Privacy is ensured with a gated entrance including 2-3 parking spaces, a hedged perimeter, and resort-style pool making the yard a true tranquil escape.
Discover the epitome of elevated living in this extraordinary 3-bedroom penthouse, nestled in the coveted enclave of prime Beverly Hills. As you step into this remarkable residence, you are greeted by an awe-inspiring open floor plan, adorned with soaring high ceilings that create an ambiance of grandeur and sophistication. The main level boasts a bedroom complete with a 3/4 bath, ensuring privacy and comfort for guests or family members. The gourmet kitchen is a chef's delight, featuring granite countertops, a breakfast area for casual meals. Sunlight pours through large windows, illuminating an interior that melds modern finesse with timeless elegance. The formal dining room seamlessly tr
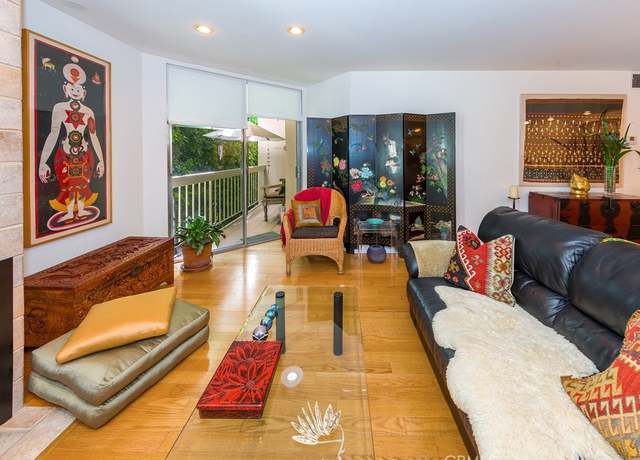
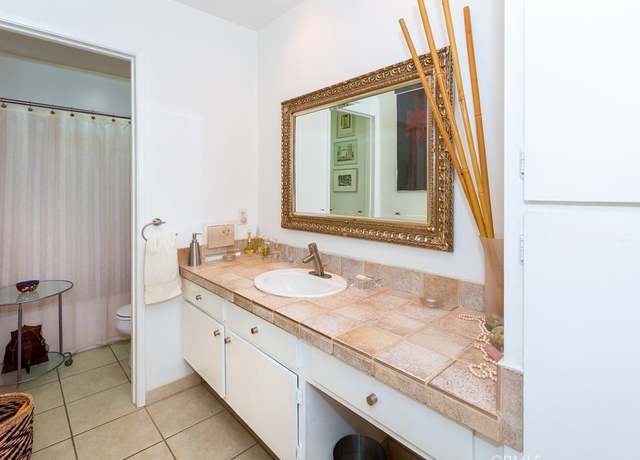
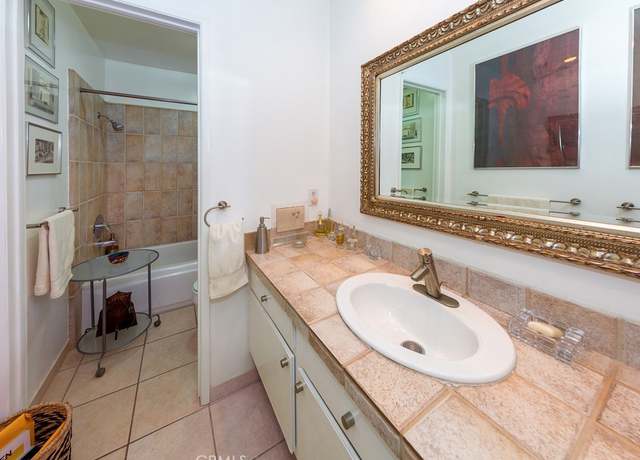
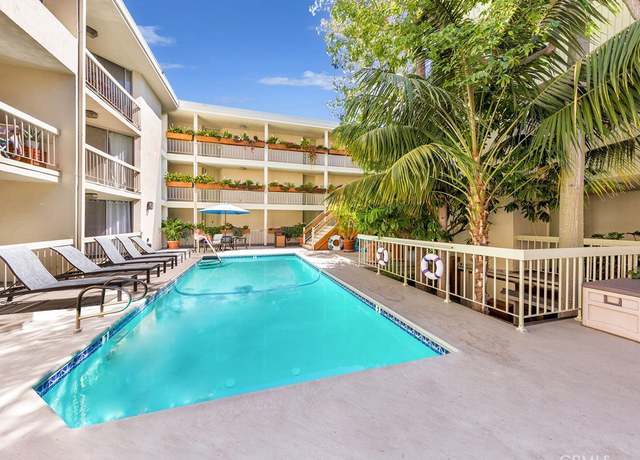
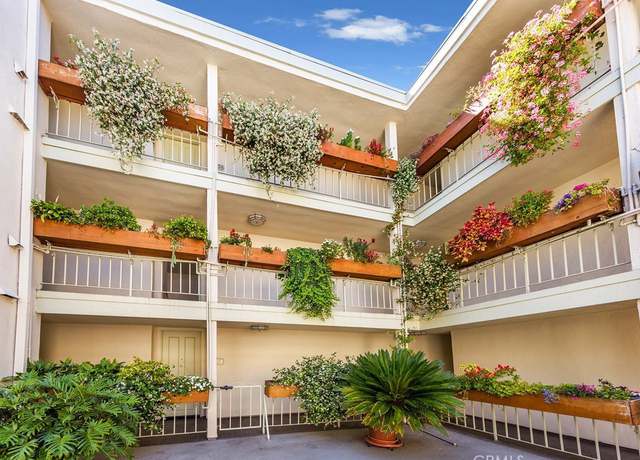
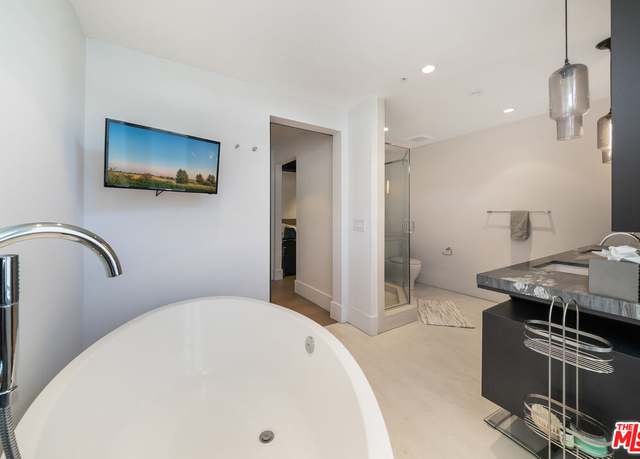
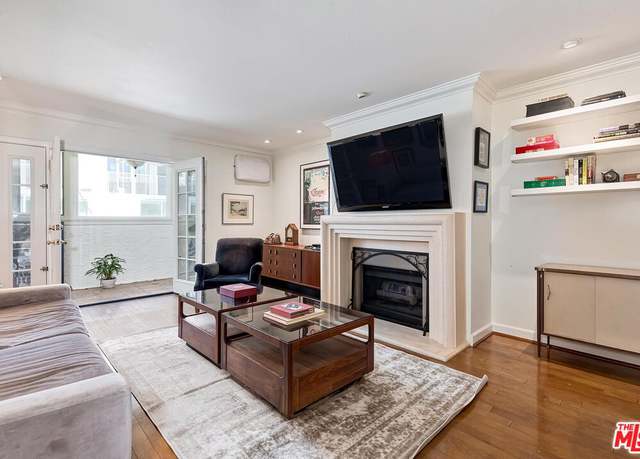
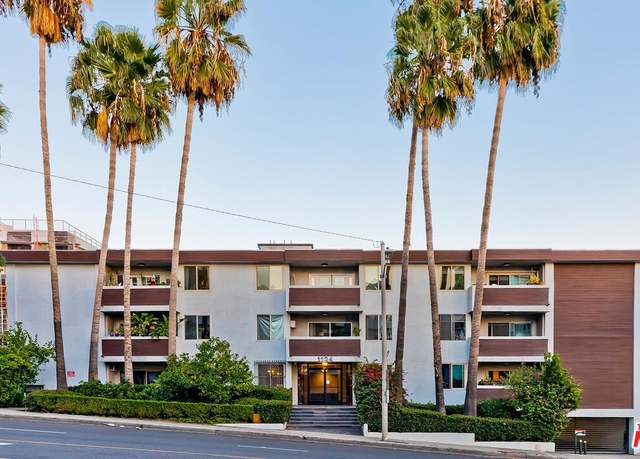
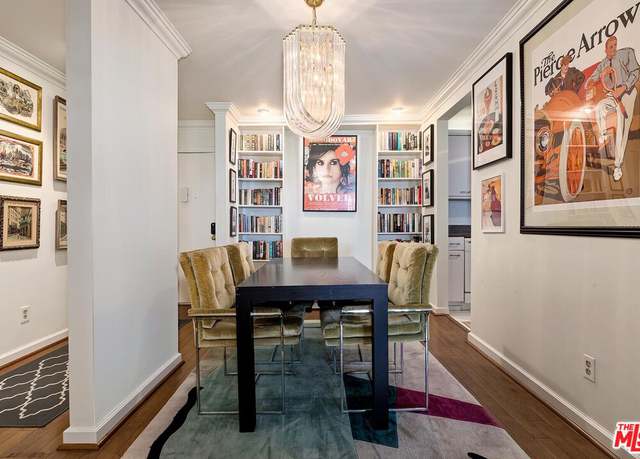
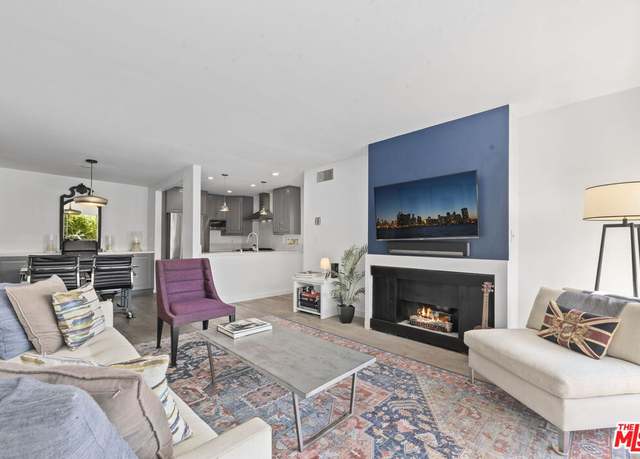
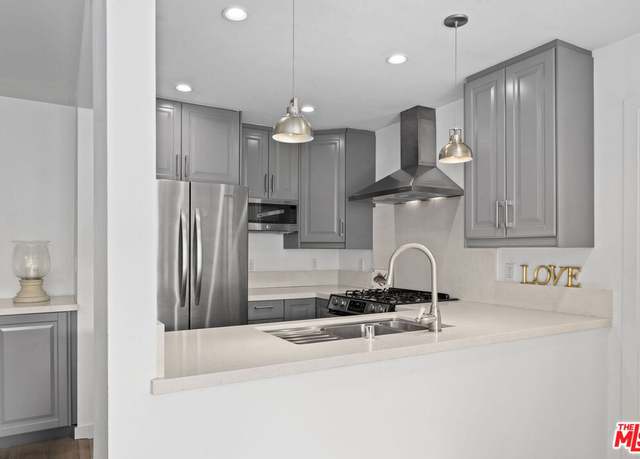
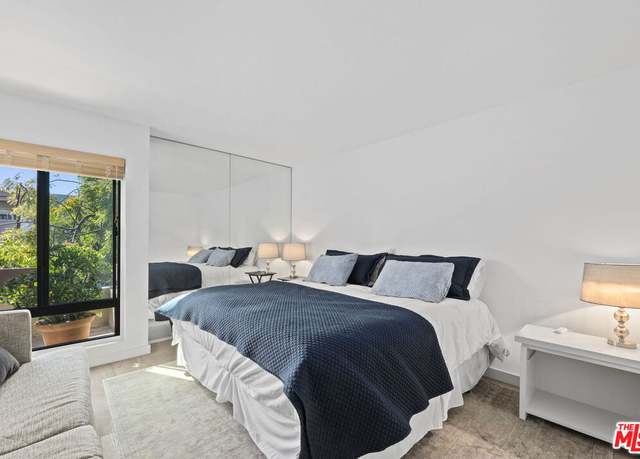
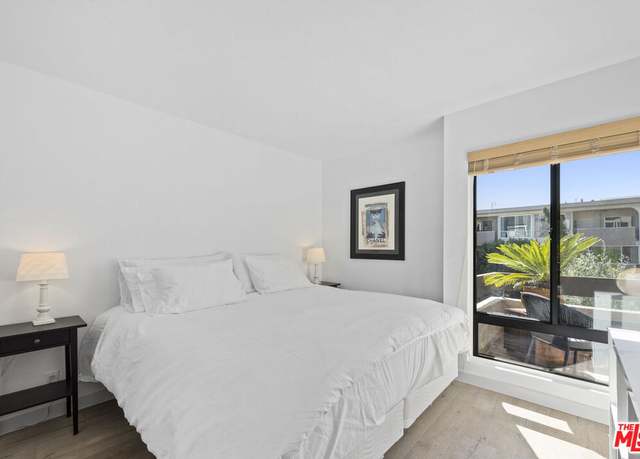
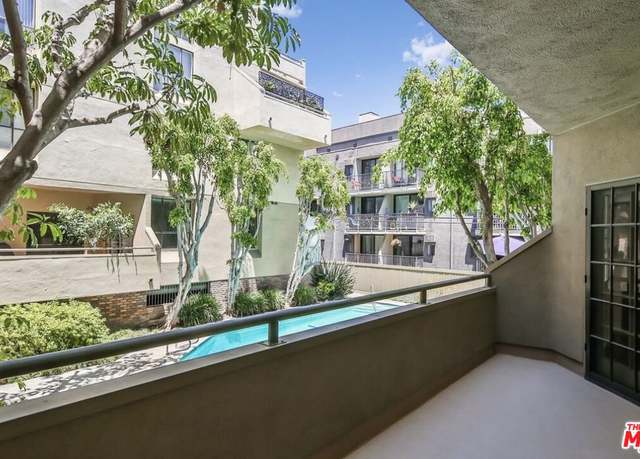
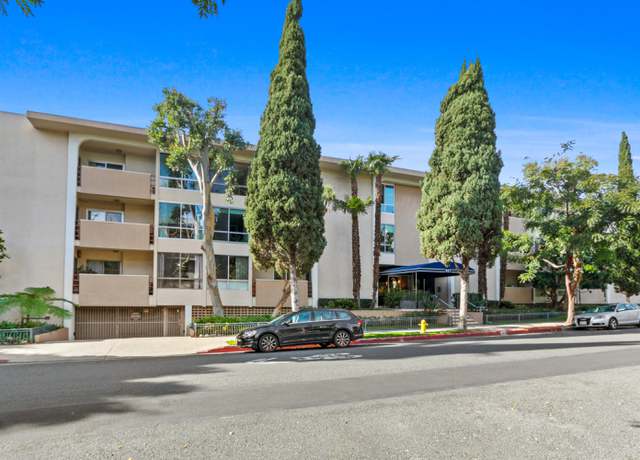
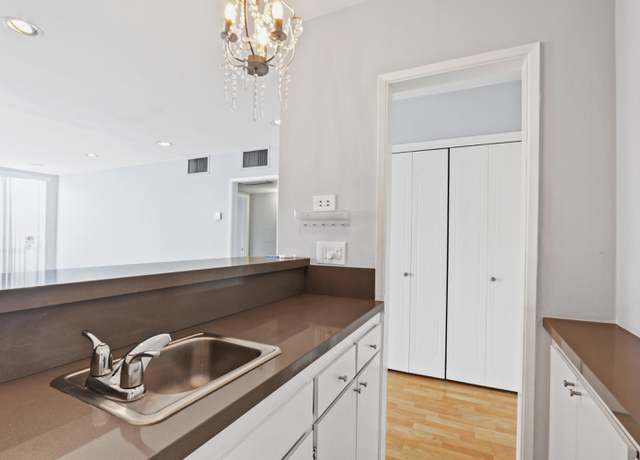
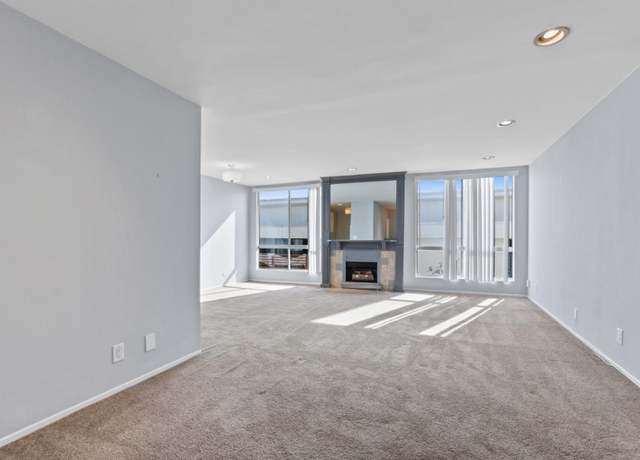
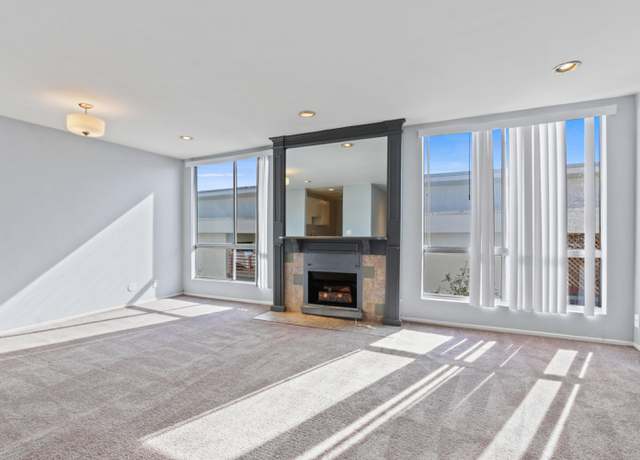
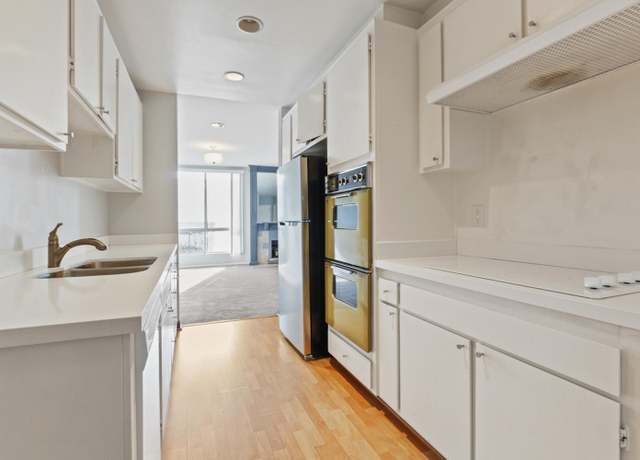
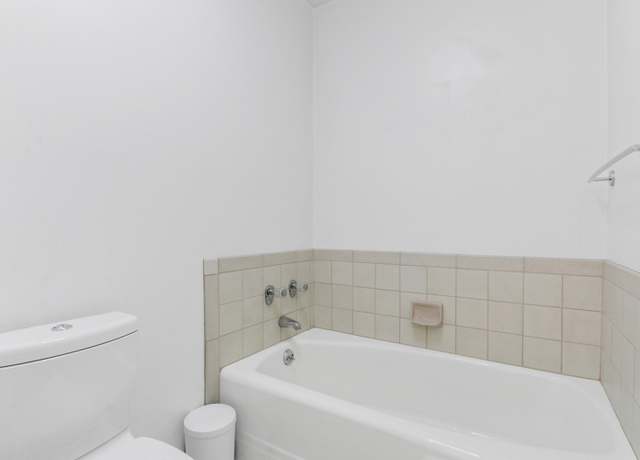
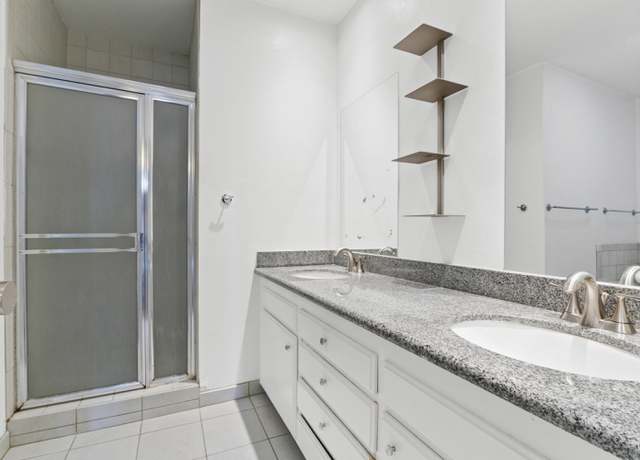
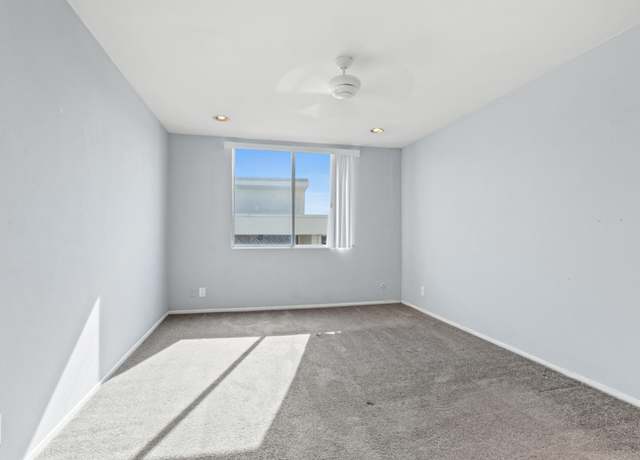
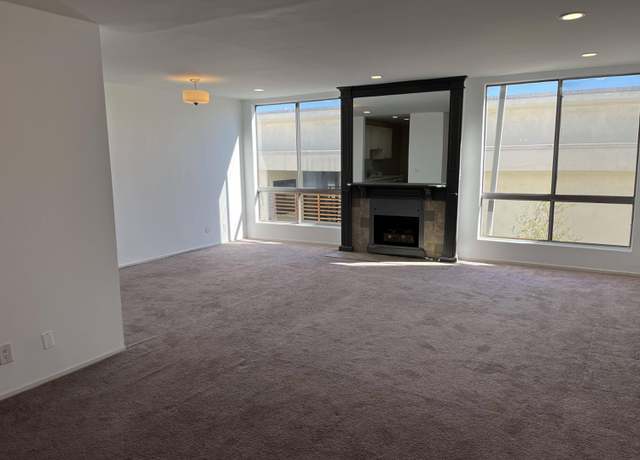
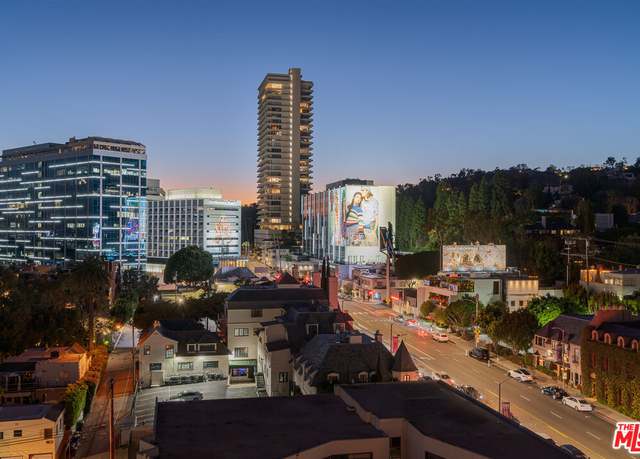
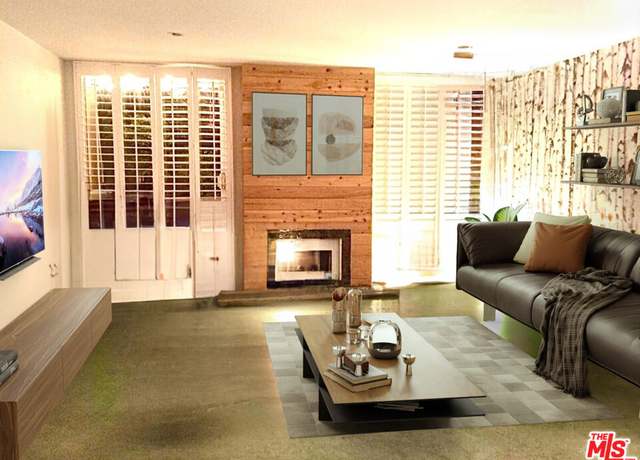
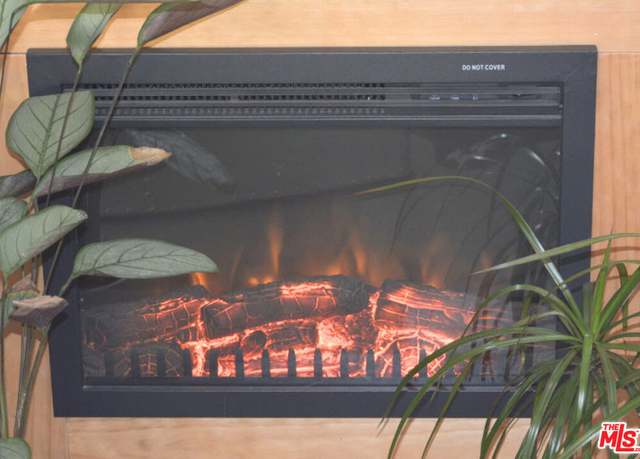
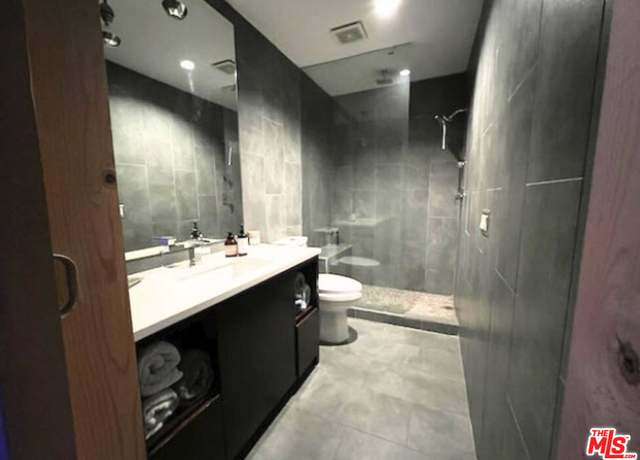
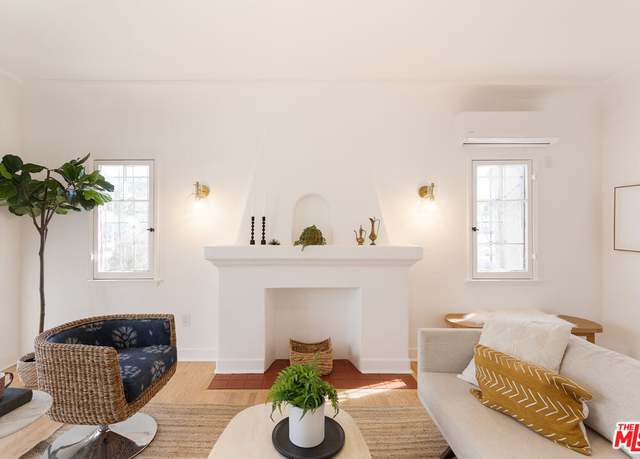
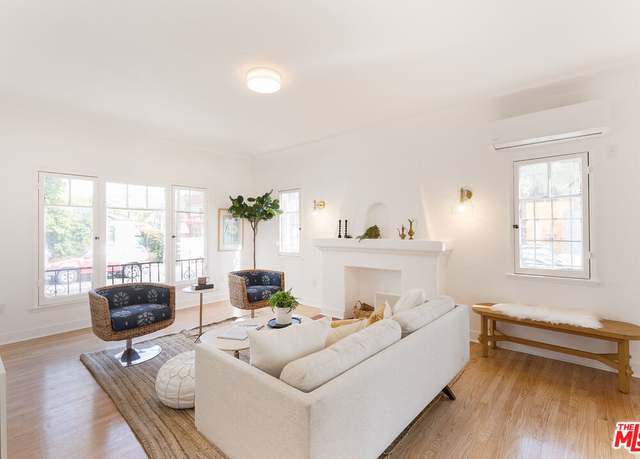
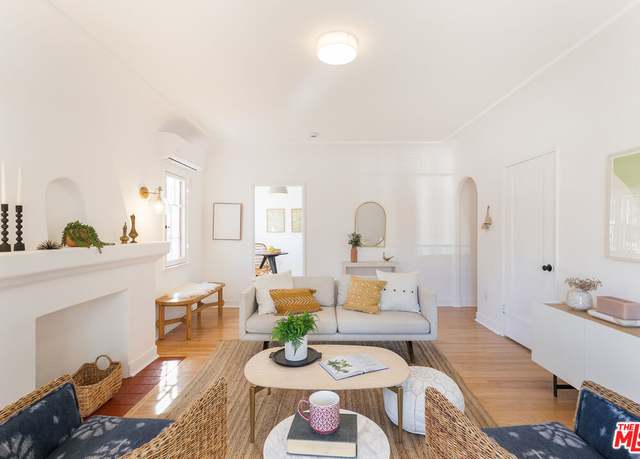
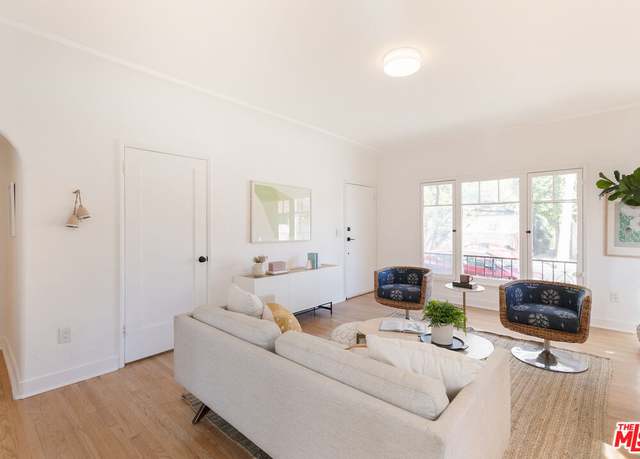
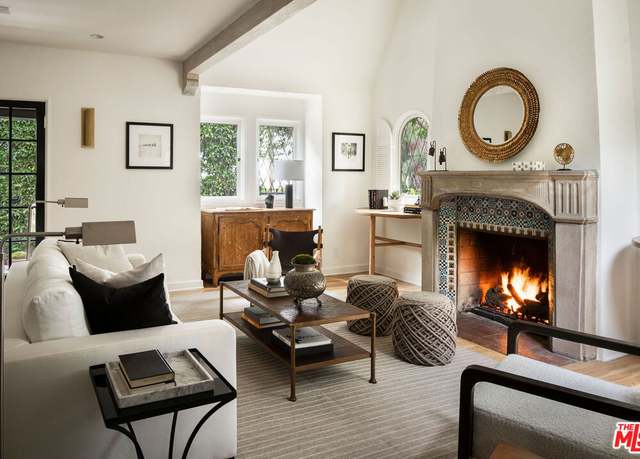
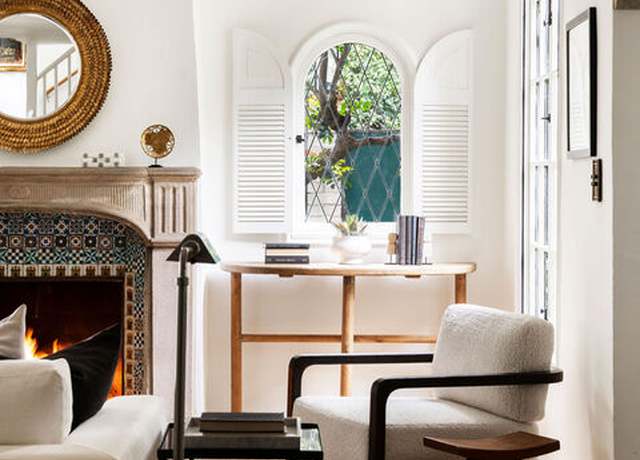
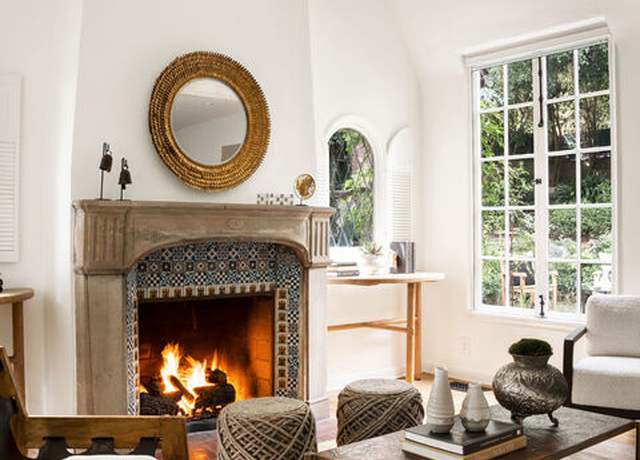
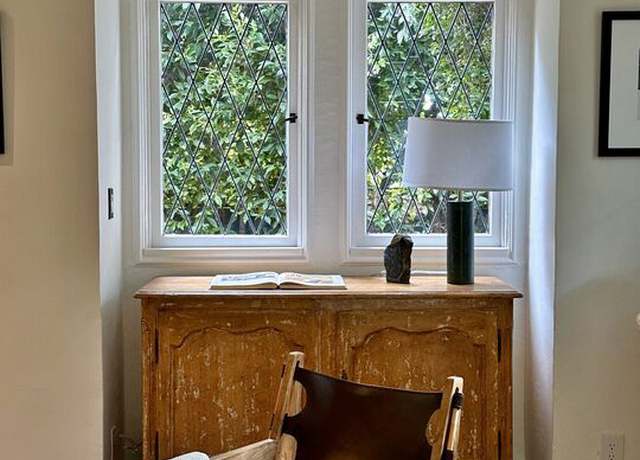
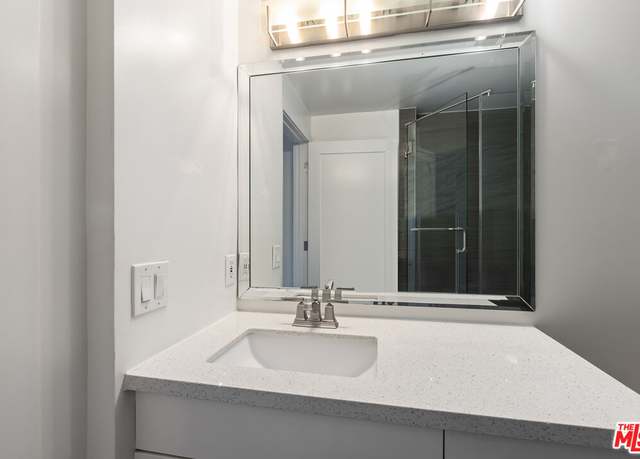
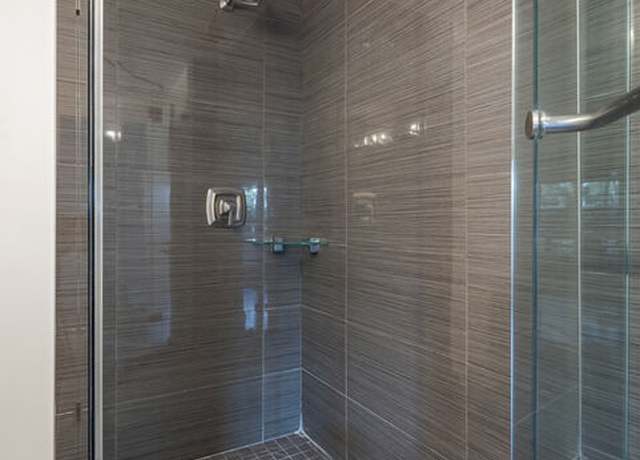
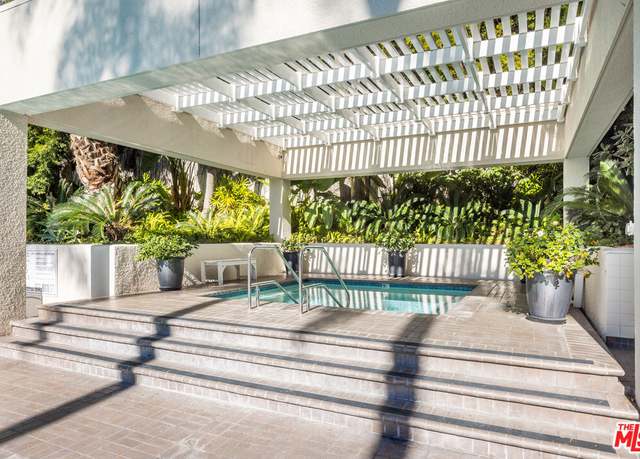
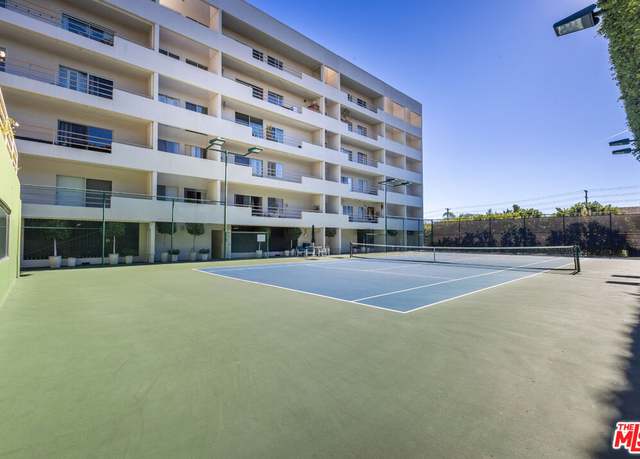
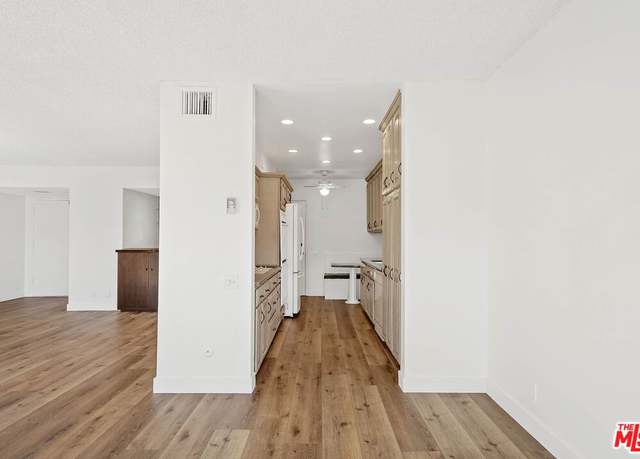
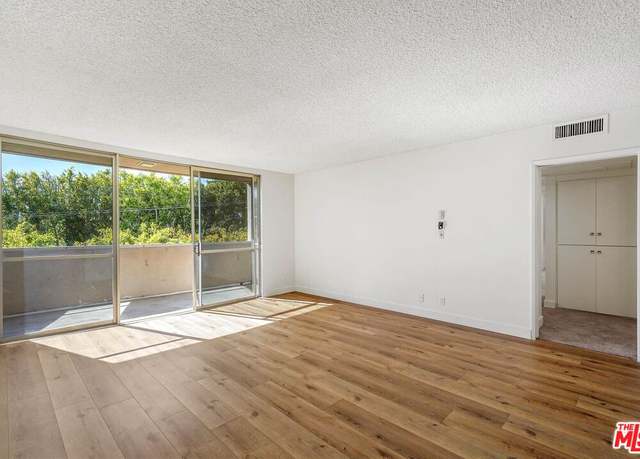
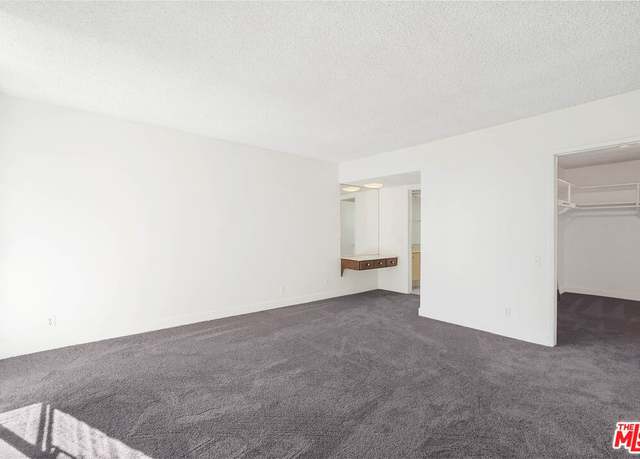
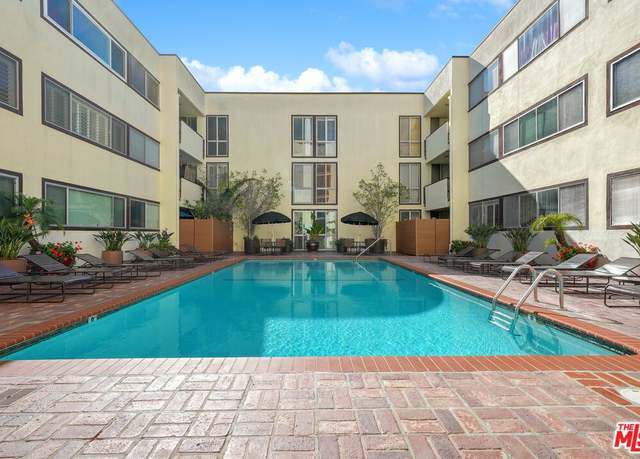
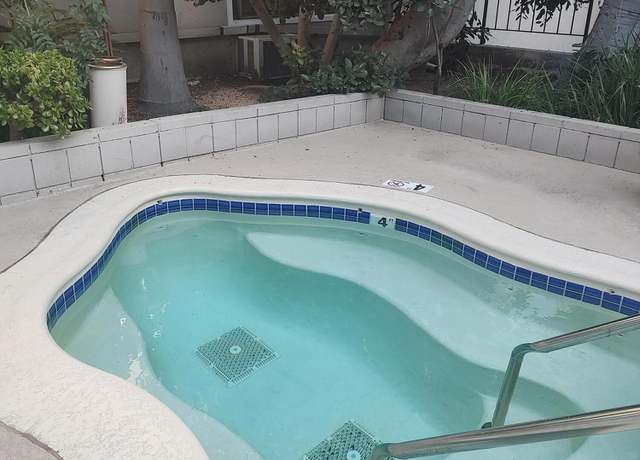
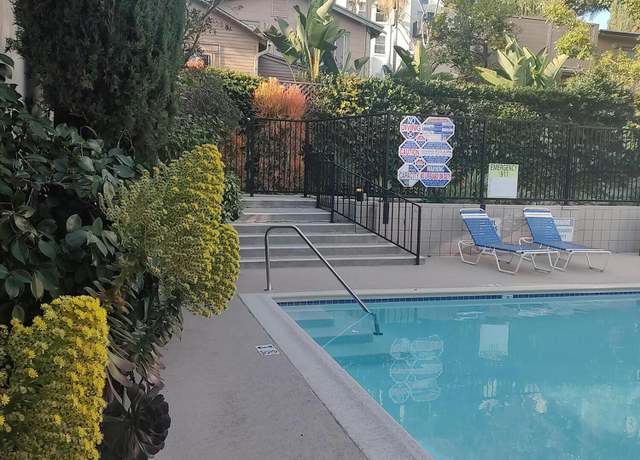
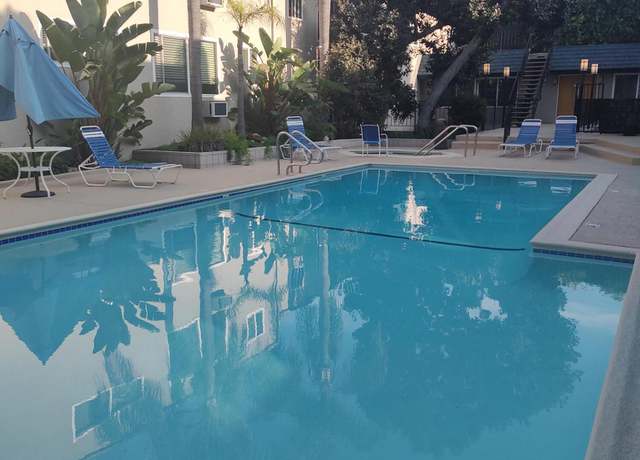
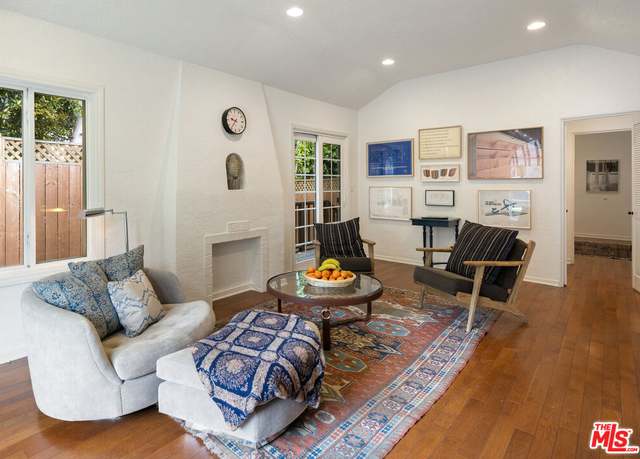
Lovely one bedroom condo on a quiet, tree-lined street in West Hollywood. Featuring hardwood and tiled floors, recessed lighting on dimmer switches, gas fireplace (HOA pays for gas), a new HVAC system and floor to ceiling windows. The large walk-in closet in bedroom has plenty of storage space. * Samsung stainless steel appliances. Hansgrohe designer faucets in kitchen and bath - both rooms have lots of (tiled) counter space too. Surrounded by trees, the secluded private balcony is accessible from both the living room and bedroom. Assigned parking includes a generous storage unit. * Low HOA dues. Laundry and trash rooms on every floor. Swimming pool and jacuzzi in a garden set
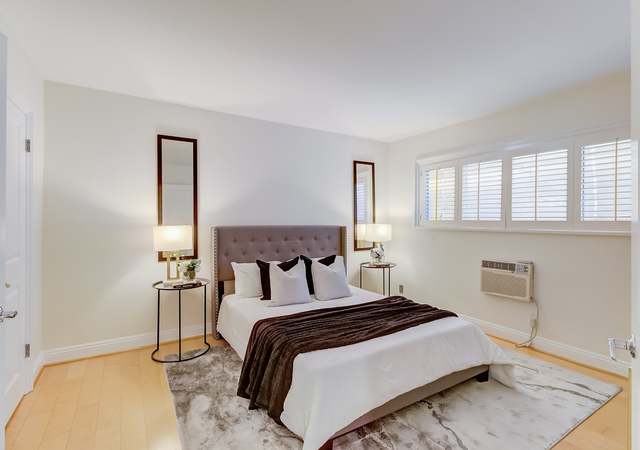
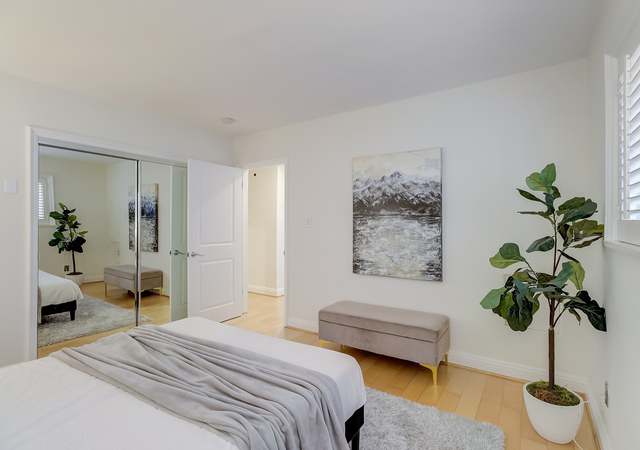
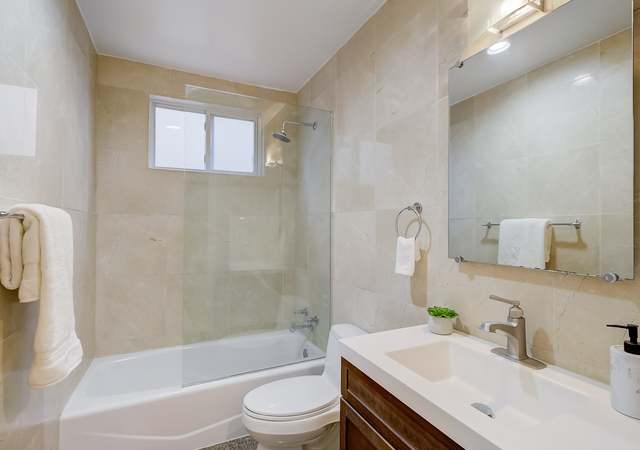
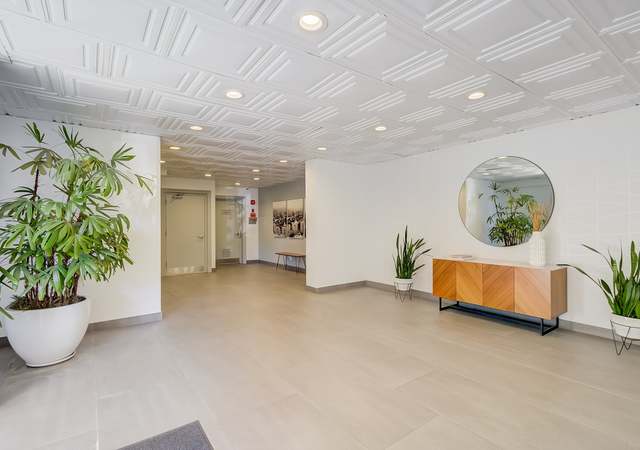
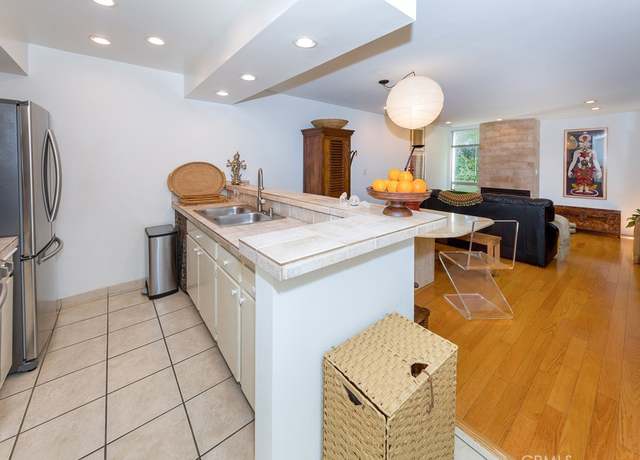
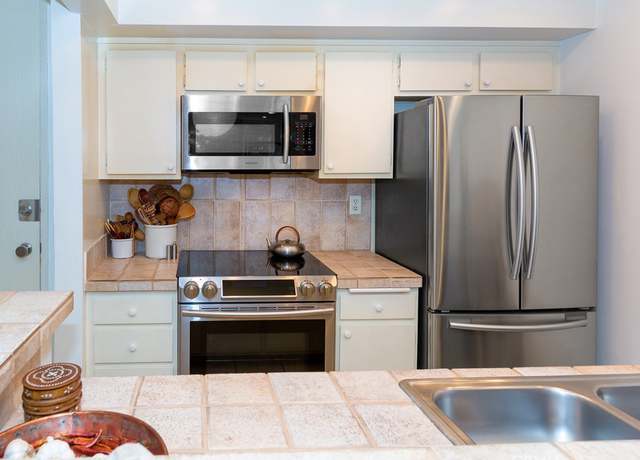
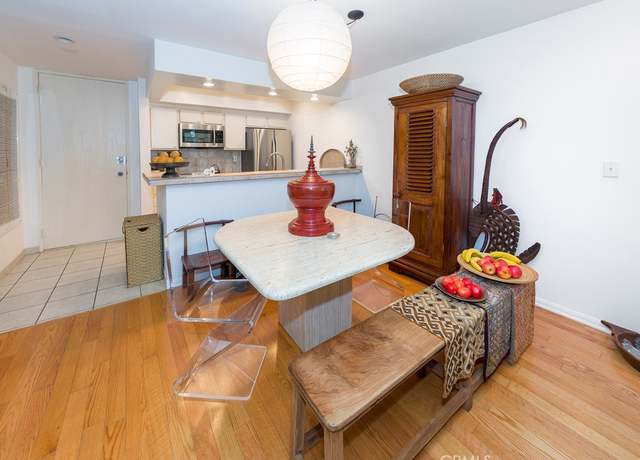
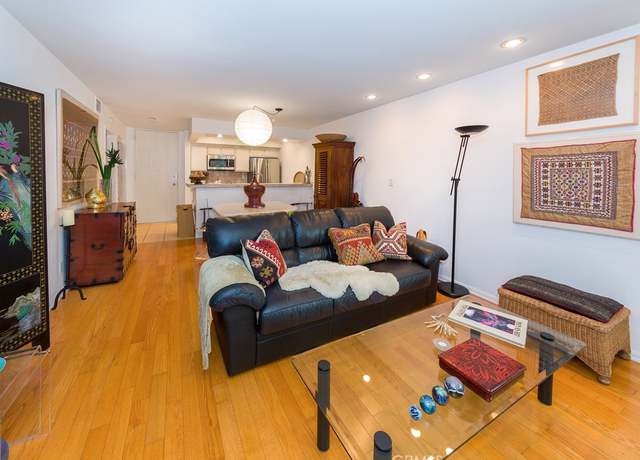
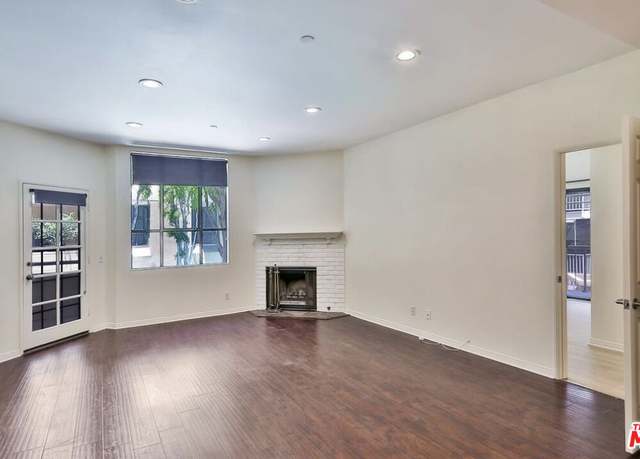
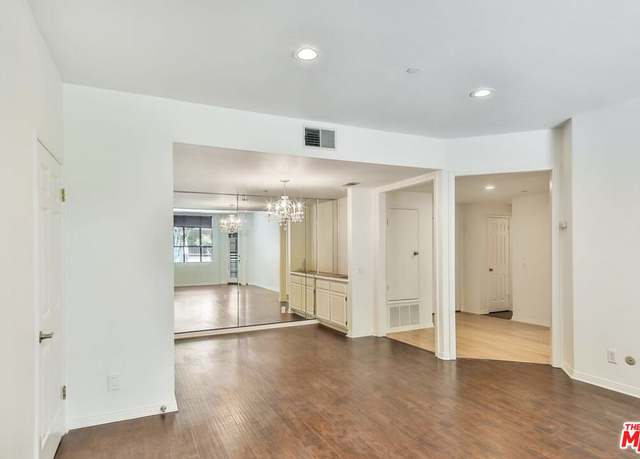
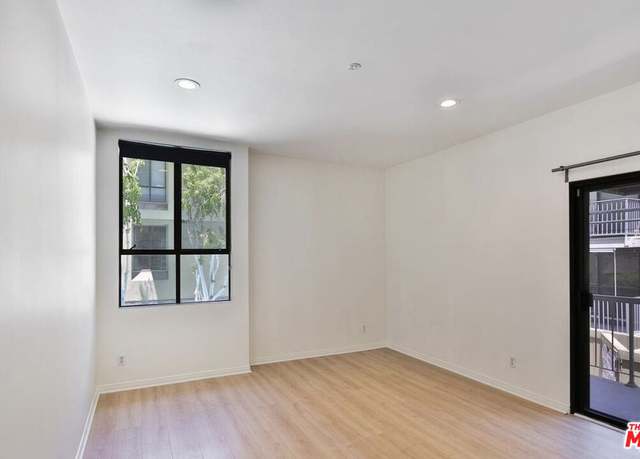
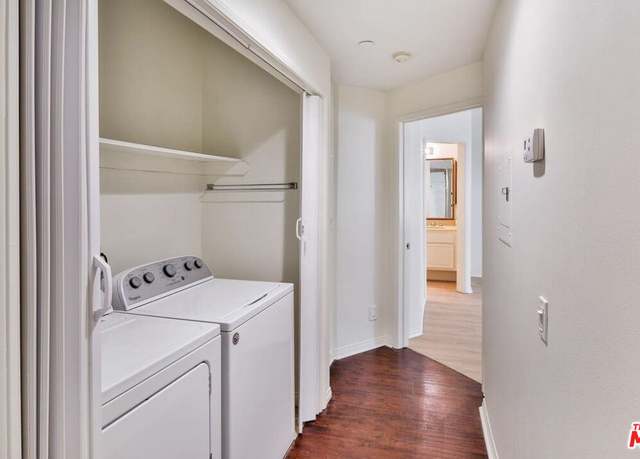
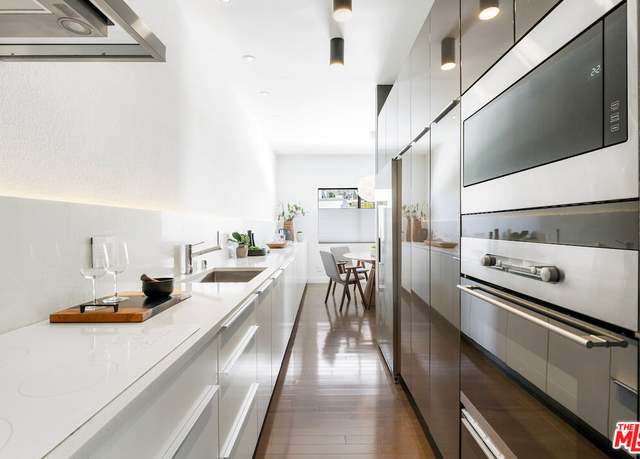
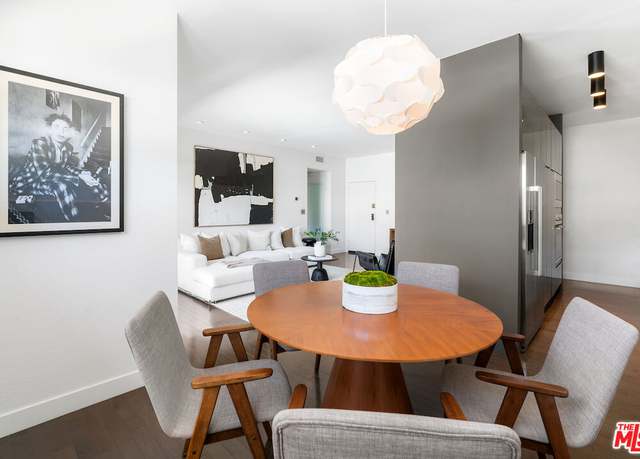
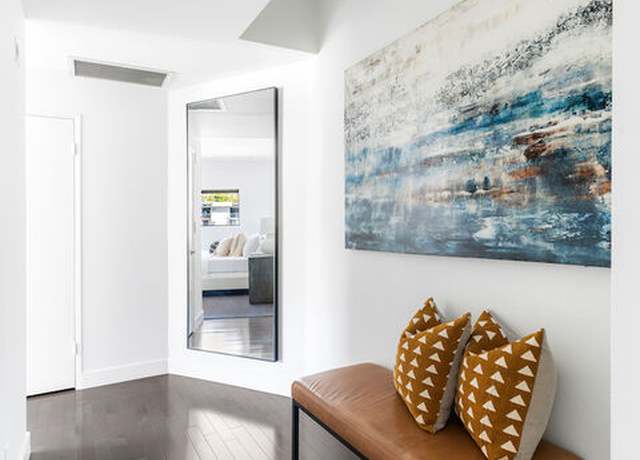
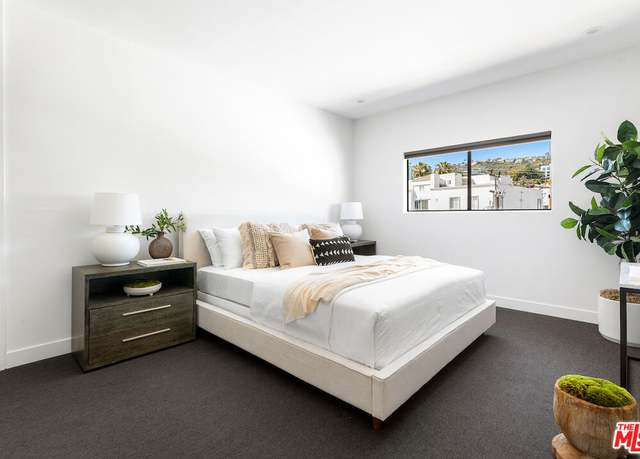
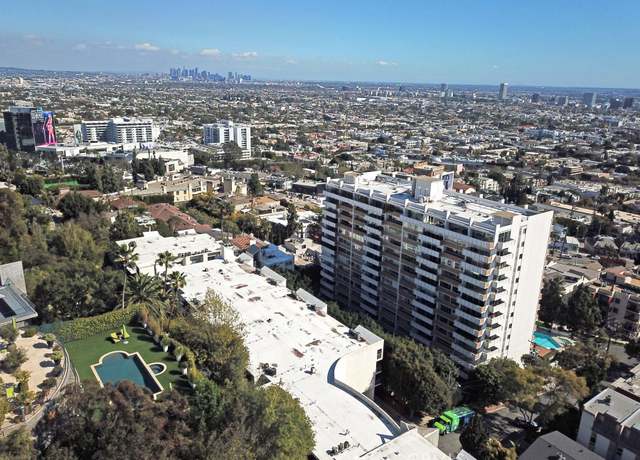
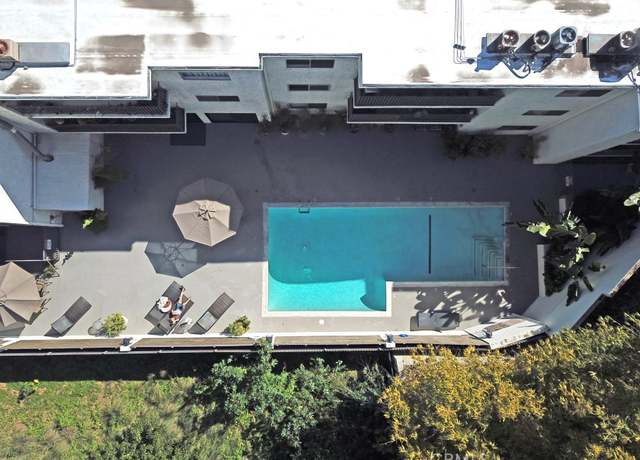
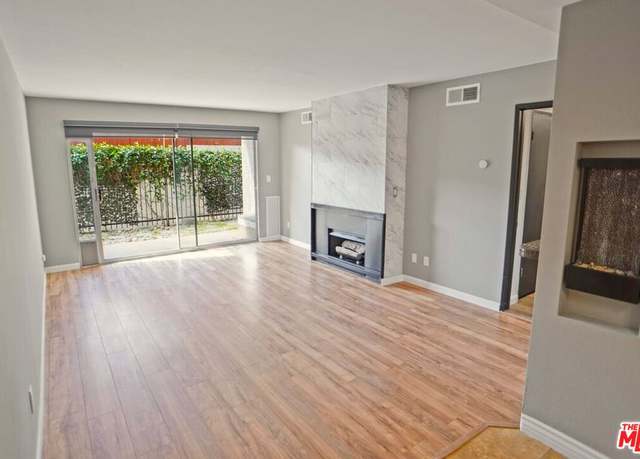
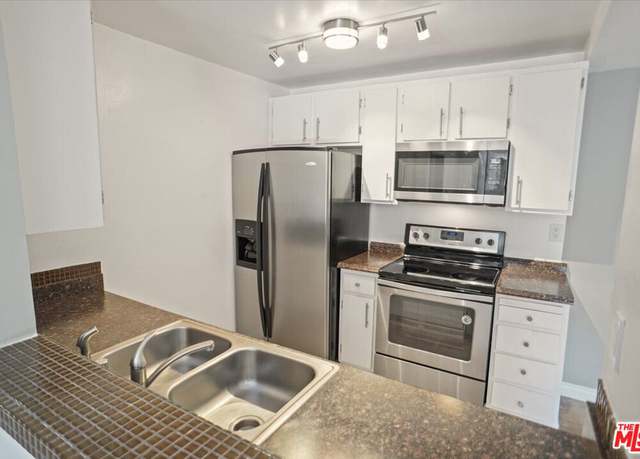
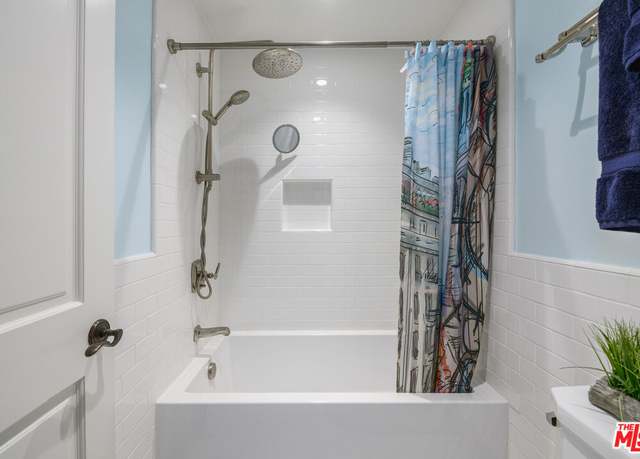
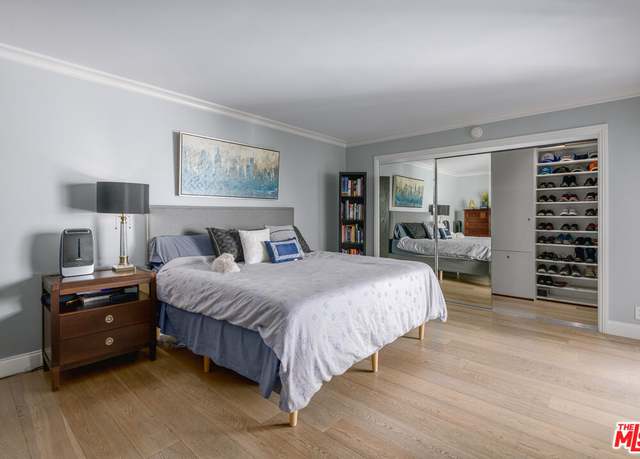
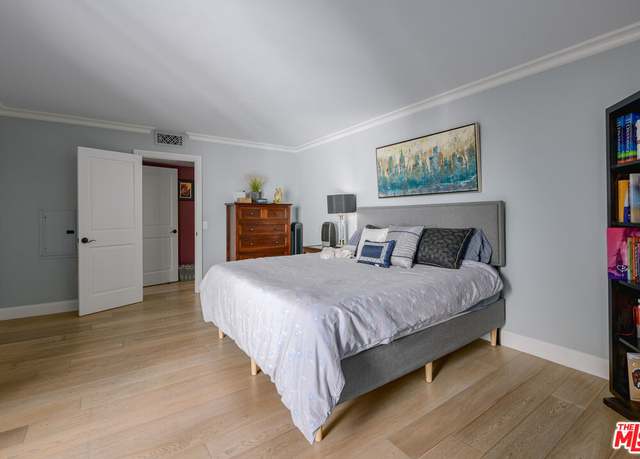
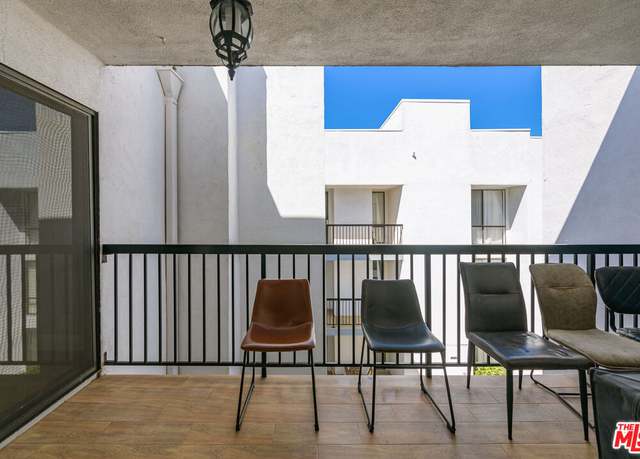
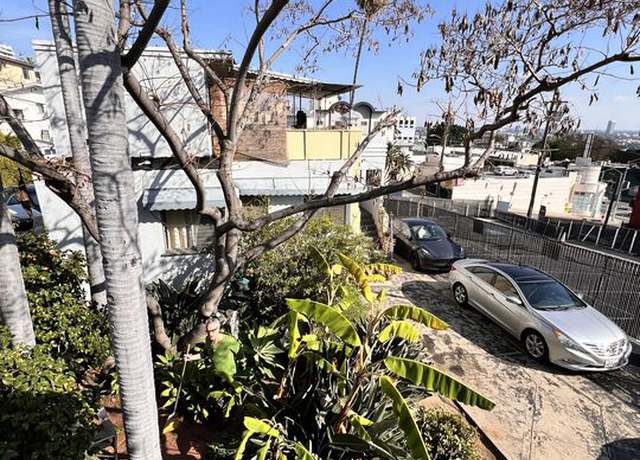
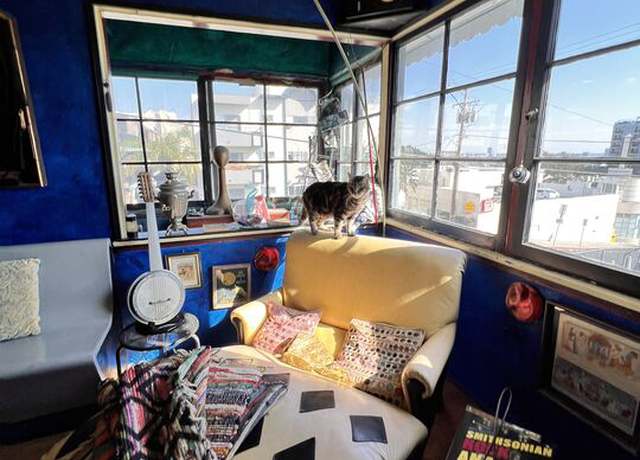
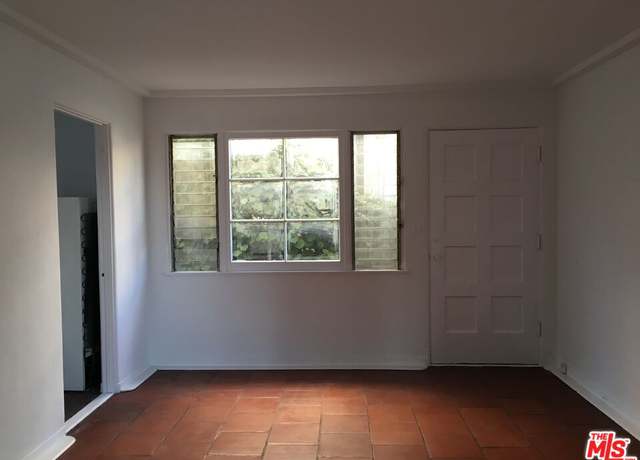
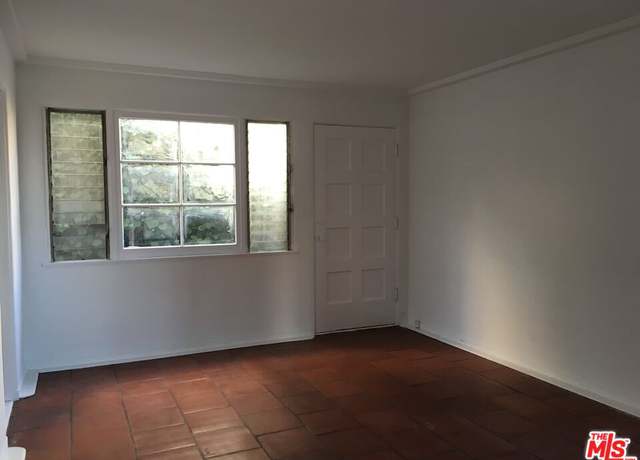
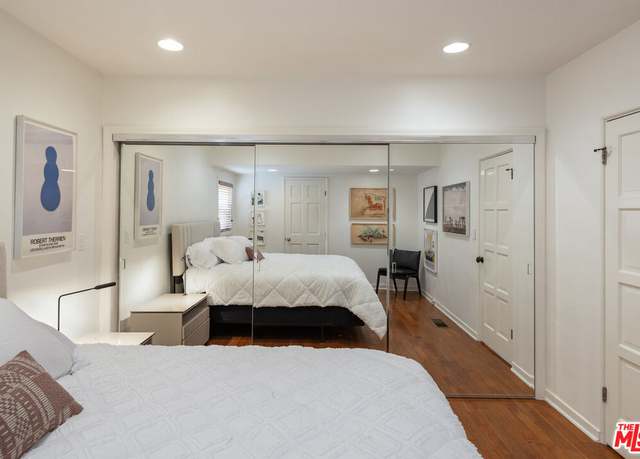
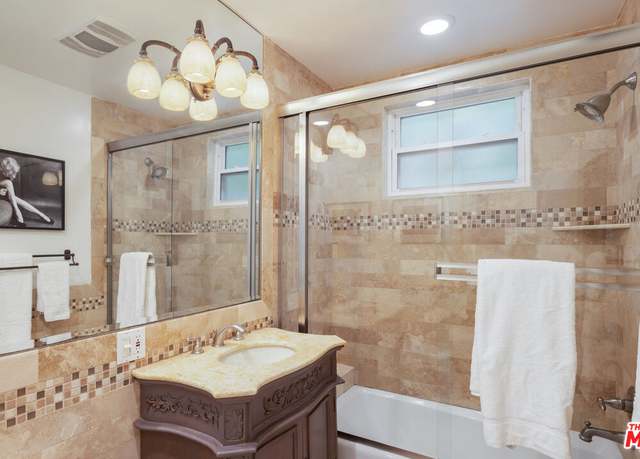
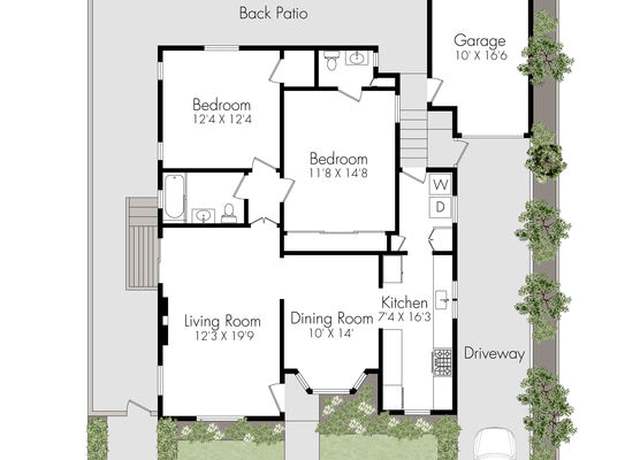
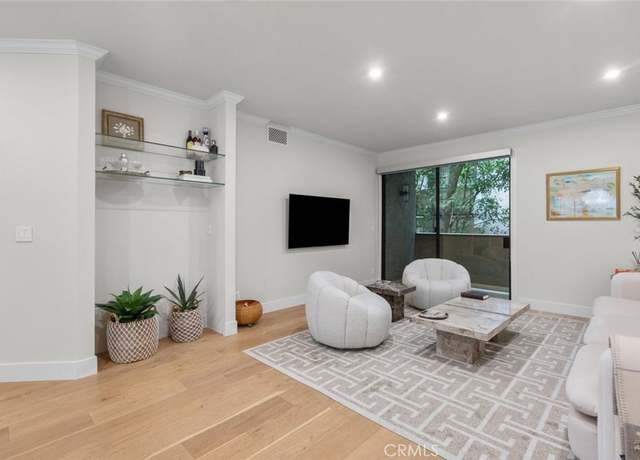
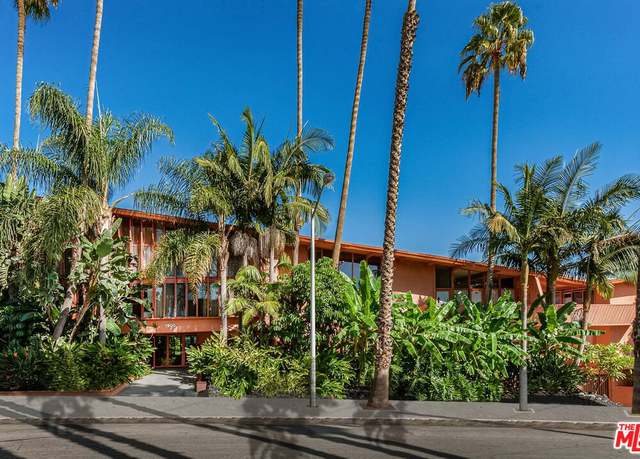
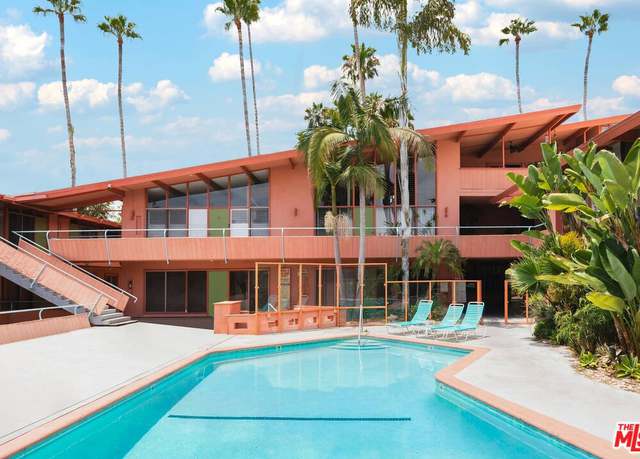
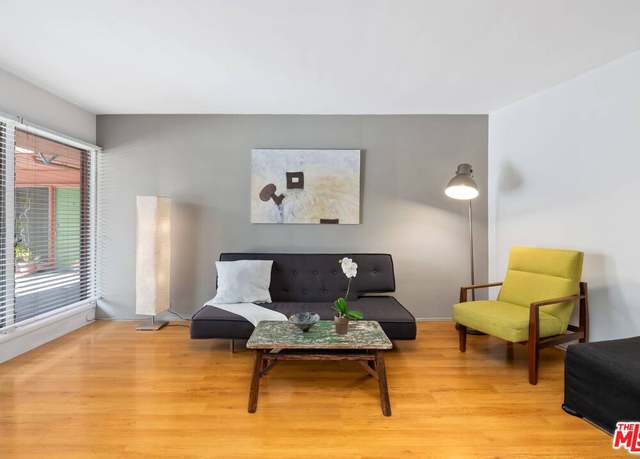
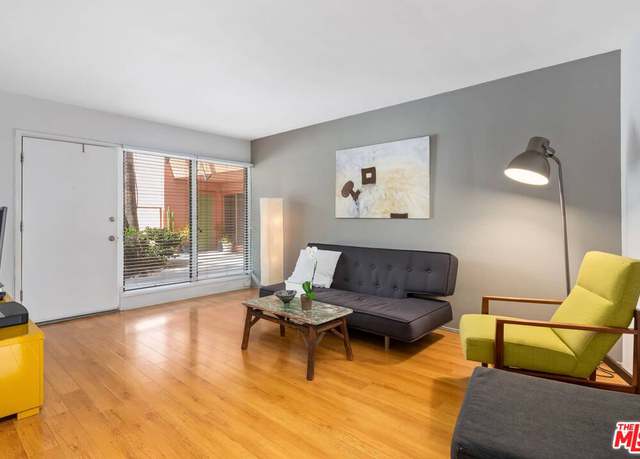
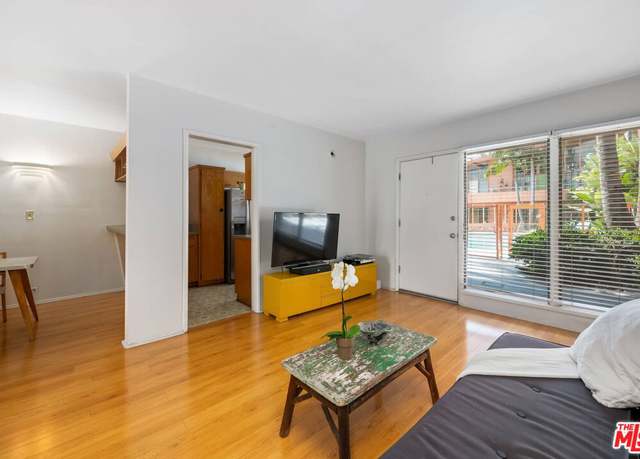
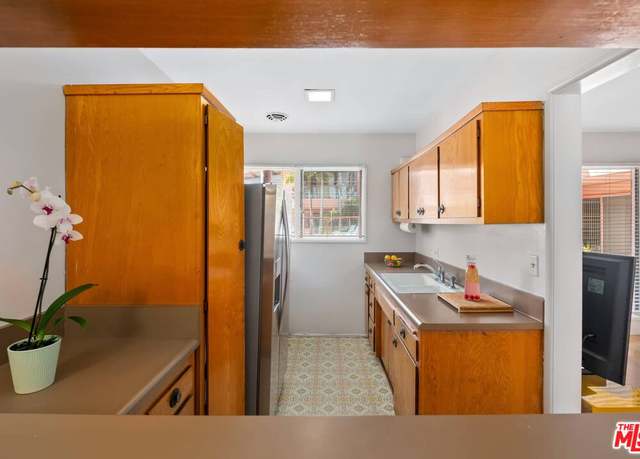
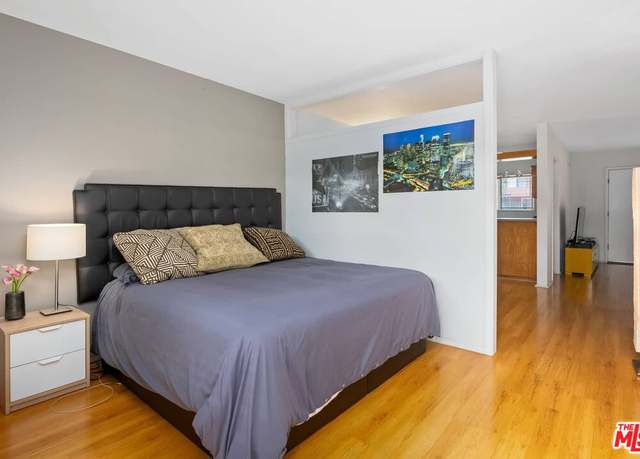
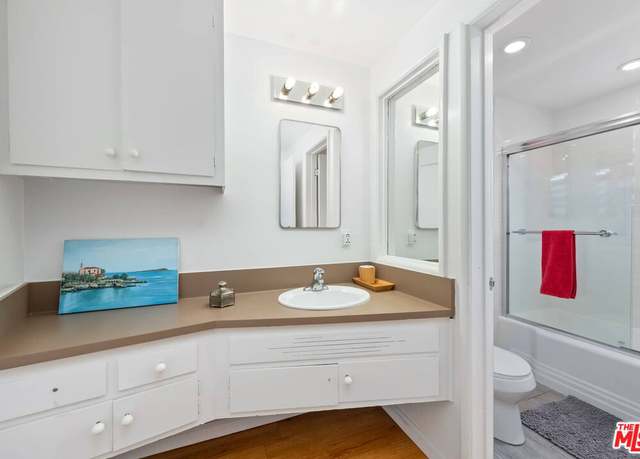
1/27
$630,000
1 bed1 bath714 sq ft
1230 N Sweetzer Ave #211, West Hollywood, CA 90069
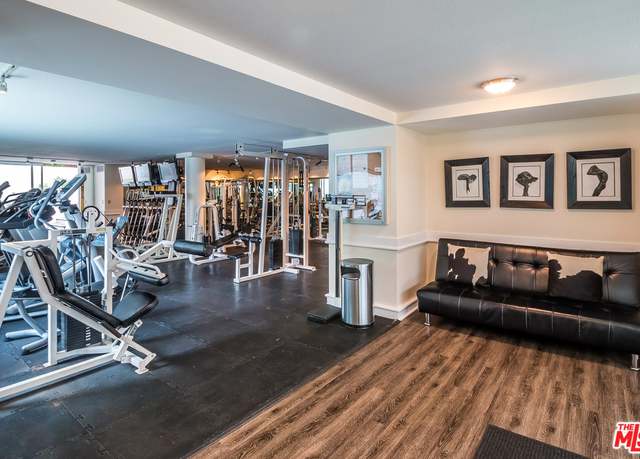
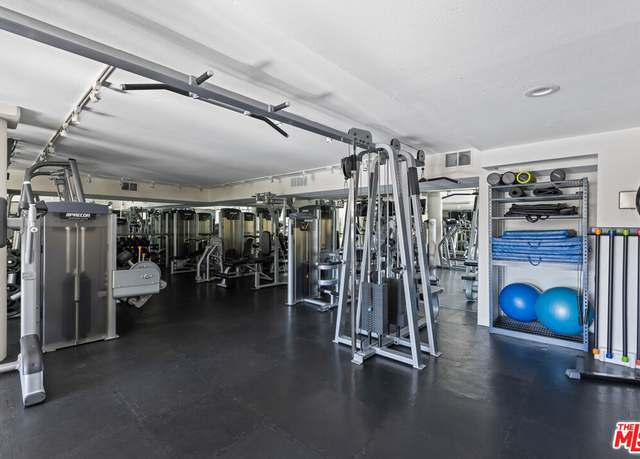
Discover upscale living in West Hollywood's sought-after address. This exquisite 2-bedroom, 2-bathroom condo is a perfect blend of luxury and convenience, offering an open layout with abundant natural light, hardwood floors, and high ceilings, ideal for both relaxation and entertaining. The chef's kitchen is equipped with high-end appliances, quartz countertops, and custom cabinets. The elegant bedrooms feature a master suite with a walk-in closet, soaking tub, and dual vanities, alongside a versatile second bedroom. Step out onto the private balcony for breathtaking city skyline views, perfect for relaxing or dining outside. Residents enjoy premium amenities including a rooftop pool, fitne
Chic Urban Retreat in the Heart of West Hollywood. This 1-bedroom, 1-bathroom condo offers the perfect blend of modern sophistication and urban convenience. As you step inside, you'll be greeted by an inviting open-concept living space bathed in natural light. Large dining room for dinner parties. Chef's kitchen with Sub Zero refrigerator and newer appliances. Bedroom has two large walk in closets. Bathroom has shower and tub. Great living in West Hollywood.
1/11
$559,000
1 bed1 bath941 sq ft
1124 N La Cienega Blvd #203, West Hollywood, CA 90069
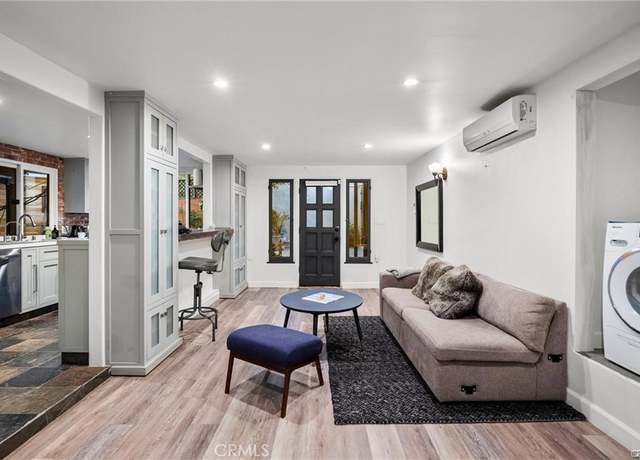
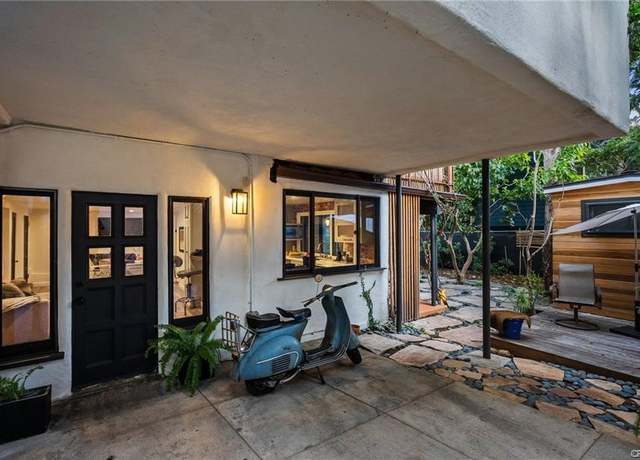
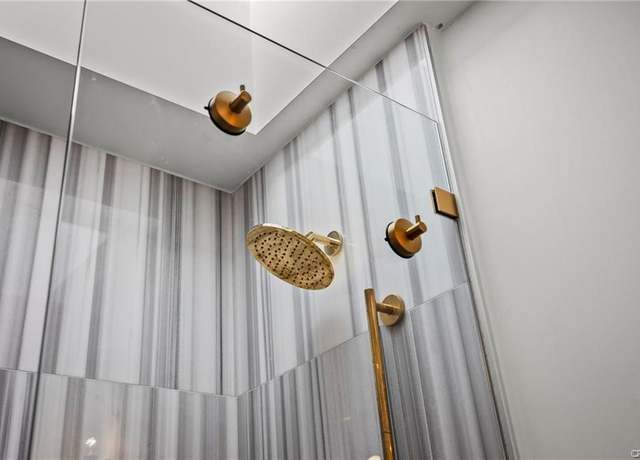
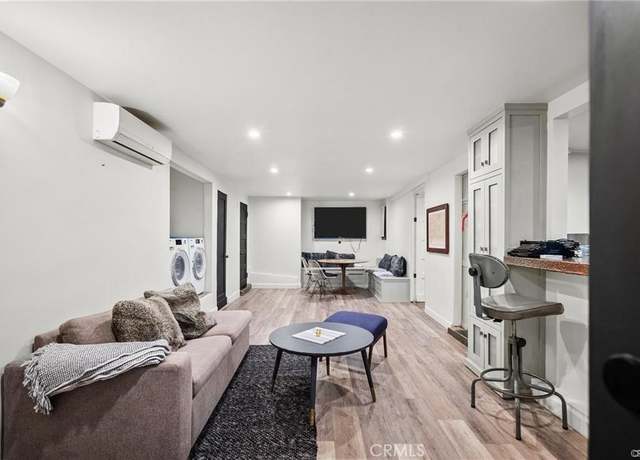
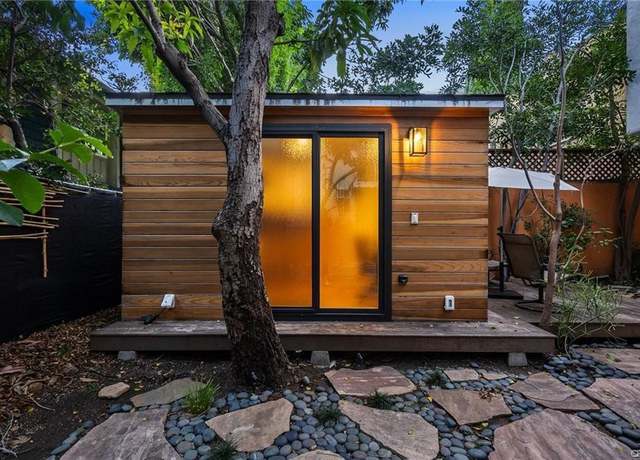
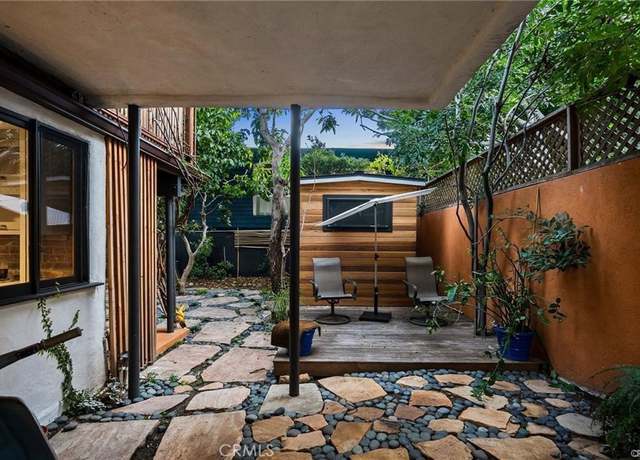
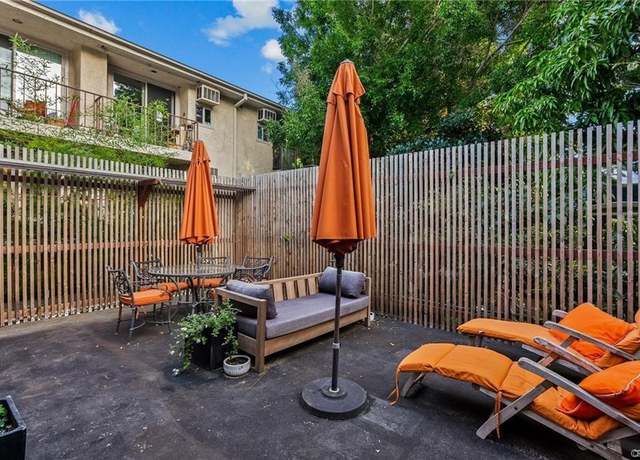
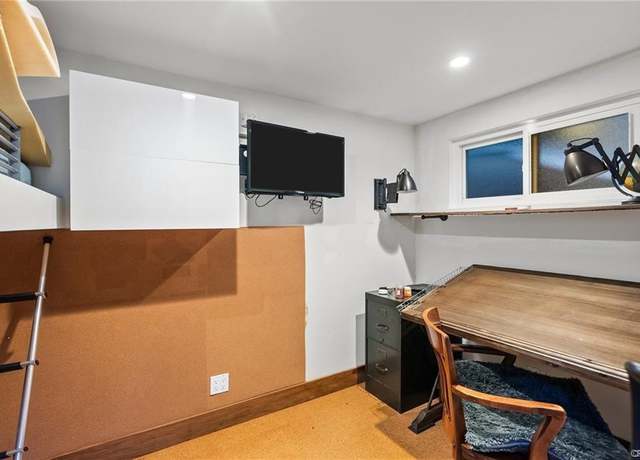
Superb prime real estate opportunity located off the highly sought after Sunset Strip featuring 1747 sq feet of living space. This move-in ready, dual level duplex residence has 4-bedrooms, 3-bath complete with a large yard, outdoor terrace, and front patio. Newly remodeled interior features a nice sized kitchen with open concept living and dining areas. Includes recently added detached bonus work space within the large hidden private garden. Has off street parking for two vehicles. Great short term and long term rental income opportunity. Nestled in between iconic Sunset and Santa Monica Blvds. , and steps away from the London, Sunset Marquis, & Petit Ermitage Hotels, world-class rest
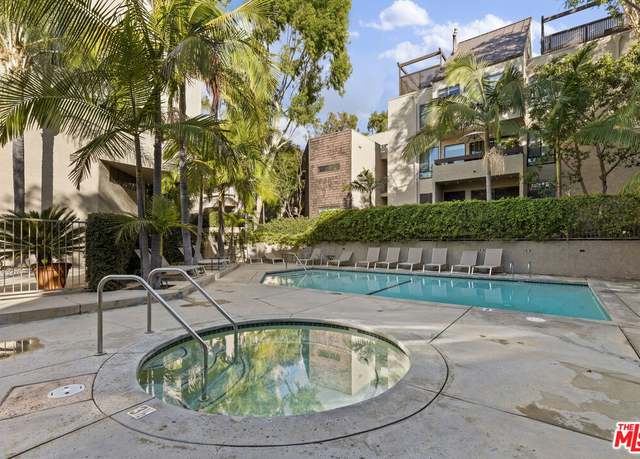
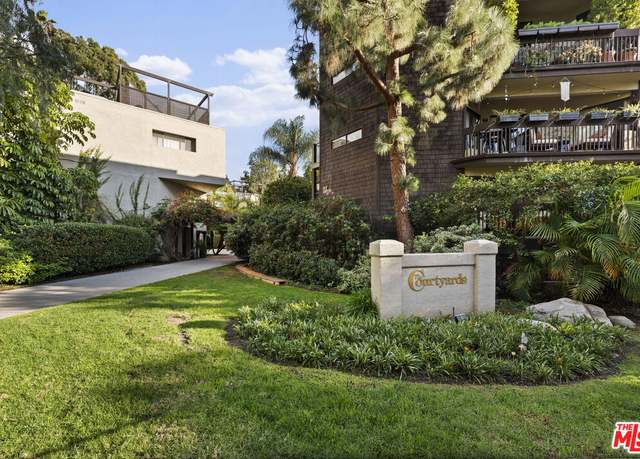
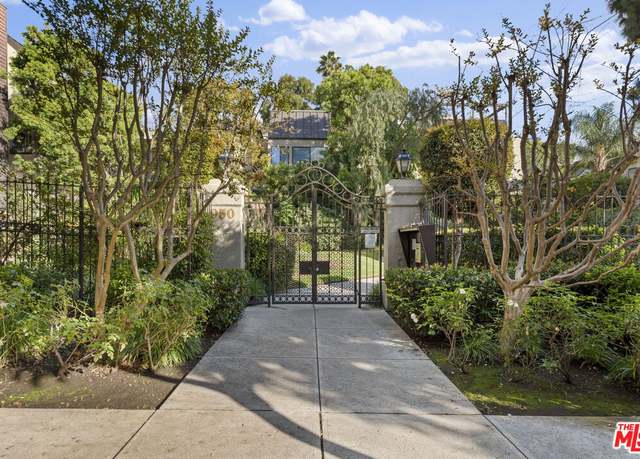
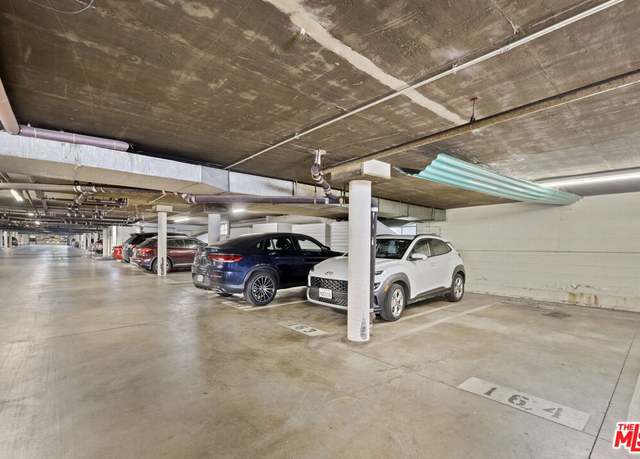
Great opportunity to live in a bright spacious unit at the highly sought-after Courtyards complex within the vibrating heart of West Hollywood. Spanning on 944 sf, this condo develops the perfect floor plan with 2 bedrooms having their own respective en-suite bathroom, located in separate sides of the unit which offers privacy and comfort for each of them. The living room features an abundance of light through the up-to-ceiling windows surrounding the sliding doors, gas fireplace and luxurious vegetation view. The unit comes with a large private balcony facing Kings Road opening on luxurious treetops and sky view. The sophisticated and colorful kitchen offers spacious marble countertop, bar
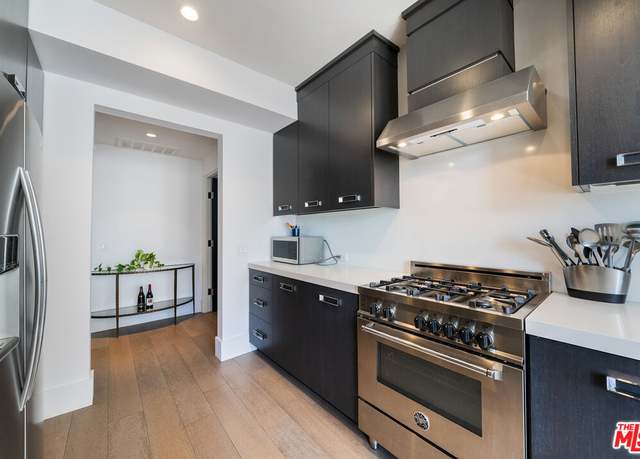
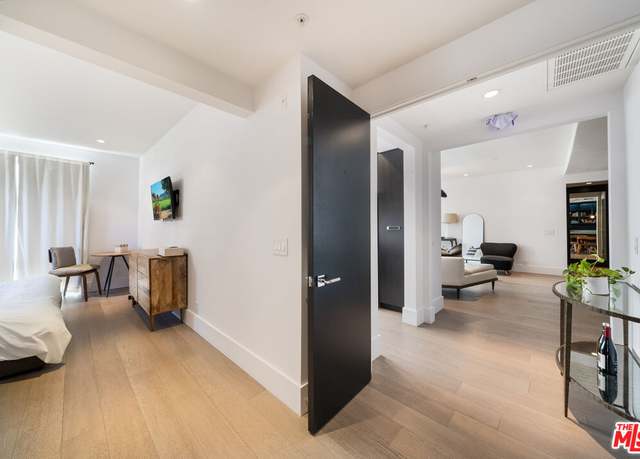
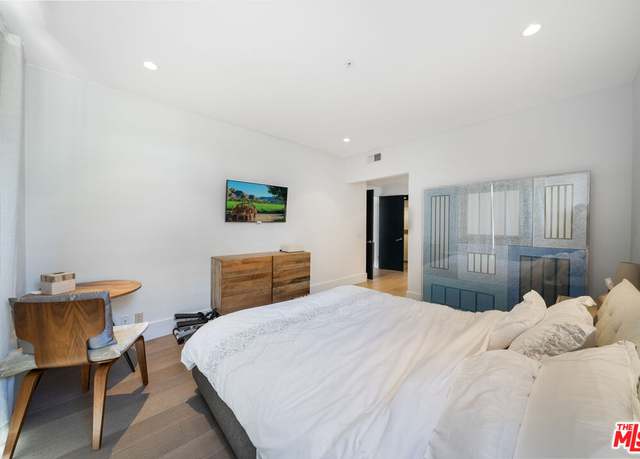
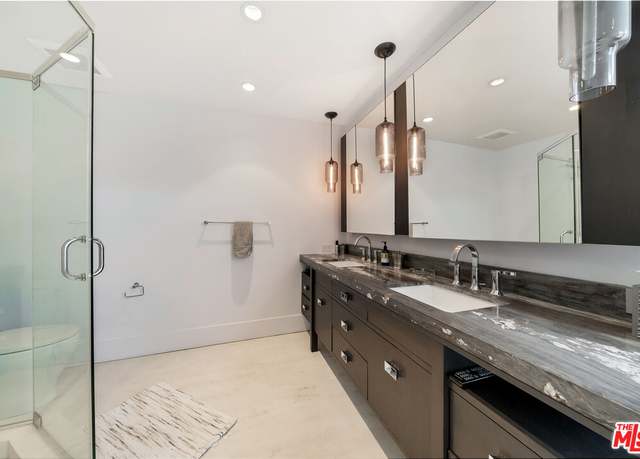
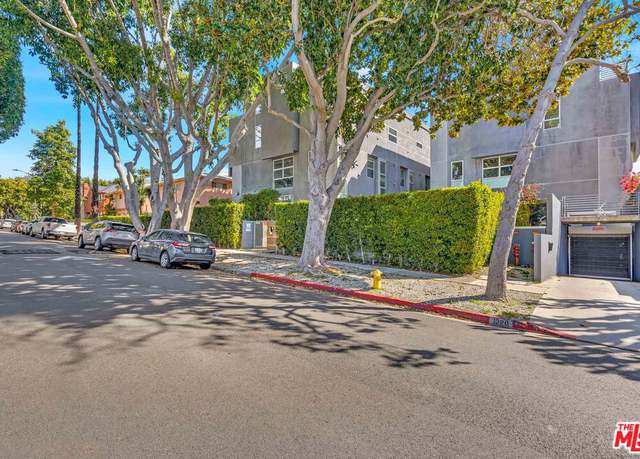
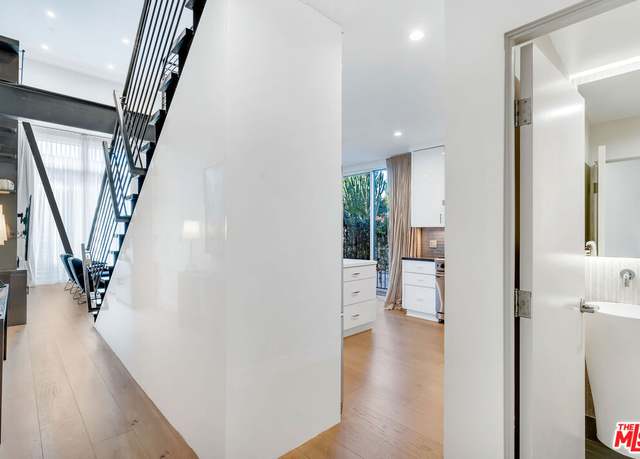
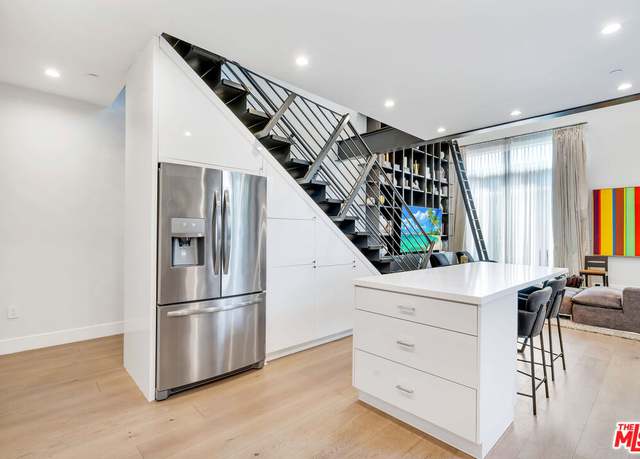
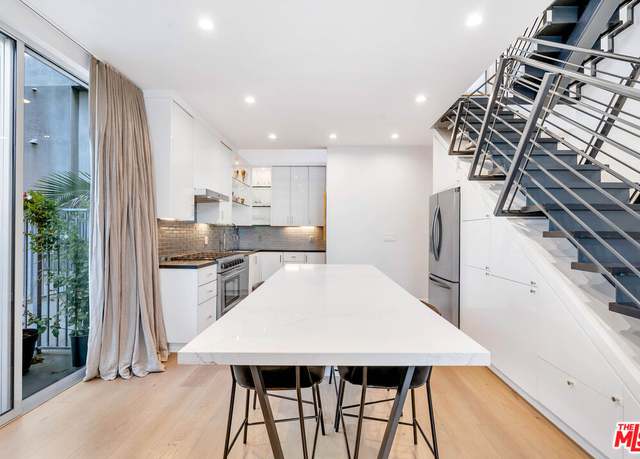
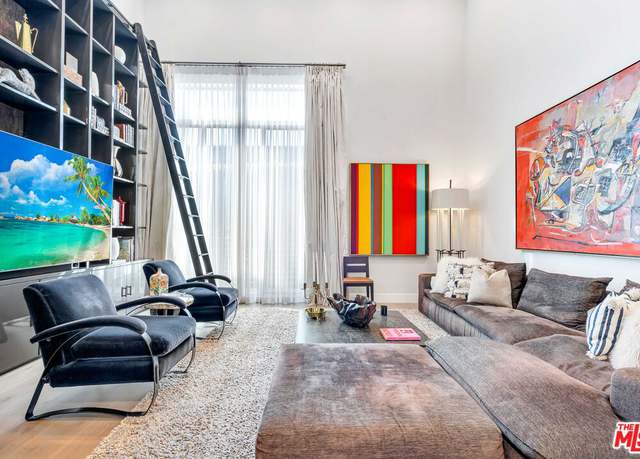
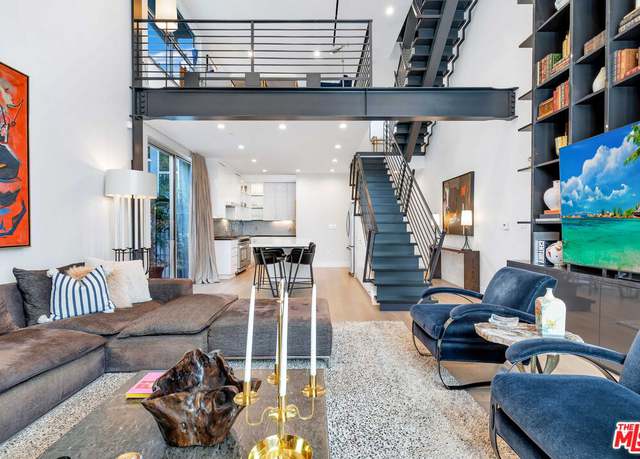
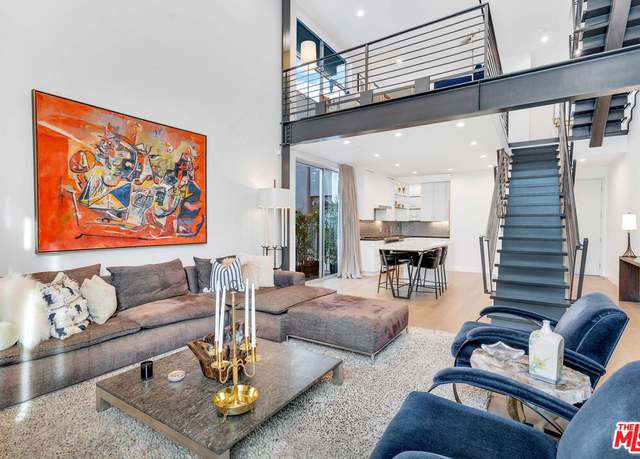
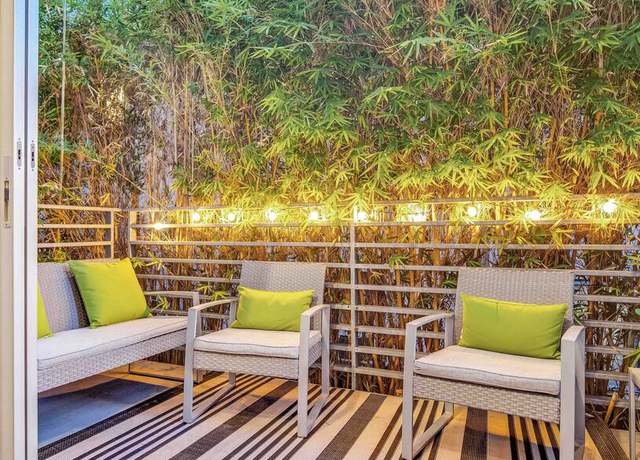
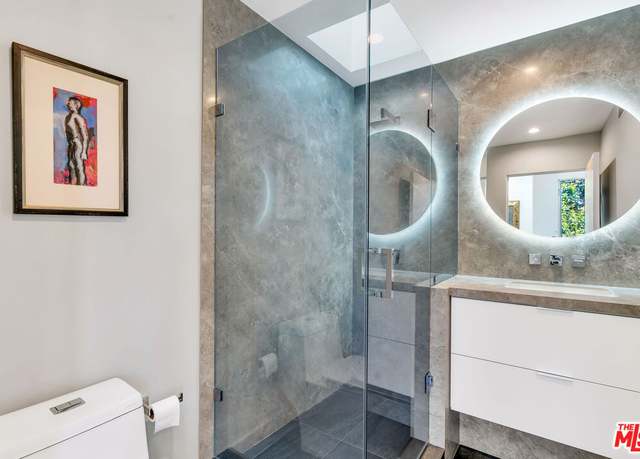
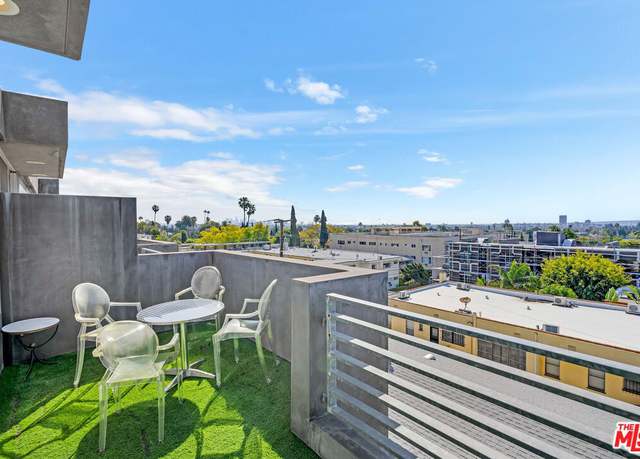
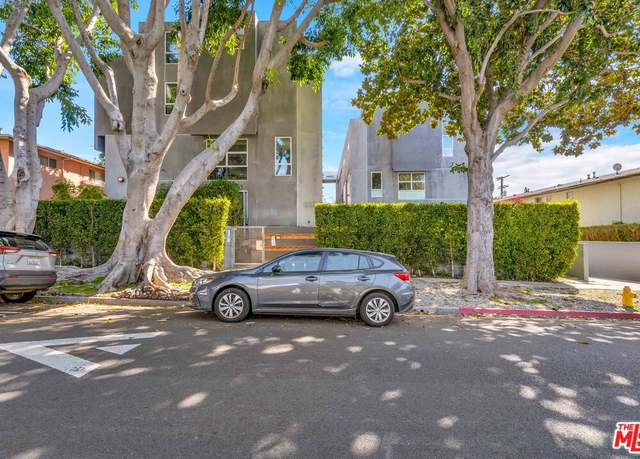
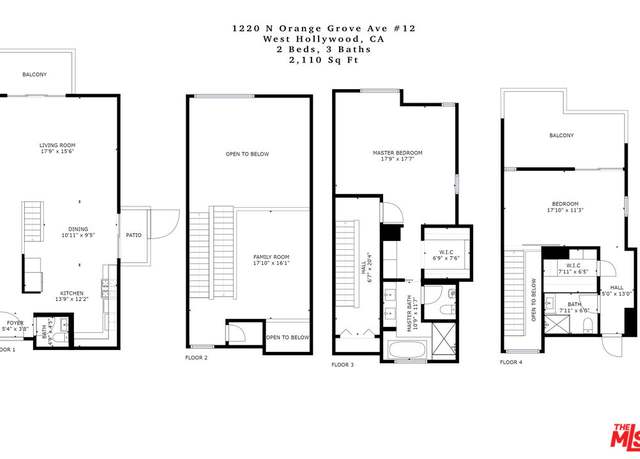
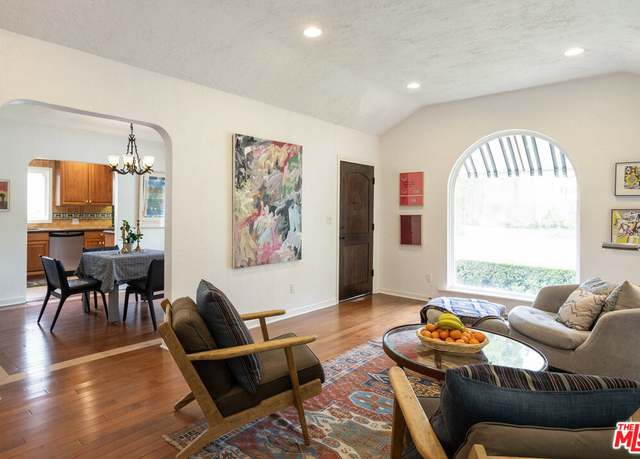
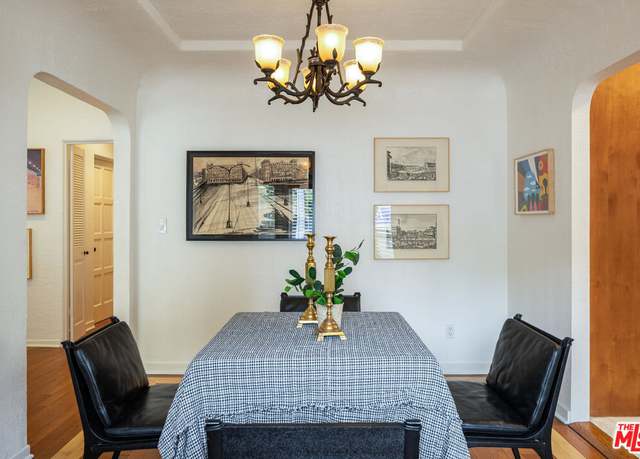
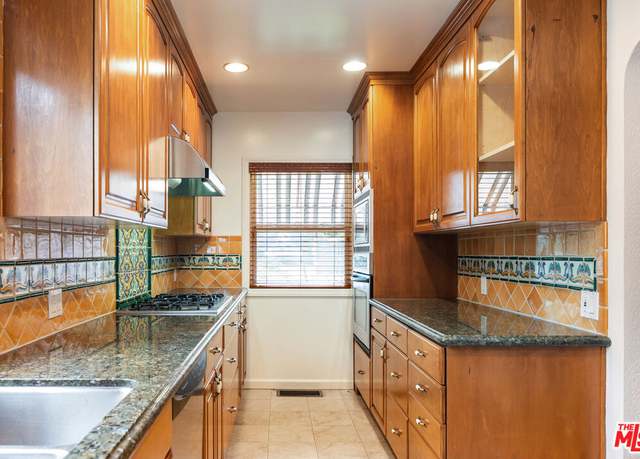
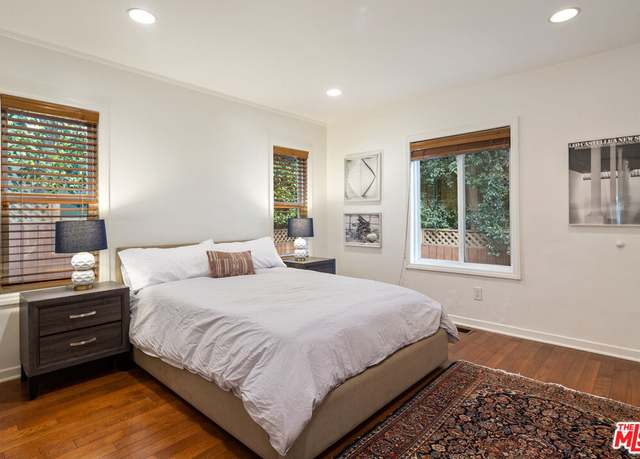
Nestled in prime West Hollywood, 1220 N Orange Grove #12 boasts a modern loft-style townhouse, epitomizing contemporary luxury living. Stepping inside, you're greeted by an open flow corner unit, the largest in the building, with only one common wall. This unique layout offers privacy and space, making it the gem of the complex. Impeccably designed with top-of-the-line surfaces and fixtures, this home exudes sophistication and elegance. Recent upgrades to the bathrooms, kitchen, flooring, and painting elevate its appeal, ensuring it stands out as the best in the neighborhood. The heart of the home lies in the designer kitchen that has granite and quartz counters, a new Thor 6 burner gas ran
1/57
$1,795,000
2 beds2.5 baths2,110 sq ft0.34 acre (lot)
1220 N Orange Grove Ave #12, West Hollywood, CA 90046
You can't beat the location of this sunny one-bedroom, one-bathroom condo nestled in the coveted Norma Triangle! Top floor, corner unit with hardwood floors, open floor plan, newly remodeled kitchen with stainless steel appliances, updated bathroom, recessed lighting and sizable private storage locker. When you're not grabbing a coffee at Dialog Cafe or BBCM, perusing the shelves of the iconic Book Soup, lunching at Bottega Louie, or enjoying an evening out at The Abbey, you can relax and get some sun at the community pool and jacuzzi. Located just one short block from the world famous Sunset strip and minutes to Beverly Hills and Melrose, you'll find upscale dining and shopping in every d
A great opportunity to own a unique condo with an open layout that seamlessly connects the living, dining, and kitchen areas, creating an ideal space for both relaxation and entertainment. The perfect space to unwind with two spacious primary bedrooms, each complemented by its own en-suite bathroom for ultimate comfort and privacy. The two bedrooms are conveniently located on opposite ends of the condo, each with their own walk-in closet as well as their own private balconies that overlook the pool area. A spacious living room with wet bar, tons of natural light, oversized kitchen, laundry inside, and large balcony make up this great unit! Residents of this building enjoy a host of amenitie
Recent upgrades include full paint, all new recessed lighting, new bathroom fixtures. Exceptional Large (almost 1000 SQFT), bright, modern top floor unit located in the heart of West Hollywood, near cafes, gyms, boutiques, Gelson's and more! This wonderful unit has huge living room and dining area with a fireplace, new central heat & air, recessed lighting, a wet bar with Quartz counter top & faucet, lots of closet space & a walk in closet in bedroom. The kitchen has an eating area, Quartz counter tops. The bathroom has double sinks, separate tub & shower stall, newer Granite counter tops and tile. The building has E/Q insurance and is well maintained with pool and s
A condominium unit with views as far as the eye can see, mere steps below the Sunset Strip, in a full-service luxury hi-rise building is finally making its debut. You'll preside over the corner of La Cienega and Fountain, as you are greeted by morning sunshine from the east, which filters through the sliding doors to your balcony, illuminating the best of West Hollywood and reminding you why you live in this exciting and vibrant city. Enjoy morning coffee or happy hour on your balcony, which offers a 180-degree view of the beautiful landmarks across Los Angeles. As dusk fades into nightfall, the glimmer of the city lights twinkle while the sun sets and you're ever thankful that everything y
1/55
$699,000
1 bed1 bath798 sq ft
1155 N La Cienega Blvd #411, West Hollywood, CA 90069
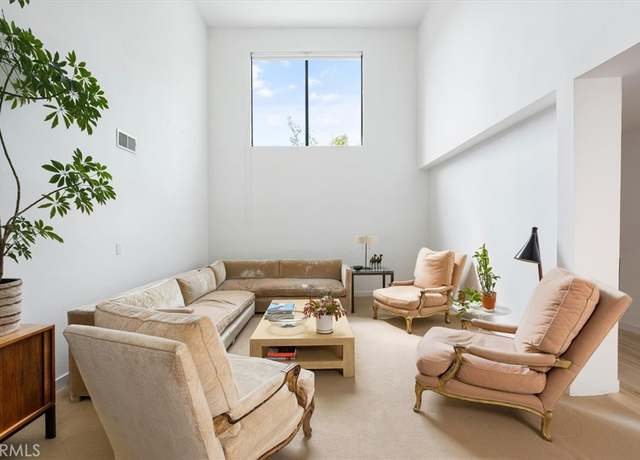
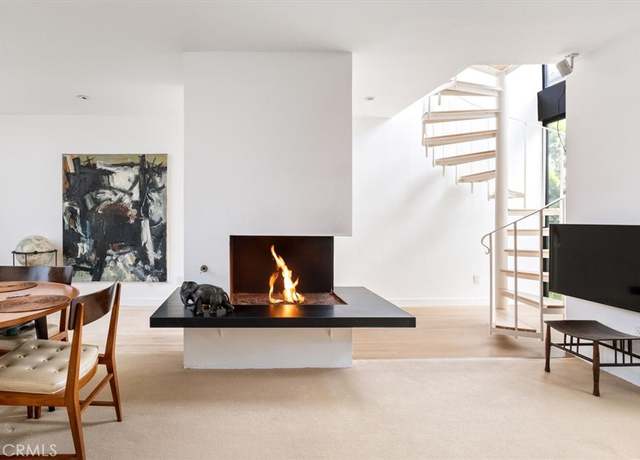
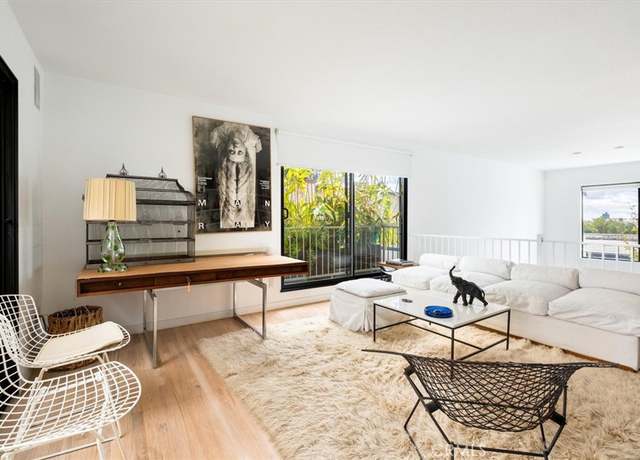
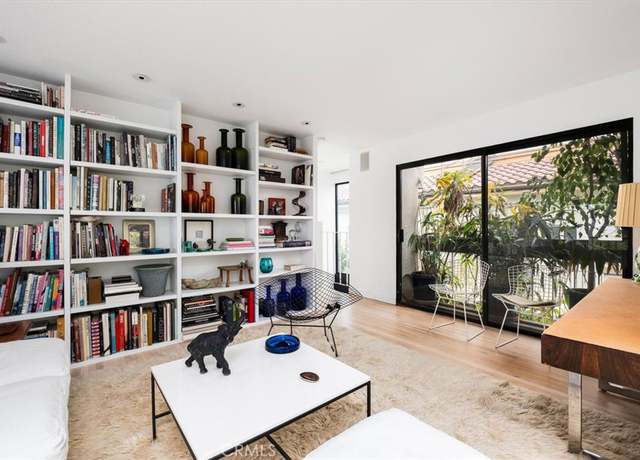
Discover a rare architectural gem in the heart of West Hollywood - a top-floor penthouse that redefines modern luxury. With dramatic soaring ceilings, this 2-bedroom, 2-bathroom unit boasts a loft and den, offering versatile spaces for work and relaxation. Light, bright, and airy, this special unit features a living room with open corner fireplace, dining area, primary suite, second bedroom and bathroom, laundry room, and separate service entrance. With only one common wall and generous closets, exclusivity and comfort are paramount. Nestled within an intimate condominium building, tranquility awaits in the open-air Zen-like atrium with lush landscaping. Experience an urban retreat with pro
1/24
$1,250,000
2 beds2 baths1,701 sq ft
909 Sierra Bonita Ave #311, West Hollywood, CA 90046
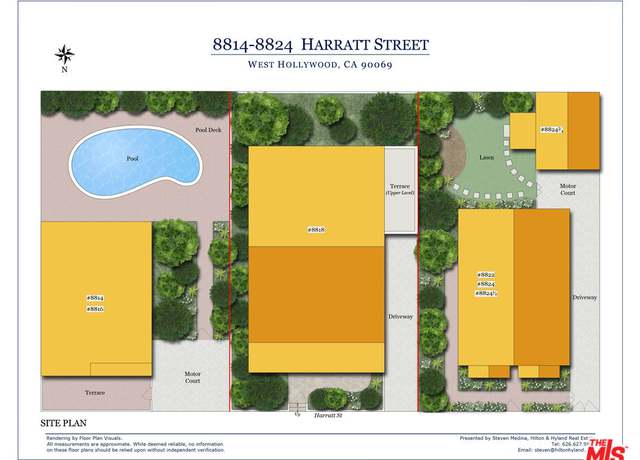
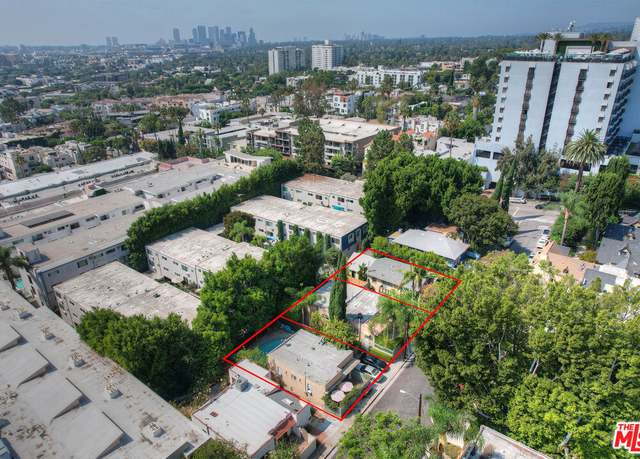
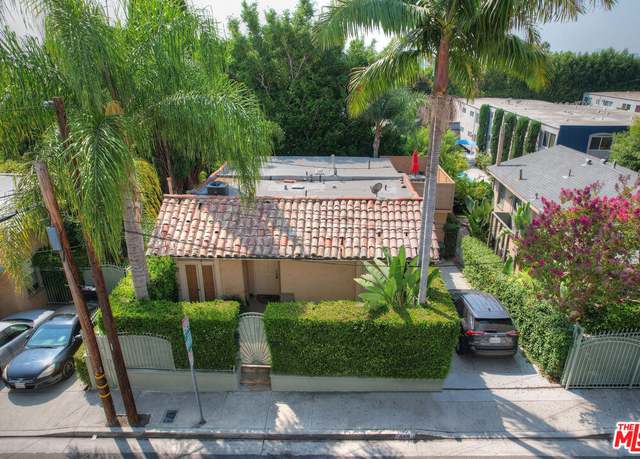
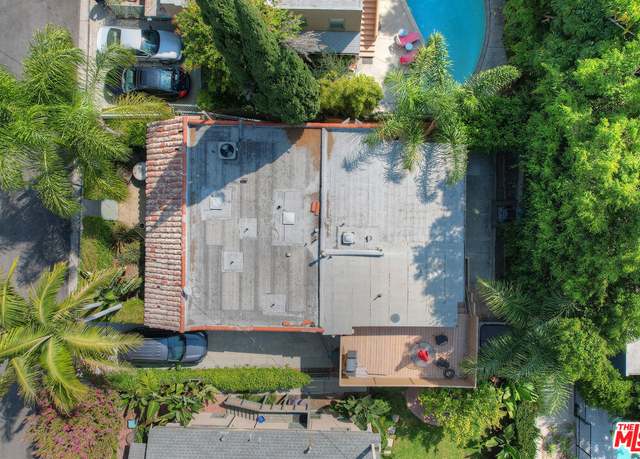
Parcel 2 of 3 - to be sold in conjunction with 8814 Harratt St & 8822 Harratt - prime offering of 3 contiguous lots! Great opportunity for the most discerning of buyers, whether it be the developer or investor. Each lot is zoned WDR4 * . (Tenant Occupied) 8818 Harratt St: Singe Family Home - Immaculate two story 3 bed / 3.5 bath, gated and private Spanish home located in the heart of West Hollywood. This home offers formal living / dining, quality finishes, lighting & designer bathrooms & kitchen with top of the line appliances. Additional features include a front patio & large sun deck. Downstairs offers a private bed/bath as well as a den/office or fourth bedroom a
1/17
$4,995,000
7 beds5.5 baths— sq ft0.24 acre (lot)
8818 Harratt St Unit Combined, West Hollywood, CA 90069
Beaming with natural light, this newly constructed contemporary home, boasts just under 3,700SF of luxurious living space, offers 4 bed/4.5 bath and comes fully furnished. Enjoy a spacious open floor plan, designed with seamless indoor-outdoor living in mind - with large pocket sliding doors to an immaculate outdoor patio with spa and dipping pool. The chef's caliber kitchen offers a massive quart-side marble island and brand-new Thermador appliances. The second floor includes an expansive primary suite, 2 en-suite guest bedrooms, and a laundry room conveniently located central to all bedrooms. The residence elevator services all floors, and allows for easy access to the third level seconda
A top floor architecturally redone unit with magical views. Minimal yet warm design is achieved by use of thoughtful materials including a wall of storage extending from the kitchen across dining area. Enjoy the best of both worlds: a vibrant West Hollywood location, and a tranquil unit that is orientated toward a view of the Hills. Maple wood floors in pewter tone and accent volumes in both living and bedroom enhance the all-white setting. A galley kitchen that now has two access points feels European with functionally designed cabinets, Ceasarstone counters and wall mounted Whirlpool appliances. Adorne switches by Legrand have a contemporary square design and a snappy feel with dimmers th
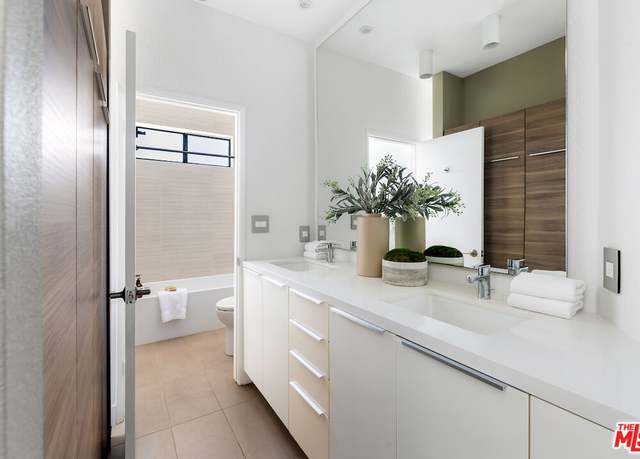
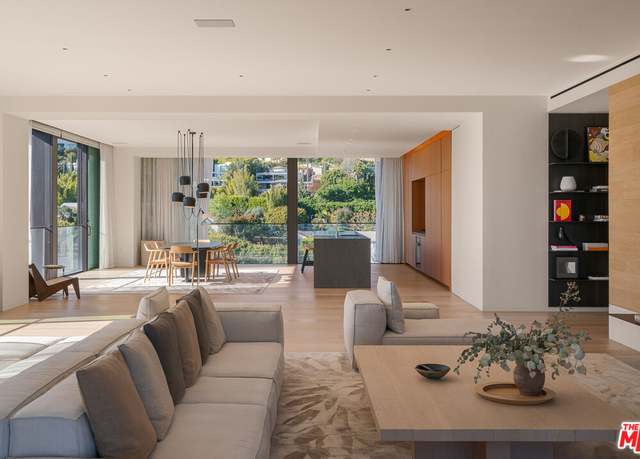
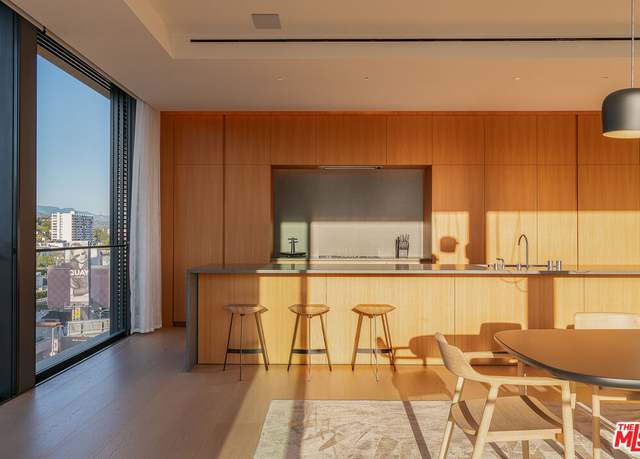
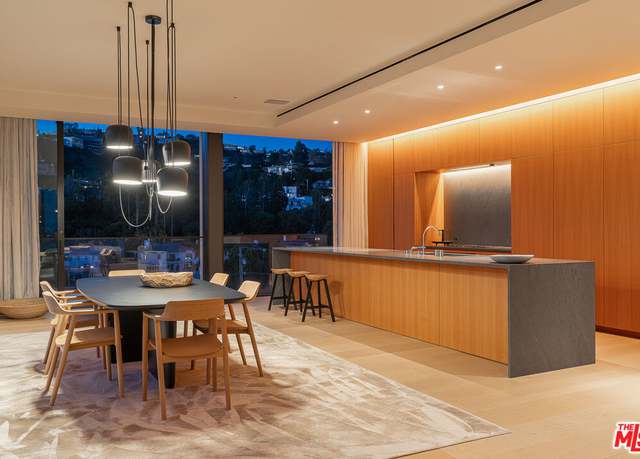
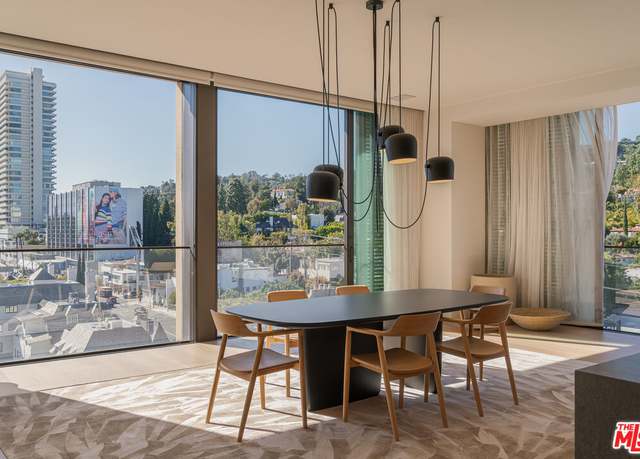
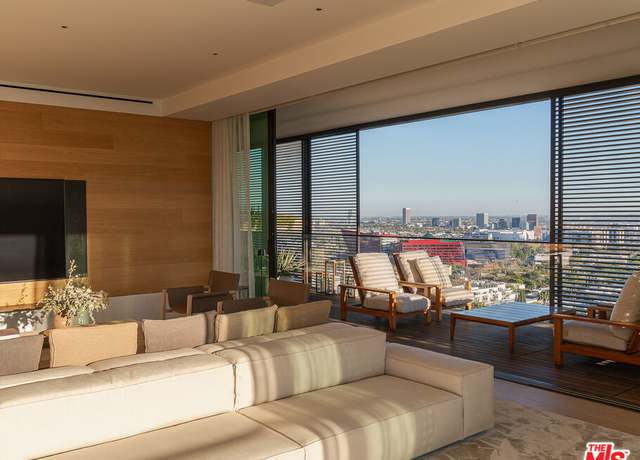
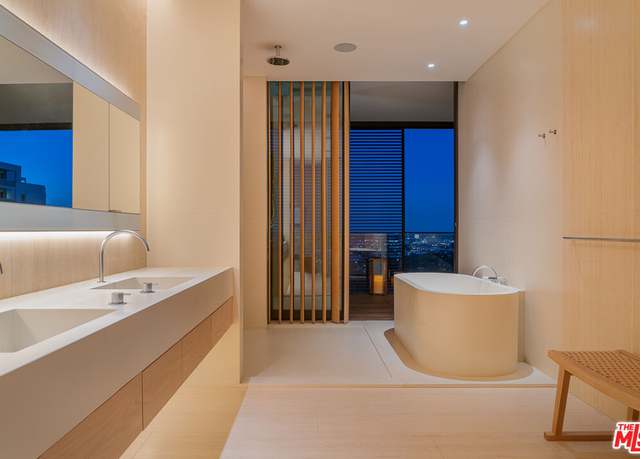
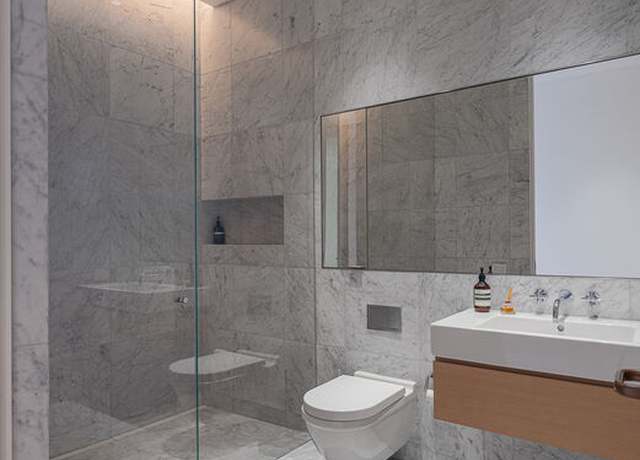
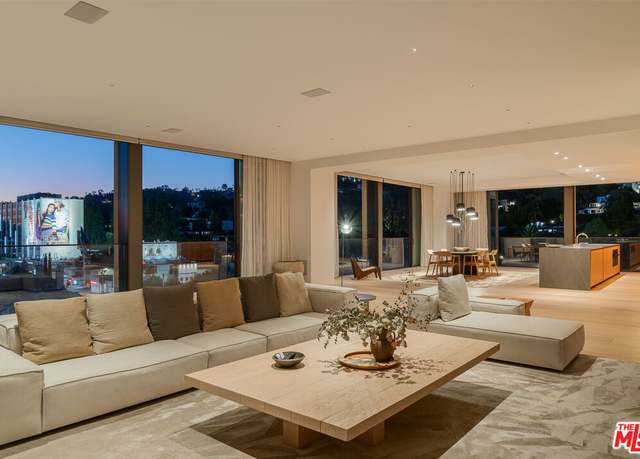
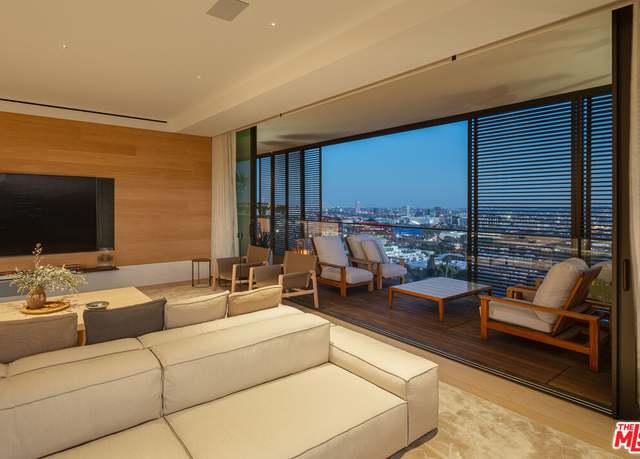
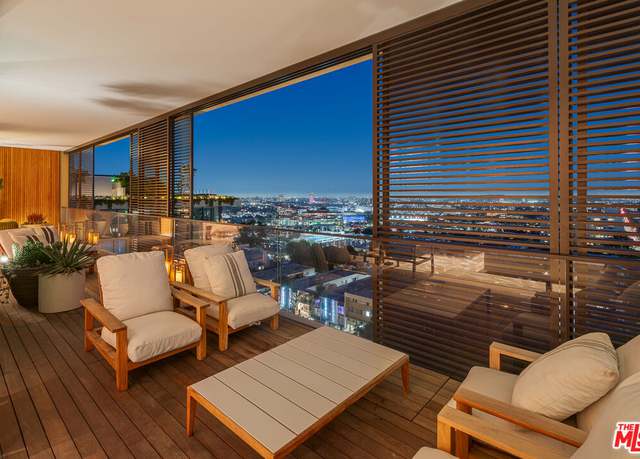
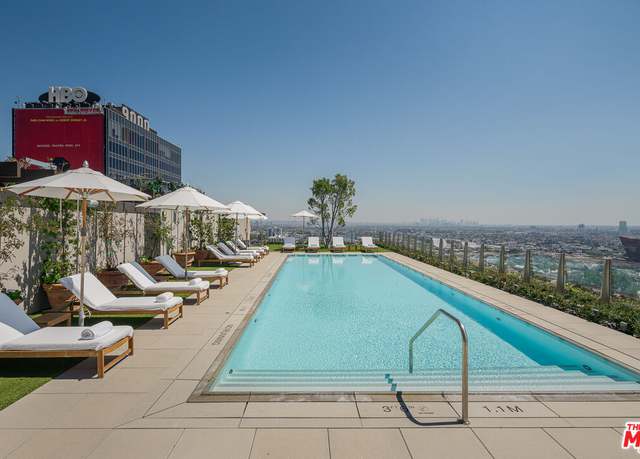
Created by renowned architect John Pawson, the Residences at The West Hollywood EDITION are inspired by the warm climate, golden light, and unique spirit of Los Angeles. This large unit, in which Indoor and outdoor living are elegantly intertwined, possesses 3 bedrooms, 3.5 bathrooms and sliding walls of glass with amazing panoramic views. The residents-only lobby and landscaped rooftop pool terrace both provide exclusive spaces and privacy as well as the undivided attention of dedicated staff. A full-service spa, a fitness center, valet parking, and in-residence dining are among many conveniences available to residents. It is authentic Los Angeles served up with a twist and a light touch i
1/30
$12,995,000
3 beds3.5 baths3,432 sq ft
9040 W Sunset Blvd #1001, West Hollywood, CA 90069
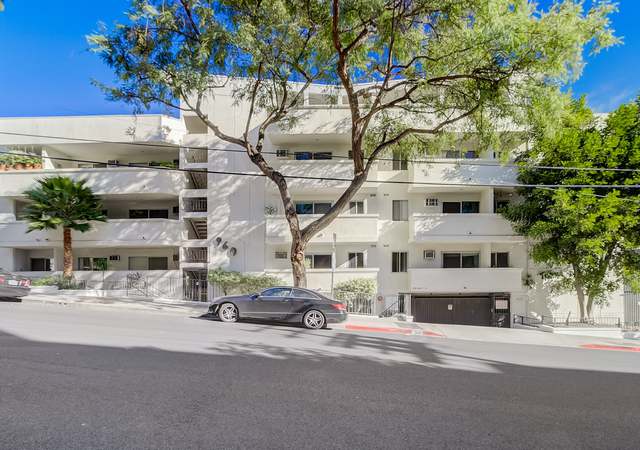
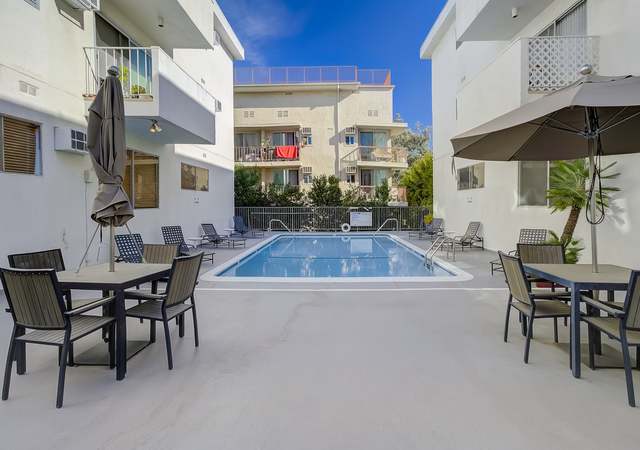
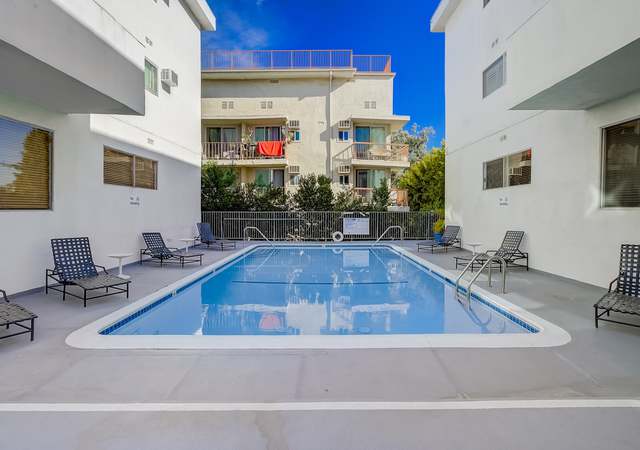
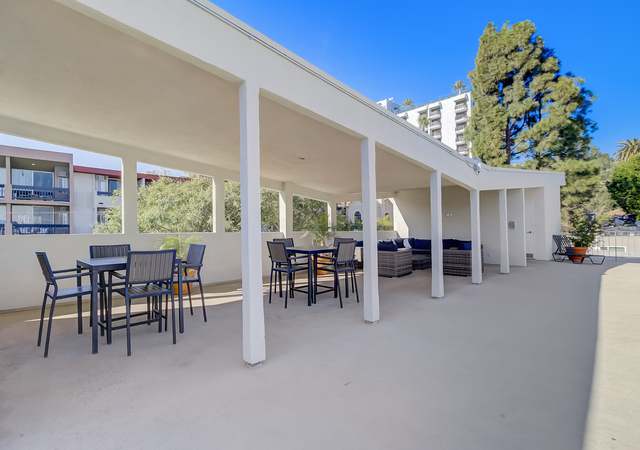
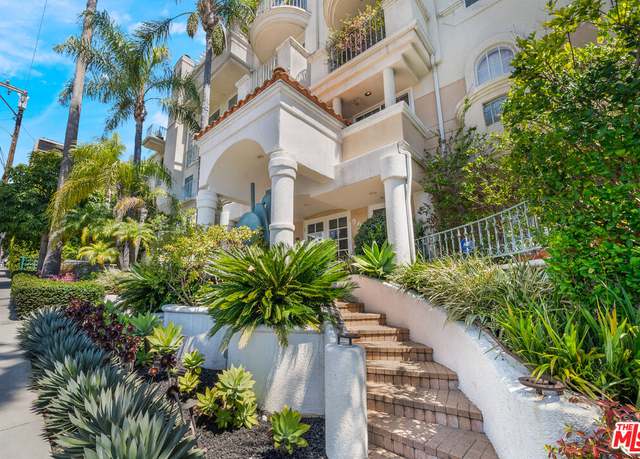
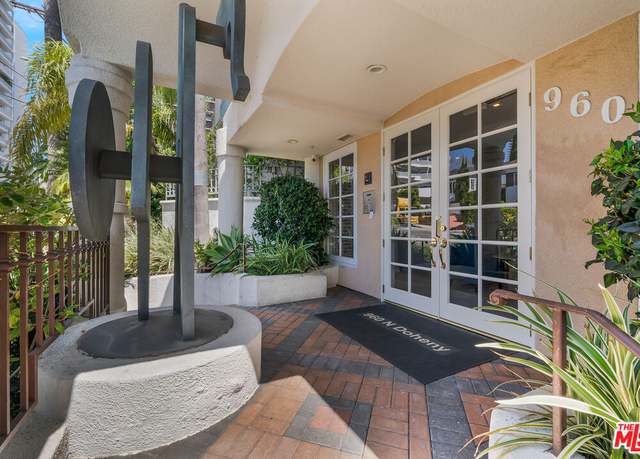
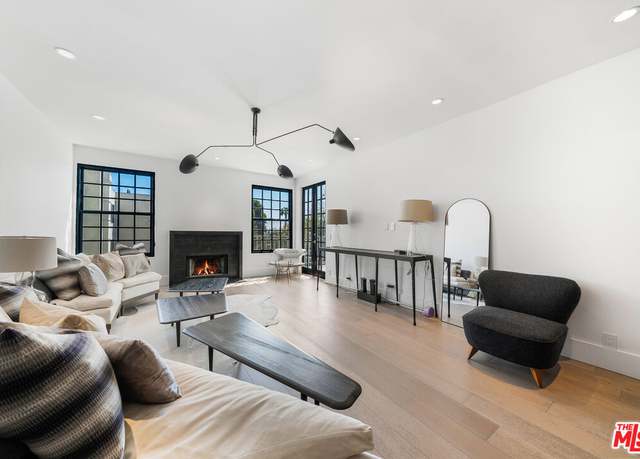
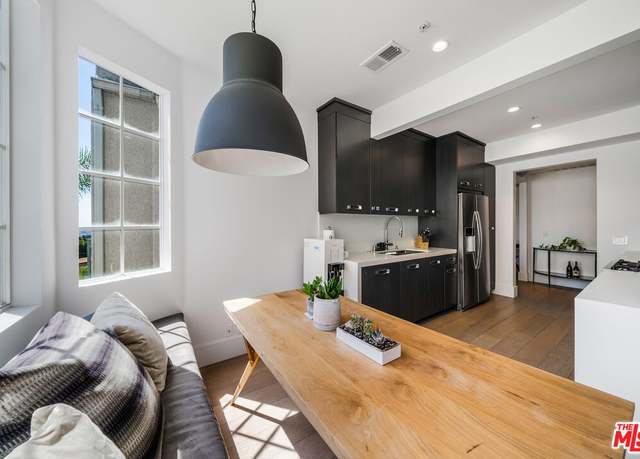
Located W. Hollywood's most sought-after neighborhoods. It is located at the back of the complex where it is quiet and private. Upon entering, you'll be greeted by an open-concept kitchen that exudes contemporary elegance. The striking sealed concrete floor is a game changer, is not green carpet, and is a must see! The unit has designer fixtures and floor-to-ceiling windows that brings in a ton of natural light creating a light and bright space. The modernized kitchen features stainless steel appliances, quartz countertops, and ample cabinetry for all your culinary needs. The layout is designed to optimize space and functionality, and seamlessly connects the living room, dining area, and ki
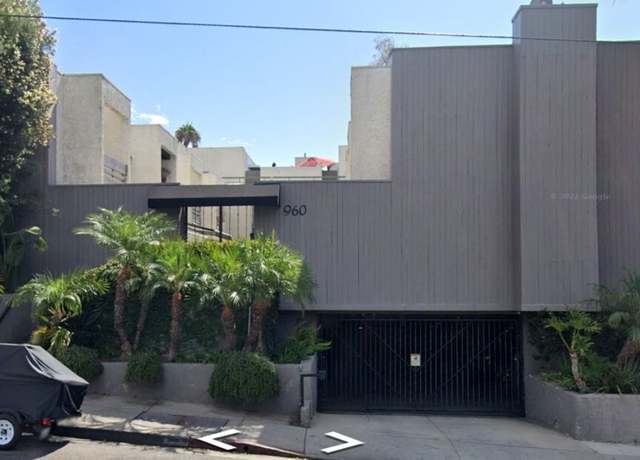
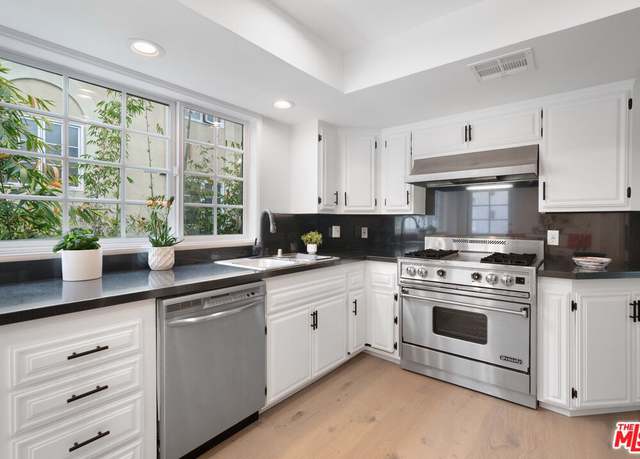
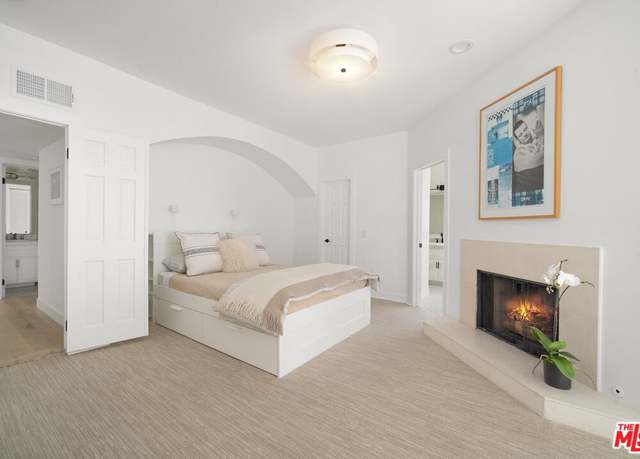
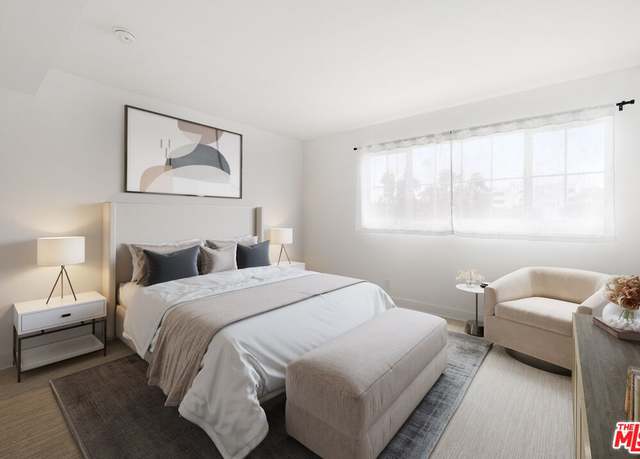
1/13
$889,000
2 beds2 baths947 sq ft
960 N San Vicente Blvd #9, West Hollywood, CA 90069
Chic Contemporary Living in Beverly Hills 90210 Step into the epitome of modern splendor in this newly remodeled Beverly Hills 90210 condo. From the new wide plank white oak wood flooring to the bright white walls and high ceilings adorned with stylish design elements, this space radiates sophistication and style. Upon entering the top floor penthouse condo, bask in the natural sunlight that floods the interiors, leading you to a step-down living room with a cozy fireplace ideal for both relaxation and entertainment. Transition through the central hall linking to a separate dining room, perfect for hosting elegant gatherings, while the eat-in kitchen provides a more casual dining experience
Welcome to the Vista Commons, built in 1929, the era of Los Angeles' coming of age, when Hollywood rose as the entertainment capital of the world, where classic elegance meets modern luxury, a place to call home. The timeless details abound in this quintessential Spanish courtyard community, with beautiful white crisp stucco trimmed with terra cotta clay tile, embraced by mature landscaping and fresh hardscape, light and gentle breezes dancing throughout the open spaces. This spacious 1 bedroom south facing ground floor unit features high cove ceilings, breakfast nook, new white oak engineered floors, and a faux fireplace. This property is a rare find, neighboring a row of picturesque build
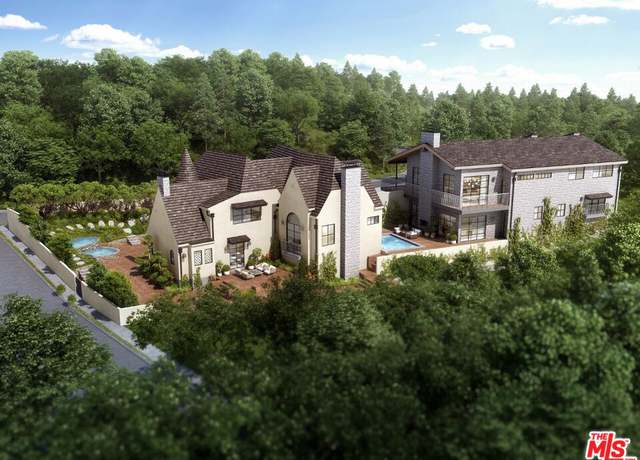
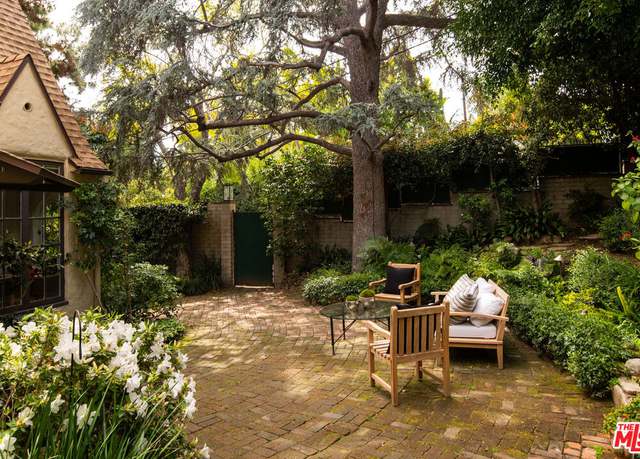
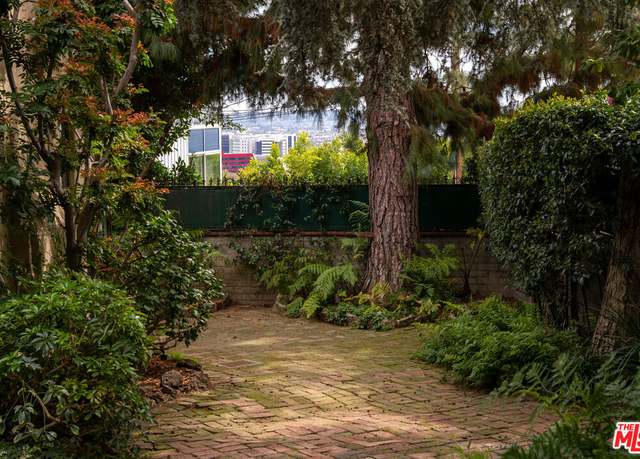
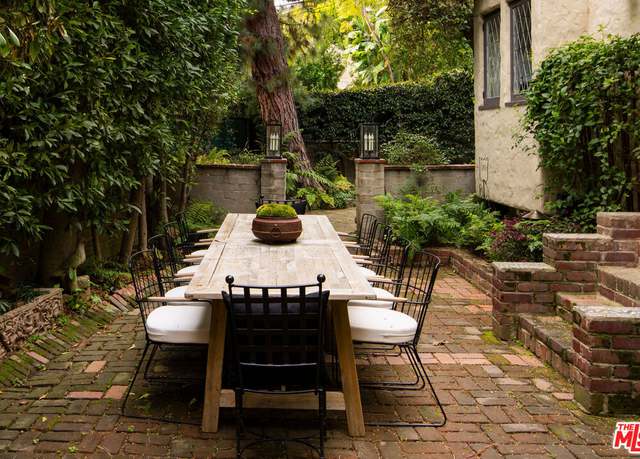
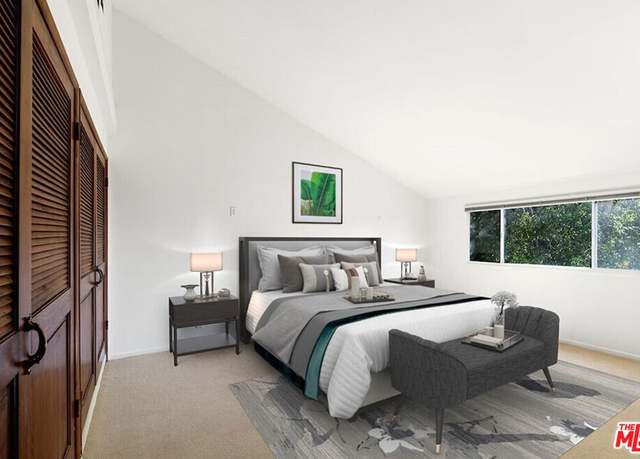
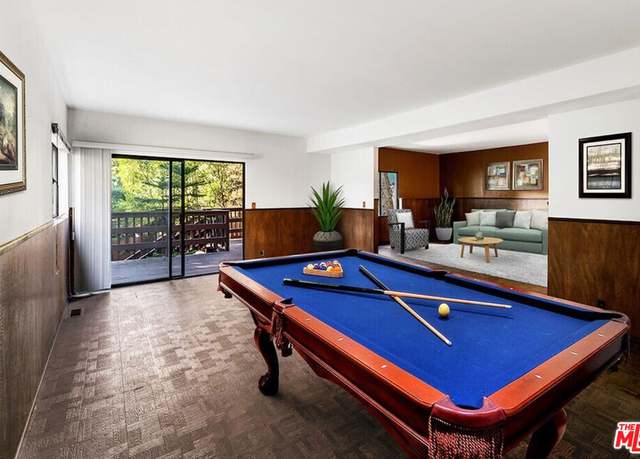
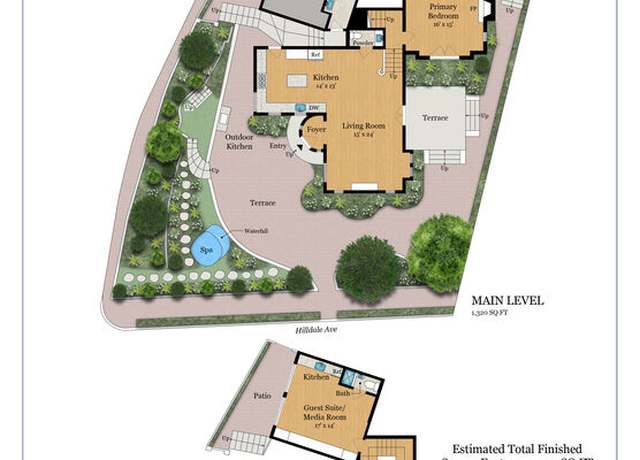
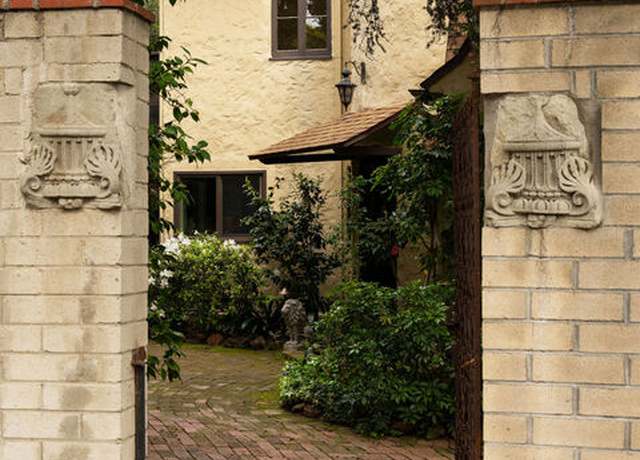
"Hilldale House", a magical estate encompassing TWO PRIVATE SINGLE-FAMILY HOMES PLUS GUEST HOUSE nestled amongst mature old growth landscaping in this most sought-after Bird Street adjacent enclave. (1) 1232 HILLDALE AVE: an enchanting 1924 turreted Cottage, secluded behind gates amidst magnificent grounds with an English garden that recollects the Devonshire countryside, yet just steps to the beating heart of the Sunset Strip. Included is an incomparably charming three-story guest house (ADU) "The Carriage House" that adds a whimsical aura to this storybook property. The entire home exudes old world class and is adorned with vintage period finishes that transport back t
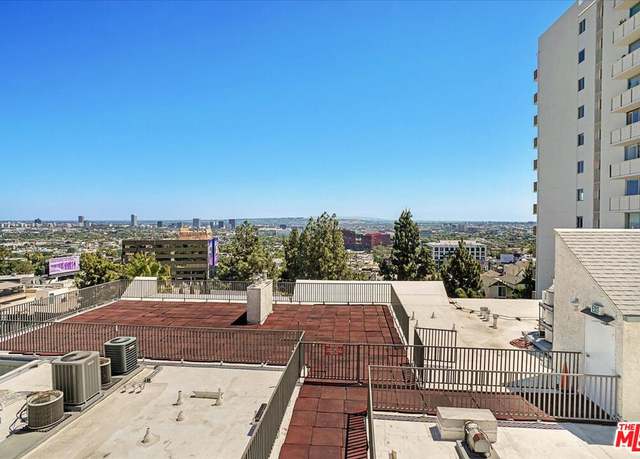
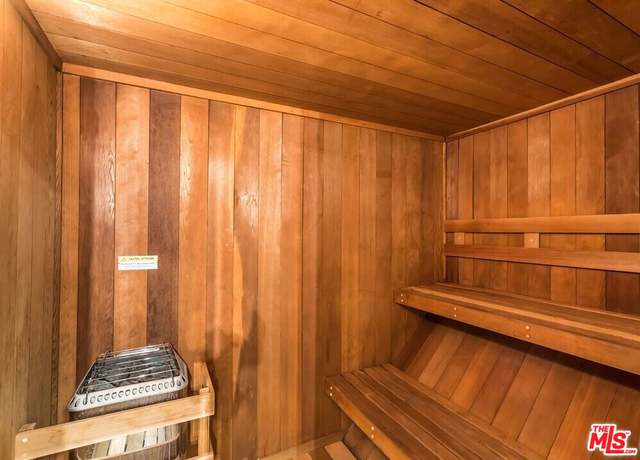
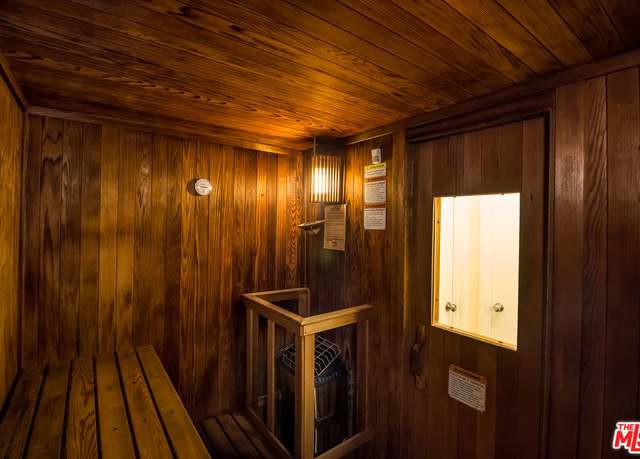
Introducing a chic urban retreat in the heart of West Hollywood's coveted Horn Plaza. This fully remodeled 1-bedroom, 1-bathroom condo boasts 797 sq ft of modern living space. Nestled on a tranquil cul-de-sac just off the iconic Sunset Strip, enjoy stunning views of Downtown LA and Century City from your own private oasis. Step inside to discover a sleek interior featuring a brand-new kitchen, bathroom, flooring, and lighting, offering both style and functionality. Unwind in luxury with amenities including a heated pool, sauna, spa, sun deck, and recreation room. Subterranean parking and controlled access entry with security cameras ensure peace of mind. Experience convenience with a full-t
Upper West Hollywood Location in one of the Best Buildings North of Sunset Blvd at Horn Plaza. First time on the market in 30 years 2BR/2BA home has absolutely been loved and cared for and is now ready for you to call home. One of the finest neighborhoods in prime Sunset Strip Hollywood Hills. Bright and airy open floor plan Perfectly updated kitchen, custom gas fireplace & open private patio. The Master Suite features a walk-in closet and has its own bathroom suite. The Second Bedroom suite is also light and bright & has plenty of closet space. New A/C system was just installed. Two parking spaces tandem plus Guest Parking. The building offers a resort-like Pool/Spa, 24/7 his/h
The Huntley Residence/ Newly Built Modern Minimalism at its finest located on one of the best streets in West Hollywoods desirable Melrose District. The Huntley features 3 beds, 3 bath ( Dining room was 3rd Bedroom and can easily be restored back to a full 3rd Bedroom), direct entry, three separate outdoor spaces including a private rooftop deck with hot tub & jaw-dropping views of the Hollywood Hills and a multi-functional room which can serve as a home gym, office and/or theater. Main level has an open floor plan with expansive window walls which lead to a private garden providing a bright and stylish living arrangement. Beautiful Living room with fireplace overlooking private pati
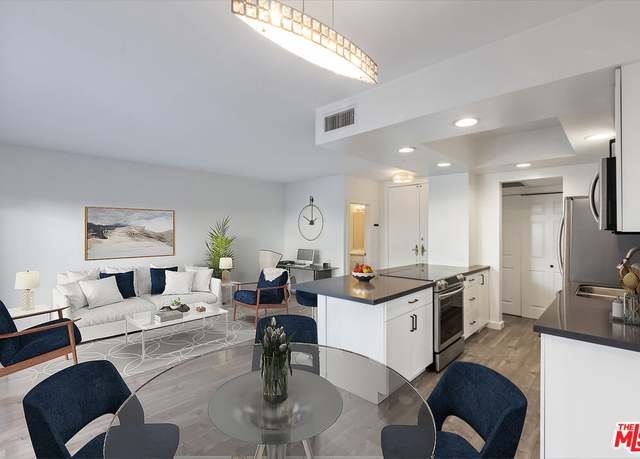
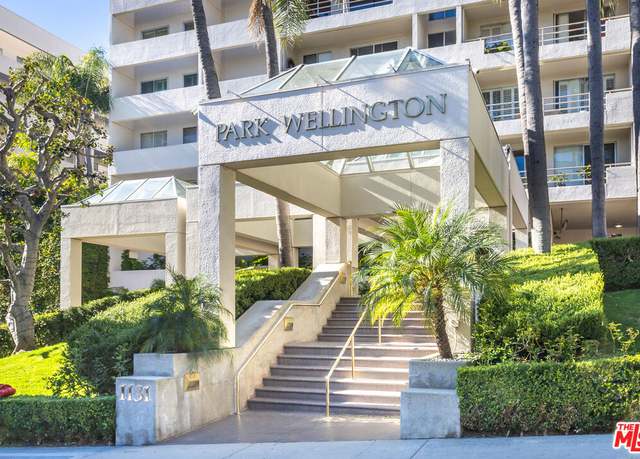
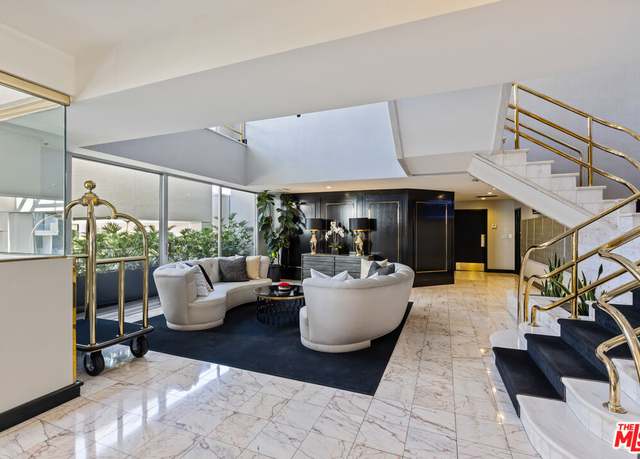
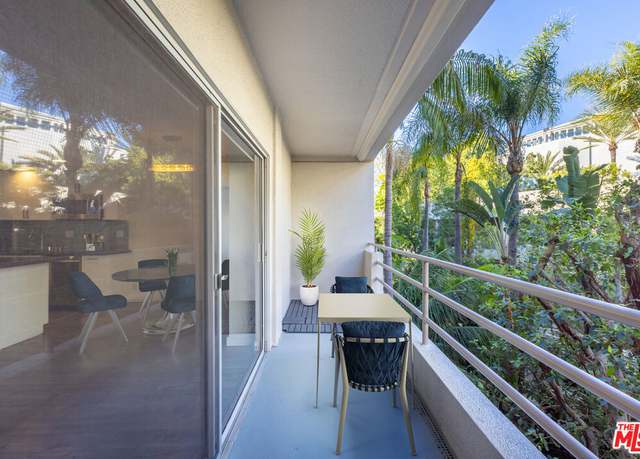
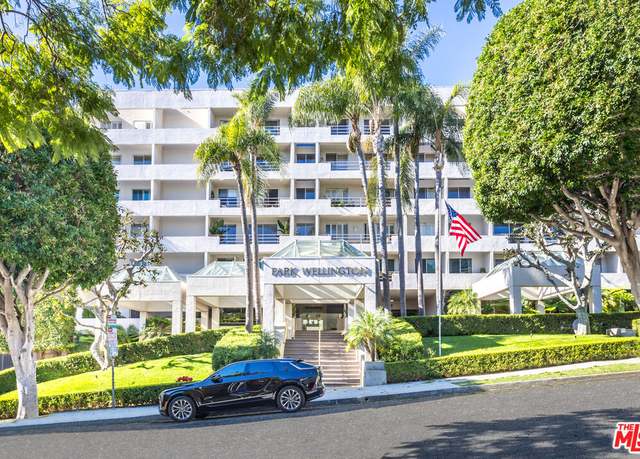
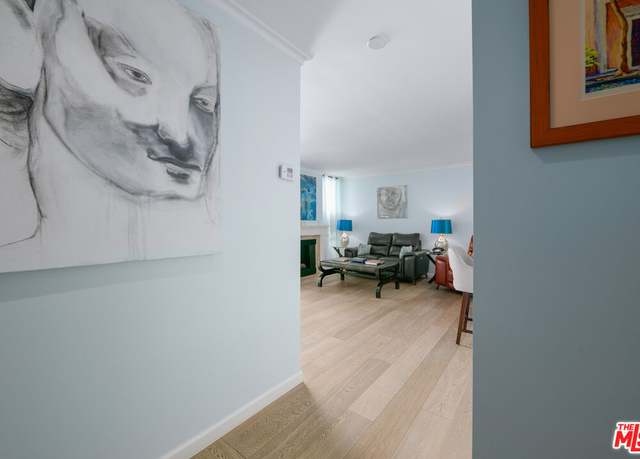
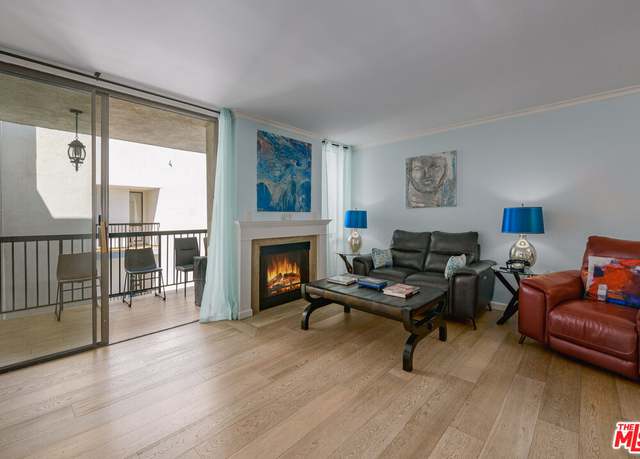
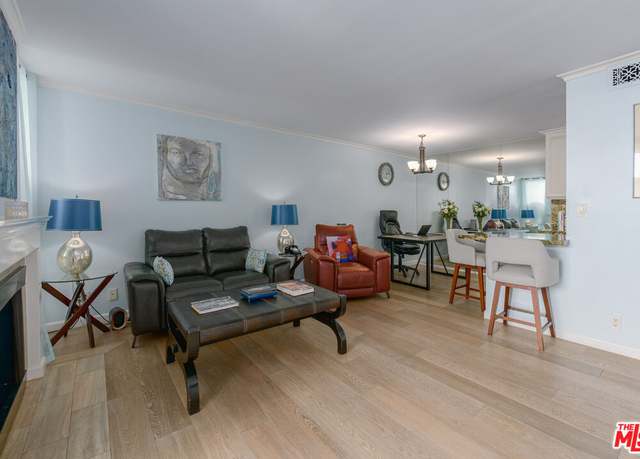
Welcome to your sanctuary at Park Wellington! This freshly painted unit is a rare gem nestled in the heart of luxury living. Step inside to discover a seamlessly designed open floor plan, where the spacious living room effortlessly merges with a modern kitchen boasting Quartz countertops, custom cabinets, a glass tile backsplash, and stainless-steel appliances. Versatility meets functionality with dedicated spaces for dining and a home office, offering adaptability to your lifestyle. Unwind on the tranquil balcony overlooking the serene courtyard. The primary suite is a true retreat, featuring its own TV, walk-in closet, blackout shades, and a well-appointed bathroom, creating a haven for r
This spacious Norma Triangle TOP FLOOR 1+1 condo home packs a lot of punch! Located in the center of the bustling Santa Monica Blvd and Sunset Blvd strip, this idyllic West Hollywood area perfectly brings to life the expression "location, location, location!" #510 at The Doheny Terrace boasts real hardwood flooring, an open floor plan, sleek lighting, large bedroom with custom walk-in closet, and a newly tiled balcony with floor to ceiling windows and sliders. This patio is perfect for entertaining guests, al fresco dining, or even an outdoor workout. Stunning, durable quartz countertops with island accentuate the stainless steel appliances and ample cabinetry in the kitchen. Even
Selling a Hip Lifestyle - the best West Hollywood/Sunset Strip has to offer! Spacious Corner View unit with two balconies providing West/North exposure. Light and bright with gorgeous sunsets in your Living Room every night. Recently refreashed and move-in ready. White Italian floor tile throughout. Kitchen offers Stainless Steel appliances, gas stove, Caesarstone counters. Custom closets, high ceilings and bath with double sinks. An Iconic Full-Service Building with stylish lobby and excellent staff, concierge, pool, spa, sauna, gym and Valet Parking. Close to all the action on Sunset Blvd. , shops, restaraunts and clubs. A blank canvas to make your own. In addition to the ammenities, HOA
Introducing a unique investment opportunity in the heart of West Hollywood. Totaling 3573 square feet of living space on a 5976 square foot lot. This is a character-filled fourplex which could be a perfect owner/user opportunity, making its debut on the market after decades, enjoys a coveted location just steps away from the premier shopping and dining destinations of Sunset Boulevard. Positioned north of Sunset and nestled behind the iconic Whisky A Go Go, this property offers unparalleled convenience to local amenities and entertainment hubs. Get in early as this location is primed for major investment and redevelopment of the Viper Room and the proposed 269,263 gross square foot mixed us
Discover the allure of Kingswood South Condominiums with this coveted west-facing corner unit, a canvas of modern living set against the vibrant backdrop of West Hollywood. This 1,493-square-foot, single-level condominium, featuring two bedrooms and two bathrooms, marries recent upgrades with the potential for personal customization. The entrance, marked by distinctive double doors, opens to reveal an expansive great room, illuminated by natural light through its glass walls and sliding doors that lead to a private balcony. This inviting space, complete with a classic Old Hollywood-style bar, seamlessly extends into a dining area, offering a cohesive flow for entertaining and daily living.
Welcome to 1275 Havenhurst Dr #7 – at 'The Lawford'! This fabulous historical mid-century property is situated in the heart of West Hollywood, and was the last residence of Peter Lawford; actor and Rat Pack member. The gated and secure building is situated on a gorgeous tree-lined street and features a beautiful resort style courtyard, with a pool and ample outdoor relaxing areas. This very desirable light and open one-bedroom, one-bathroom apartment is remodeled throughout to a very high standard with new flooring, new kitchen cabinets and Carrara marble counters, Samsung stainless stain appliances, along with new vanity, marble and tile shower in the bathroom, LED recessed lighting
This West Hollywood dream condo boasts one bedroom and one bathroom and more than 800 square feet of living space. It is located in prime location in the vibrant Design District, making it a coveted spot for those seeking the epitome of city living. The proximity to Urth Café, fine dining establishments, shopping havens, and nightlife hotspots ensures that residents have easy access to various entertainment and conveniences. Nestled within an impeccably clean Mid-Century Building, this modernized one-bedroom, one-bathroom unit on the second floor offers natural light and privacy, thanks to its north-facing position. The spacious floor plan provides flexibility, with separate living a
GREAT WEST HOLLYWOOD LOCATION! Four plex in Prime West Hollywood West located just West of La Cienega! Walk to great restaurants, finest stores and shops and entertainment venues. Tree lined street with permit parking and plenty of lush greenery. Property is fenced, hedged and has locked gates for privacy and security. Plenty of upside in current rents. Each unit has washer and dryer and most units have private gardens. Building has been professionally managed and most units are upgraded. Priced to sell! Houses in this area typically sell for much more than this property.
Quiet and convenient hideaway located in the Location is prime-center of prime West Hollywood just a block from the Sunset Strip, clubs, restaurants, nightlife, and shopping. Completely remodeled 1 Bedroom to modern tastes with new stylish laminate flooring, new kitchen, all new fixtures, new paint. Kitchen has gleaming white quartz-like countertops and stainless steel appliances all brand-new ready for a new owner. Spacious open floor plan with new laminate hardwood flooring in the living/dining rooms and bedroom. Fresh new paint throughout, plus new ceiling fans, three air conditioner units, a variety of cosmetic renovations, and a beautiful bathroom with tiled tub/shower brand new commod
SPANISH JEWEL BOX IN PRIME WEST HOLLYWOOD ON RUGBY DRIVE. Walkable to everything that this bustling area has to offer and priced better than most condos of similar size. Elegant living room with coved ceilings and a decorative fireplace as the room's focal point. Hardwood floors throughout, recessed lighting, and lots of natural light. Large separate dining room with bay window and a galley style fully equipped kitchen with vintage Spanish tile, gas range, and premium appliances. Two spacious bedrooms both with ample closets complete with built-ins. Two bathrooms, one en-suite. Separate laundry room with side-by-side washer and dryer. Grassy area in the front of the house with hardscape sur
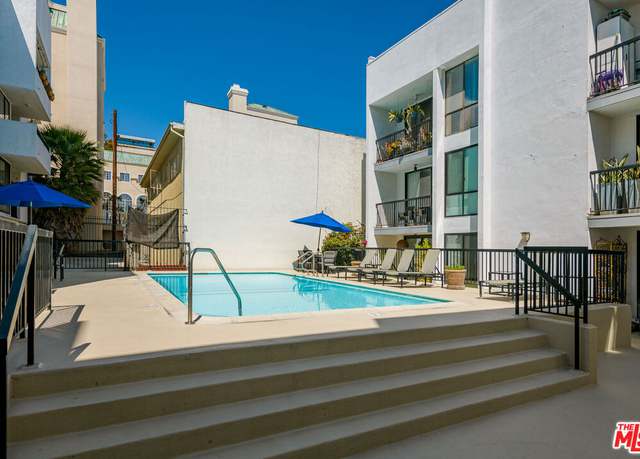
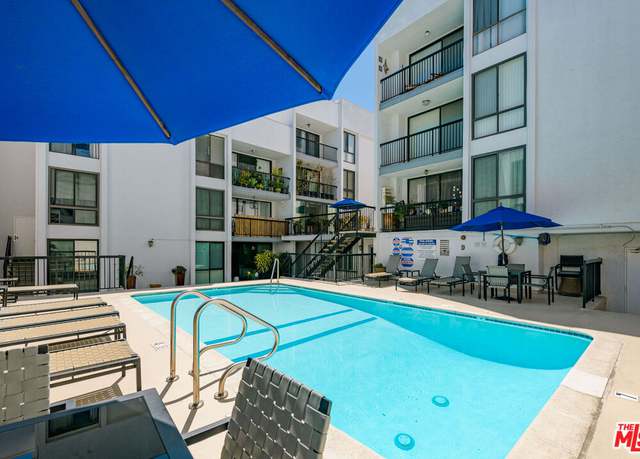
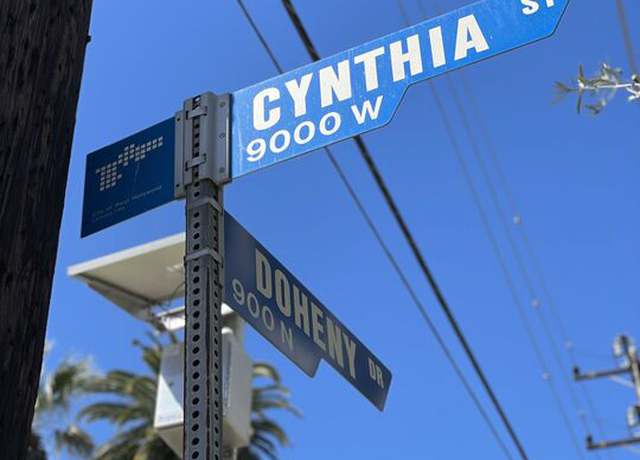
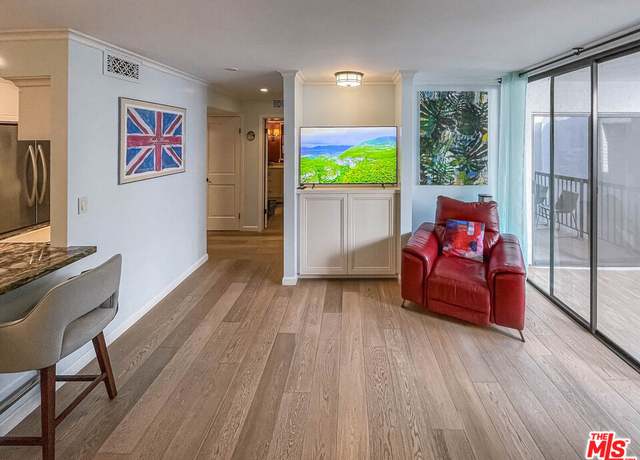
Welcome to 9000 Cynthia Street #302, situated in the coveted Norma Triangle! This exquisite condo offers 2 bedrooms, 2 bathrooms, and 1,591 square feet of fully updated living space. As you enter, you'll be greeted by elegant tiled floors, recessed lighting, and a spacious living room that exudes comfort and style. The adjacent dining area and kitchen seamlessly blend together, with the kitchen boasting modern appliances, contemporary cabinetry, and ample storage and counter space – a true haven for any culinary enthusiast. The primary suite is reminiscent of a luxurious hotel, offering a serene retreat for relaxation and rejuvenation. Both bathrooms are thoughtfully appointed for com
The iconic "Hollywood Riviera" is an architecturally significant West Hollywood treasure and designated landmark. It was built in 1954 by renowned architect, Edward H. Fickett. This charming first floor unit with hardwood flooring and large windows throughout the open floor plan is light and bright. Step out to the large private rear patio for indoor/outdoor entertaining. Walk out the front door to the resort-like, heated swimmers pool and sunning deck. The secured main building entry features lava rock and tropical plantings. Automated gated covered parking for 2 cars. On the Mills Act passing property tax savings to the buyer. Featured in films (Rush Hour, L. A. Stories + many m
This area's enrollment policy is not based solely on geography. Please check the school district website for more information.
Elementary schools
Middle schools
High schools
GreatSchools Summary Rating
9/10
Melrose Elementary School
Public, K-5 • Choice school
8/10
West Hollywood Elementary School
Public, K-5
7/10
Rosewood Avenue Elementary School, School For Advanced Studies
Public, K-5
4/10
Laurel Elementary School
Public, K-8
School data is provided by GreatSchools, a nonprofit organization. Redfin recommends buyers and renters use GreatSchools information and ratings as a first step, and conduct their own investigation to determine their desired schools or school districts, including by contacting and visiting the schools themselves.Redfin does not endorse or guarantee this information. School service boundaries are intended to be used as a reference only; they may change and are not guaranteed to be accurate. To verify school enrollment eligibility, contact the school district directly.
West Hollywood, California is well-connected by a variety of transportation options, including public transit. The city is served by multiple bus routes, providing residents with an alternative to driving. However, like many parts of Los Angeles County, West Hollywood can experience high levels of traffic, particularly during peak commuting hours. For those who prefer to travel by car, the city is conveniently located near several major highways, including the 101 and 405 freeways. Learn more on our West Hollywood city guide.
What types of properties are available in West Hollywood?
West Hollywood, California offers a variety of single-family home types, including contemporary, modern, and Mediterranean-style properties. These homes can be found throughout the city, with some located in the desirable neighborhoods of the Bird Streets, Sunset Strip, and the Norma Triangle. Most single-family homes in West Hollywood feature 2-4 bedrooms and were built in various years. To explore different property types for sale in West Hollywood, California, use the 'Home type' filter located above the active listings. Customize your search by selecting options like single-family homes, condos, townhomes, and more.
What is life like in West Hollywood?
Living in West Hollywood, California offers a vibrant urban experience with a mix of residential and commercial areas. The landscape is characterized by a bustling cityscape, featuring modern architecture and well-maintained streets. The weather is typically mild, with warm summers and mild winters, providing a comfortable climate year-round. The city offers a range of job opportunities, particularly in the entertainment, fashion, and creative industries. Residents can enjoy a wide array of activities, including trendy shopping, dining at diverse restaurants, and exploring the local arts and cultural scene.
What are the schools and amenities like in West Hollywood?
West Hollywood, California is a vibrant region that offers a wide array of public amenities to its residents. The area is rich with a diverse selection of restaurants, catering to a range of culinary preferences. Numerous parks provide green spaces for leisure and relaxation. For everyday needs, there are plenty of grocery stores scattered throughout the city. Additionally, West Hollywood is home to various other amenities such as fitness centers, libraries, and shopping centers, ensuring a convenient and enjoyable living experience.
In the past month, 30 homes have been sold in West Hollywood. In addition to houses in West Hollywood, there were also 138 condos, 8 townhouses, and 21 multi-family units for sale in West Hollywood last month. West Hollywood is a supremely walkable city in Los Angeles County with a Walk Score of 91. West Hollywood is home to approximately 32,963 people and 24,727 jobs. Find your dream home in West Hollywood using the tools above. Use filters to narrow your search by price, square feet, beds, and baths to find homes that fit your criteria. Our top-rated real estate agents in West Hollywood are local experts and are ready to answer your questions about properties, neighborhoods, schools, and the newest listings for sale in West Hollywood. Our West Hollywood real estate stats and trends will give you more information about home buying and selling trends in West Hollywood. If you're looking to sell your home in the West Hollywood area, our listing agents can help you get the best price. Redfin is redefining real estate and the home buying process in West Hollywood with industry-leading technology, full-service agents, and lower fees that provide a better value for Redfin buyers and sellers.


 REDFIN IS COMMITTED TO AND ABIDES BY THE FAIR HOUSING ACT AND EQUAL OPPORTUNITY ACT. READ REDFIN'S FAIR HOUSING POLICY AND THE NEW YORK STATE FAIR HOUSING NOTICE.
 United States
 Canada