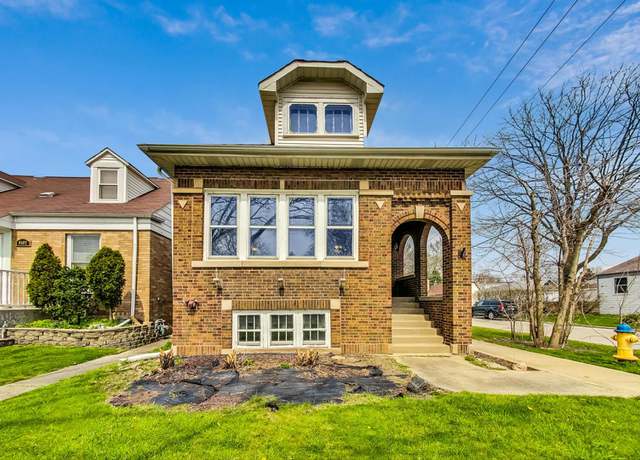
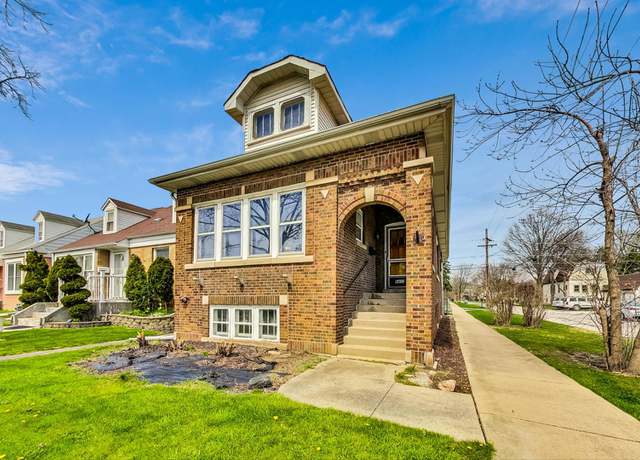
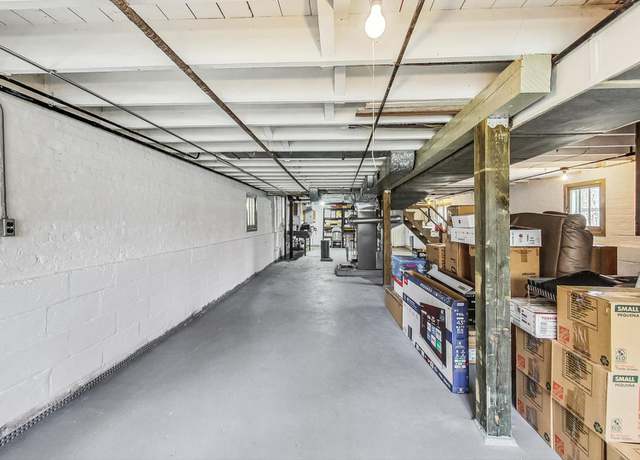
Classic all brick 3 bed 1 bath bungalow ideally located on the corner of Washington and Harrison in Brookfield. Property is situated less than 1 mile from the Metra station, downtown Brookfield, restaurants, shopping, and highly rated schools. 2 bedrooms on the main level, 3rd bedroom on second level. Hardwood floors throughout first floor. Potential for converting upstairs 3rd bedroom into two separate bedrooms. Full unfinished basement protected by Permaseal. Sump pump with battery backup ensures a dry basement with ample storage. Basement features exterior exit/entrance. Potential for additional office/room in basement. Rear entrance/exit to main level has deck & mudroom.
Welcome to this beautiful 4-bedroom Farmhouse, ideally located on a generous 50 x 125 lot. This 2-story home offers an inviting atmosphere with its high 10-foot ceilings on the main level and a separate dining room ideal for family gatherings. The main floor features a versatile bedroom that can double as a home office, alongside a convenient powder room. The heart of this home is the updated kitchen, equipped with stainless steel appliances, tall oak cabinets, sleek granite countertops, and a pantry closet. On the second level, you'll find three additional bedrooms, providing ample space for family and guests, complemented by a full bathroom. Outside, the fenced backyard serves as a privat
Welcome to your dream home nestled in a tranquil neighborhood! This captivating 2-story abode boasts 3 bedrooms and 2.5 bathrooms, meticulously designed to blend modern updates with functionality. Upon entering, you're embraced by the inviting ambiance accentuated by quality wood finishes throughout and abundant natural light streaming in, creating a bright and welcoming atmosphere. With two separate HVAC systems, personalized comfort is ensured year-round, allowing you to tailor temperatures to your liking. The expansive living areas are perfect for both intimate gatherings and peaceful retreats. An additional recreation room offers versatility for various activities and entertainment opti
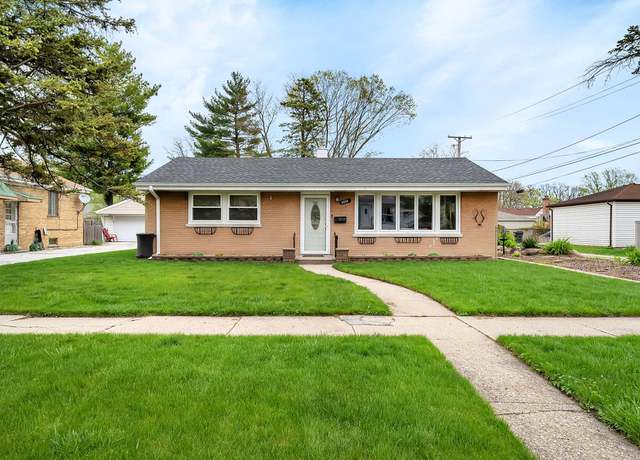
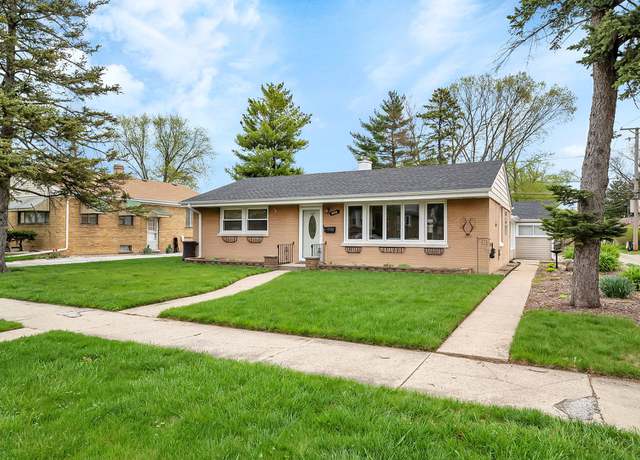
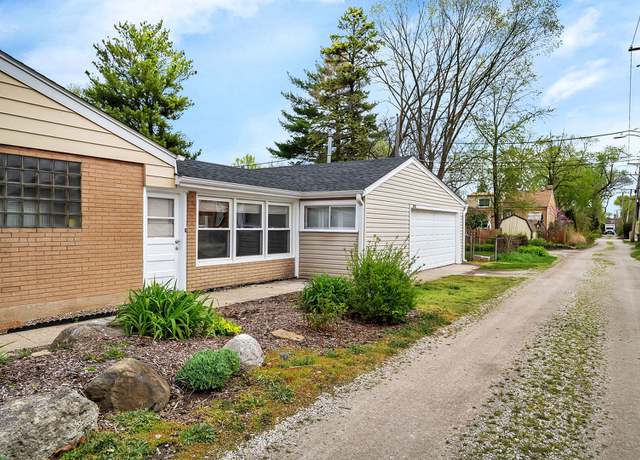
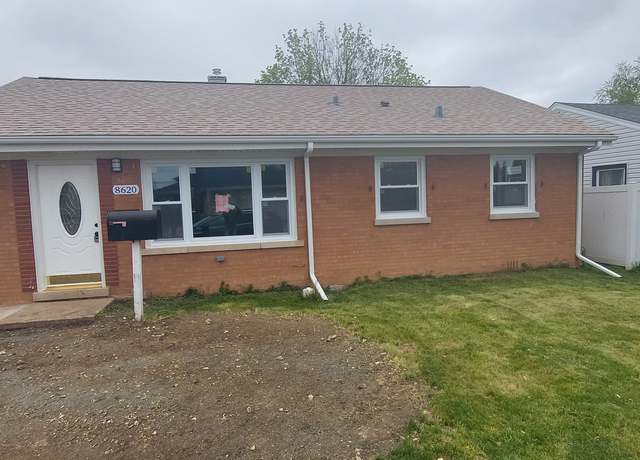
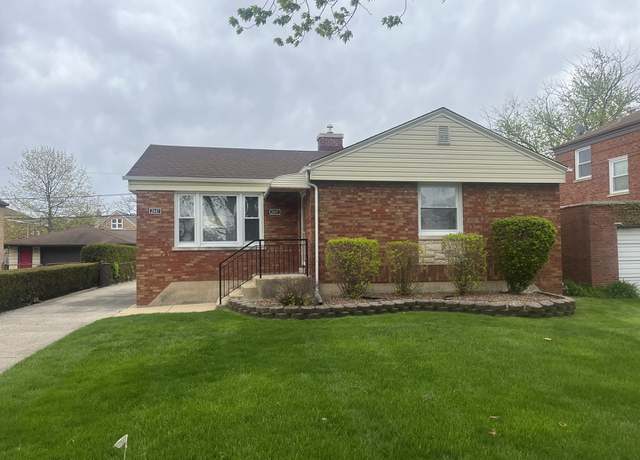
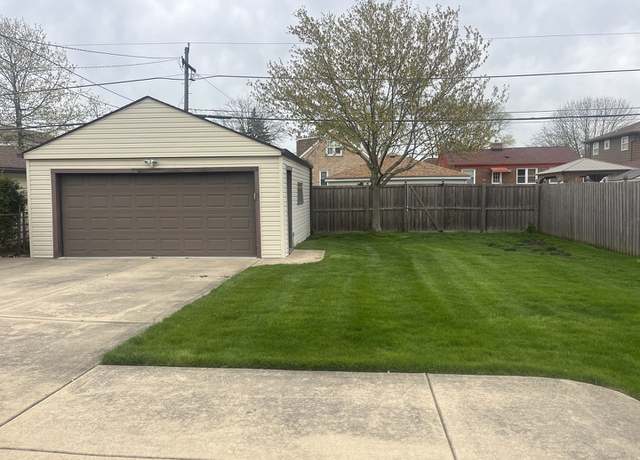
Solid brick ranch with great curb appeal in a great Brookfield location. Warm and welcoming from the first moment you walk into the spacious living room full of natural light. Freshly painted bedrooms with generous sized closets. Off the kitchen is a family room that opens up to the backyard and connects directly to the 2 car attached garage. Added workshop/storage area in the garage. The large backyard with a patio and firepit provides the perfect space for outdoor entertaining or relaxation. The roof and gutters where done in 2020 and AC in 2019. Just minutes away from Brookfield Zoo, shops, restaurants, and beautiful forest preserves. For transportation, the home is a few blocks from the
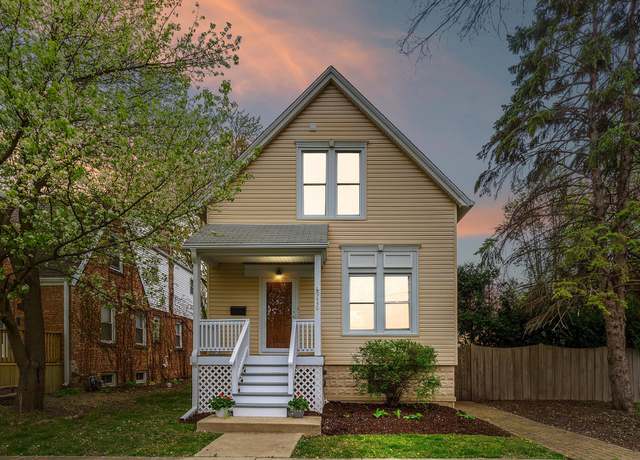
Welcome to your dream home in Brookfield! This home is about as close to new construction as you can get!!! Down to the studs rehab, with just about everything you can imagine new! New Hardwood Floors, New Roof on house and garage, New Central Air, New High efficiency Water Heater, New Wood Cabinets, New Quartz Countertops, new stainless appliances, New Garage Doors with WiFi Opener, New Copper Plumbing, New Electrical, New insulation, New Drywall, New Reinforced Framing, awesome, easy access Attic, 16 New Windows on House And 2 New Windows on Garage. The Garage and the Fence was also painted. This is an absolute gem and just waiting for you! (some shelving to be added in the kitchen by the
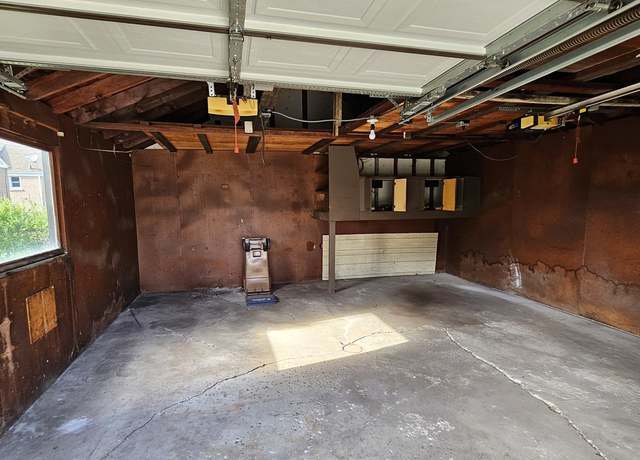
Brick and frame ranch home with good curb appeal and so many possibilities! Home is priced GREAT and ready for your repairs and renovation for your buyers and/or investors who like to repair and decorate to increase their equity! 2 bedrooms plus a family room with a fireplace. Laundry is within the kitchen. 2 garage spaces. Property is winterized for safety and will not be de-winterized for inspection. Plumbing did not hold pressure. See Broker Remarks-Agents present their Own Offers. No additional utilities turned on for either inspection or appraisal (=renovation type loan or cash) plus no additional repairs will be completed by the seller. Please be sure you've viewed the property prior
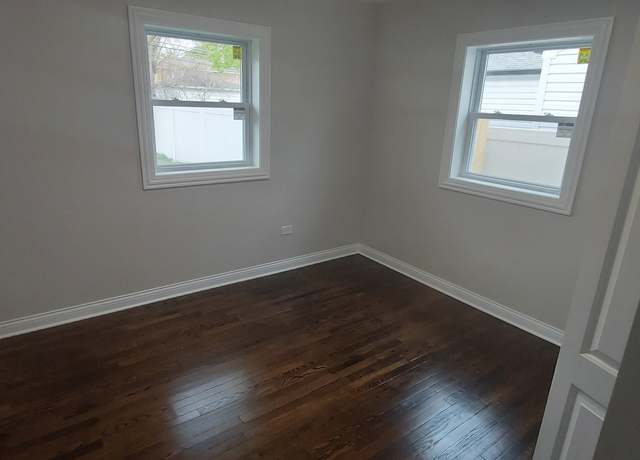
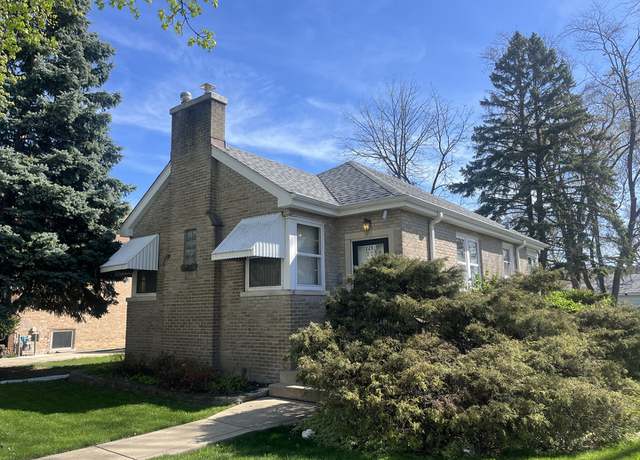
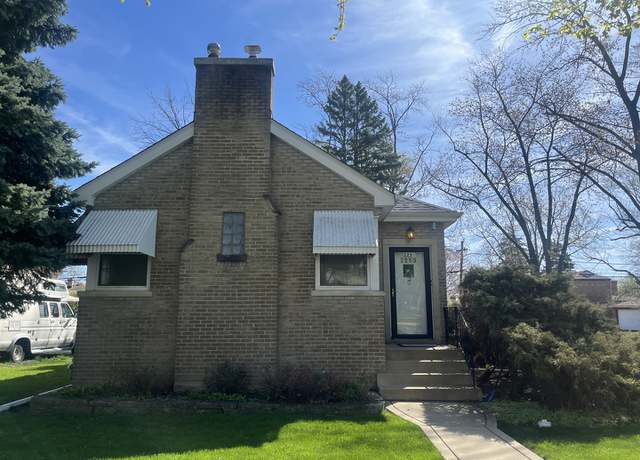
Discover the charm of this well-maintained brick Georgian, boasting great curb appeal and many recent improvements. The house features comfortably sized bedrooms on the second floor, offering ample natural light and privacy. The primary bedroom is notably spacious, featuring two closets. A full bathroom includes classic wainscoting and a tub, blending functionality with style. Throughout much of the house, beautiful hardwood floors enhance the warmth and character of each room. The sun-drenched and inviting living room boasts large bay windows that illuminate the space with natural light and provide a picturesque view of the neighborhood. A separate dining room offers a perfect setting for
Spacious 3-bedroom home with Bonus 1-bedroom COACH house! Coach house features a 1 bedroom, kitchen, bathroom, basement that is great for storage and laundry room, along with independent utilities. The main home features 3 bedrooms, living room, dining room, kitchen with vaulted ceiling and table space, an extra room perfect for an office, and a partially finished basement with family room and a half bath. New hardwood floors, and updated bathroom in main home. Enjoy your summer days in the lovely backyard with deck and pergola. New updates include updated bathroom and new hardwood floors on main house. This property offers an unique blend of single-family privacy with the added advantage o
Don't miss out on this amazing opportunity to own a fully renovated home that has already passed village inspection! This place is all set for you to move right in, with new appliances, furnace, water heater, flooring, electrical, and plumbing all good to go. Enjoy a spacious backyard and a 2-car garage in the heart of Brookfield. The open floor plan and modern finishes create a fresh and stylish atmosphere throughout the home. Plus, upgrades galore including a newly remodeled kitchen and bathrooms. The sleek flooring ties everything together, making each room feel spacious and classy. Located in the top-rated school districts 95 and 208, and just a stone's throw away from Brookfield Zoo, s
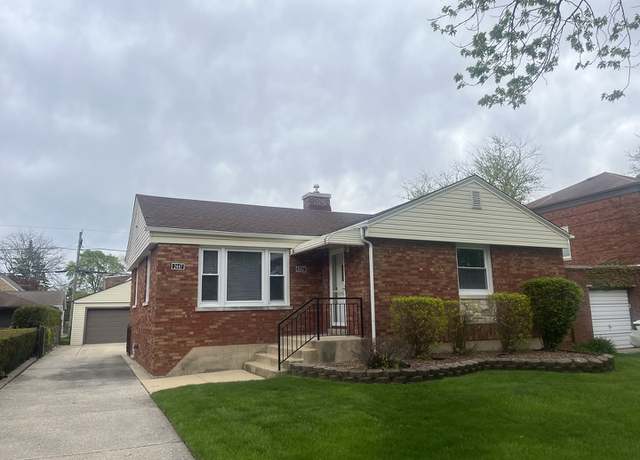
Introducing a fantastic opportunity to own a well maintained 2-flat residence, in desirable Brookfield. This property is an ideal find for those looking to invest in a steady income-producing asset or accommodate extended family in a spacious and comfortable setting. Each unit boasts a layout comprising of three bedrooms and a full bathroom, perfect for families or professionals seeking ample living space. The floor plan maximizes the area, providing a blend of comfort and functionality with lots of natural light as a bonus. Great location that is part of the Lyons Township High School district. Close to all that Brookfield has to offer - 6 blocks to the Metra Train line, shopping and dinin
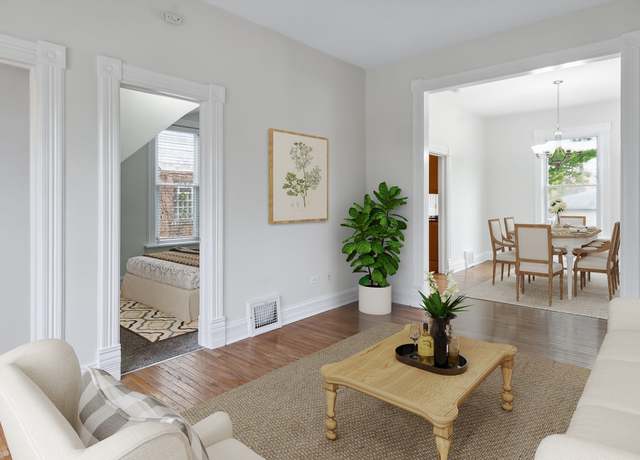
This gorgeous bungalow home was fully renovated in 2012, sitting on a 60-foot lot! The aesthetic is so current, looks as if it could have been completed yesterday. You are sure to be impressed the minute you enter the home, with an unbeatable floor plan of 4 great size bedrooms with ample closets with storage, 2 full baths, designated office, and a separate dining room. 9- foot ceilings, bamboo floors through-out the 1st and 2nd floor, and designer custom window treatments. Its Gourmet kitchen enjoys plenty of counter space, a huge island with Granite countertops, all high-end stainless-steel appliances, custom glazed cabinets round out this room. Both baths are also finished with granite c
LOCATION LOCATION LOCATION TOP OF THE LINE QUALITY REMODELED ALL BREND NEW FROM THE ROOF AND TO THE BOTTOM THE HOUS This Beautiful 4-bedroom split-level LIVING WITH BAY WINDOW LOOKING AT OPEN AREA ACROOS FROM LINCHOLN SCHOOL , Great location in the heart of Brookfield. ONLY 15 MIN FROM DOWNTOWN CHICAGO EVERYTHING ITS IN Walking Distance , parks train BROOKFIELD ZOO, Can ask for better location This home is right across from the Lincoln elementary school and only a few blocks from a large community park. Walking distance from the train and Brookfield Zoo. Just minutes from the highway.
Considering investing in a Multi-Unit Brick property with the goal of generating Passive Income through rentals, and you're specifically interested in a Location that is close to Great Schools, has convenient access to transportation (such as Metra trains and buses), Highways (I290, I294, I55, I88), Restaurants (Nearby Secondary Business District), and Shopping Areas. Here are some key factors to consider: 1. * * Location: * * Proximity to schools, public transportation, and amenities can significantly increase the attractiveness of your property to potential renters. Research areas that offer a balance of these features. 2. * * Property Type: * * Brick multi-unit buildings can be
Are you considering building your dream home? Check out this awesome lot with a 63-foot frontage in a great location in Brookfield! The alley is paved, sewer line improved, and the property comes with plans for building a home that have already been approved by the Village, as well as a garage. The home has been demolished; the garage still stands. Highly-rated schools and convenient to the Metra, shopping, dining and Downtown La Grange. There are currently no property tax exemptions.
Beautiful 4 bedroom home in North Riverside. Corner lot with plenty of room for entertaining. Full finished basement and 2 car attached garage. Come and make this your spring project. Close to schools, parks, restaurants and shopping. This property is HUD owned and is offered in "As Is" condition with neither repairs nor warranties. HUD ID: 137-507209 Insurability: IE
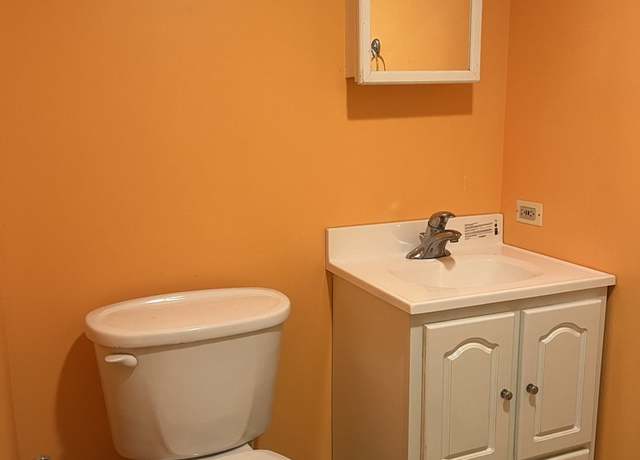
Check out this fully renovated Lyons home. Completely gutted including all new wiring, plumbing and HVAC. Upgraded water service per village code. Modern kitchen with new cabinets, quartz countertop and stainless steel appliances. Refinished hardwood flooring. All new doors, trim and windows. Updated bathroom with new tile and vanity. Painted in neutral color. 2 car garage. This home will not disappoint.
CHECK THIS OUT!! COMPLETELY REMODELED 2 BR W LARGE OFFICE IN BASEMENT AND 2BA WITH FULL FINISHED BASEMENT! INCLUDES A NEW ROOF, NEW WINDOWS, NEW FURNACE AND AIR CONDITIONER, NEW ELECTRIC, NEW PLUMBING, NEW MODERN KITCHEN CABINETS, NEW BATHS!!!! QUARTZ TOPS AND BACKSPLASH, NEW SS APPLIANCES. NEW MODERN LIGHT AND PLUMBING FIXTURES THROUGHOUT. NEW 2 CAR GARAGE DOOR, NEW DOORS AND TRIM THROUGHOUT, NEW SANDED AND FINISHED FLOORS AND FRESHLY PAINTED THROUGHOUT.
Welcome home! Buy this renovated 4 bed 2 bath home located in desirable North Riverside! New Stone white Quartz countertops layer your tastefully updated kitchen with new custom white shaker cabinets, gold accents, knobs, faucets and finishes. Elevate your culinary experience with new sleek SS Whirlpool appliances, complemented by waterproof luxury vinyl flooring, Fully renovated bathrooms featuring new vanities, new light fixtures, new toilets and tiled showers. Thoughtful touches like lifted ceilings on the second floor living area with new carpeted flooring, brand new six panel doors, bronze handles, refinished stairs, and additional can lighting throughout. New Feldco windows throughou
A great way to get into beautiful La Grange Park with this solid brick 2 bed / 1 bath step ranch. Step into your living space with hardwood floors, large picture window that fills the room with natural light and newly added recessed lighting. Main level primary bedroom and 2nd bedroom with hardwood floors and full bath. Large eat-in kitchen with new quartz countertops (2023), stainless sink with touchless faucet, oven/range (2021), dishwasher (2023). Recently replaced bath & kitchen windows. New washer & dryer (2023). Lots of room in the unfinished basement provides an opportunity to double your living space, create a rec room, or lots of storage space. Updated electric service
Fantastic opportunity to own this unique split level Duplex side by side. Great for possible Air BNB, related living, or occupy one and rent the other. Each unit has 3 bedrooms and 1.1 Bath. One unit recently rehabbed and freshly painted. Bright spacious living room with vaulted ceilings, and vinyl floors on the main level. The lower level consists of an updated kitchen with a nice size eating area, new cabinets, newer counter tops, back splash, ceramic tile floors and new appliances. . Updated 1/2 bath, additional space for mud/sitting room, and separate laundry area with washer and dryer. Share the large fenced backyard for your family and/or friends.
Welcome to this beautifully updated single-family home in Lyons, where modern comforts and stylish upgrades come together to create a truly inviting living space. This meticulously maintained residence offers a perfect blend of contemporary elegance and practicality, making it an ideal place to call home. The home boasts a newly renovated bathroom and kitchen, exuding timeless appeal and functionality. New kitchen lights illuminate the heart of the home, creating a warm and welcoming atmosphere for culinary endeavors. The addition of new landscape and Thuja evergreen trees around the perimeter provides privacy and a picturesque outdoor setting, making the property a true oasis. Situated on
BeautyHome recently updated, 5 bedroom 2 Bath. spacious 2-story home, perfect for accommodating large families or those who love to entertain guests! 4 of the bedrooms are located on the 2nd level, and one bedroom is on the 1st floor. New kitchen with new cabinetry and a granite countertop SS appliances. New flooring in all rooms, Newer furnace A/C & Water Heater (High efficiency), laundry area in the basement. This beautiful home is conveniently located near highways, 15 minutes to downtown, and 15 minutes to the Airport. The home is on a large lot and features a large backyard with plenty of outdoor activities and entertaining space. This home is truly a gem and a must-see! Sold As
Welcome to 113 Bluff Ave in La Grange, IL 60525! This property offers a fantastic opportunity for fix-and-flip investors ready for HEAVY RENOVATION and potentially new construction builders looking for a tear down with utilities on site. Cash Purchase. Situated on a sizable 7000 sqft lot, this single-story home with a basement is perfect for investors and new construction builders alike. The property does come with some challenges. The city of La Grange has issued violations on the property, including but not limited to foundation issues, front and back porch requires renovation, windows replaced, interior gutted and scraped to the outer wall. The siding is in need of replacement, and the e
Attention Developers! Rare large parcel available in walk-to town/train location. Zoned R-6 (2 family). Parcel consists of 8 separate lots totaling approximately 40,000 SF. Formerly the Hines Lumberyard. Vacant and ready to develop. On the map, it's the lot labeled "511" Being sold "AS IS"
Property is Zoned Residential for Singe Family Dwelling. The buyer will have to go in front of Zoning board to apply for variance to build a home on the property. This is the gateway to the west and this is a great opportunity to build a home in great community. The village hall is 5 blocks away and they host all the great village events there from Father's Day Car Show, 4th of July Party, and Halloween. Top notch parks and close to restaurants and great access to interstate highways. Metra Train Station is nearby with Brookfield and Riverside being neighboring towns. Perfect and Ideal lot for someone looking to build a home. Property sold "As Is" Vacant Land Drive by and view. &
This is the ideal location to build your next dream home. Lyons new construction has been selling over 500K. Best to build a home for yourself as it should be cheaper in the long run. The owner here has owned this lot for over 20 years and says it's time to sell. The price is what it is. Bring your offers and make this one yours. 1 block away from Costello School in district 103. Walking distance to parks and close to expressways and stores. Come check it out and make your own house soon!! Great size lot and this one is a must see, must buy! Talk to your brokers about lot loans, or construction loans to build a home.
Rehab/construction loan or cash only. Apartment no longer a legal apartment. May be used as an in-law arrangement. See village inspection report for more details. Possible Related living in back of house but work needs to be finished. House sits on very deep lot. buyer is responsible for all city repairs, inspections, and any escrows that may apply. Once work is completed, could be either a 4 bedroom and 3 bath house or in-law arrangement without a second kitchen. See village report for more details on work required.
$209,000
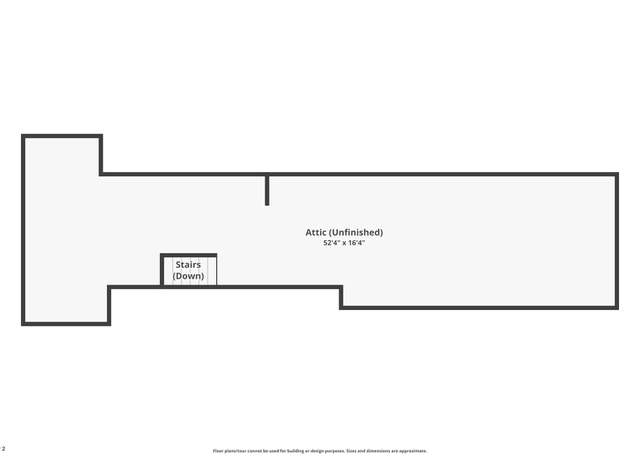
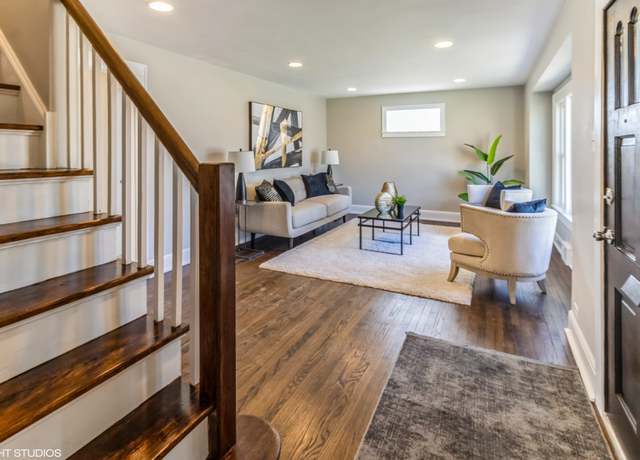
2 beds2 baths1,892 sq ft
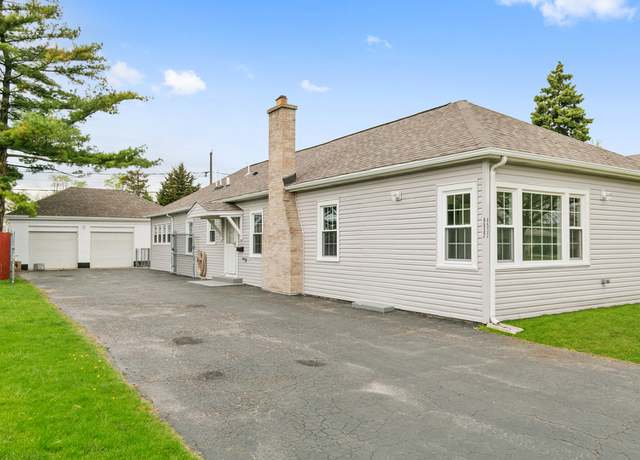
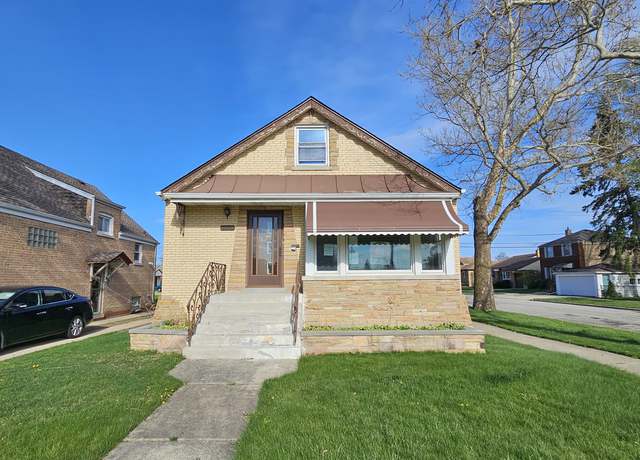
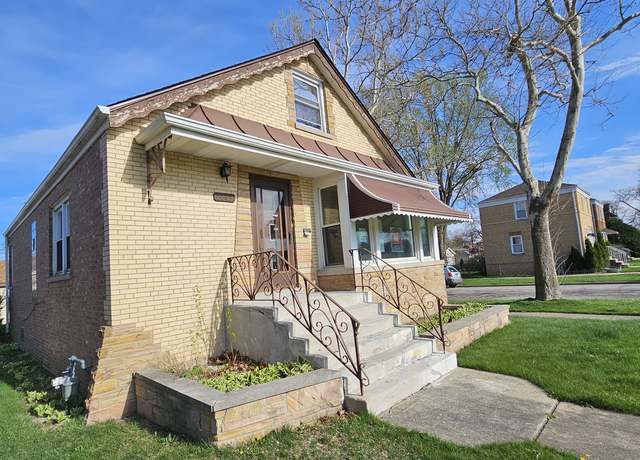
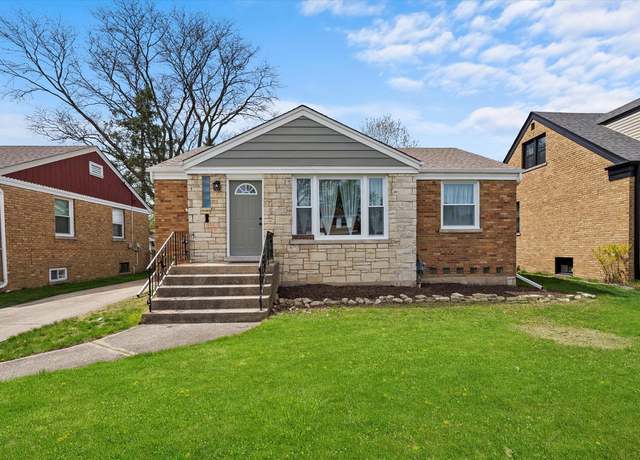
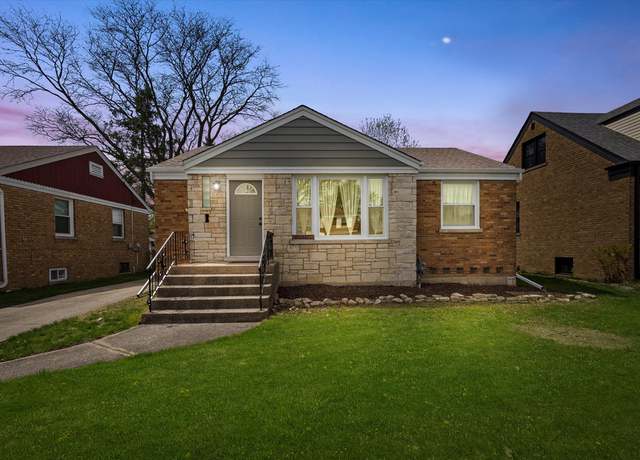
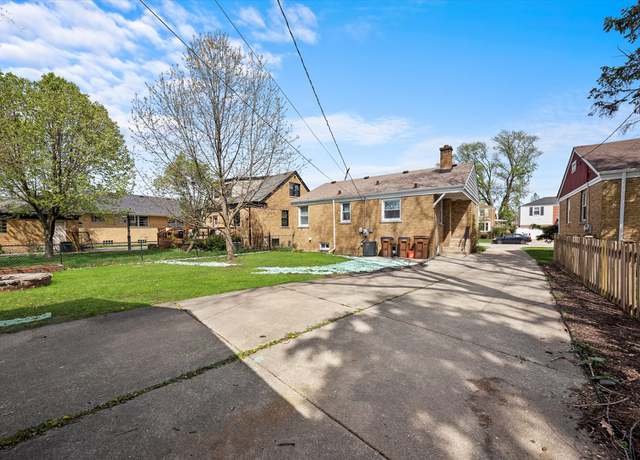
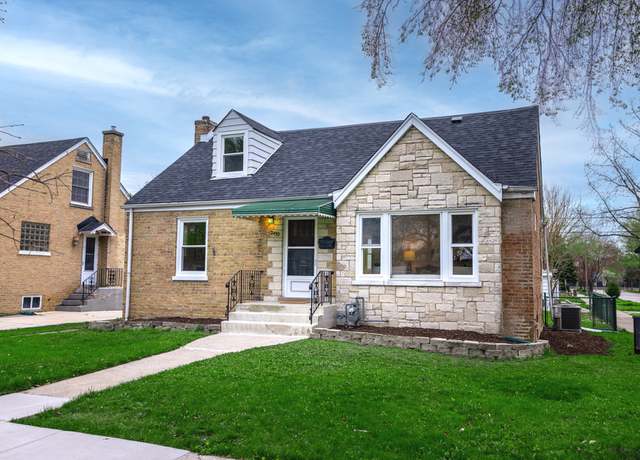
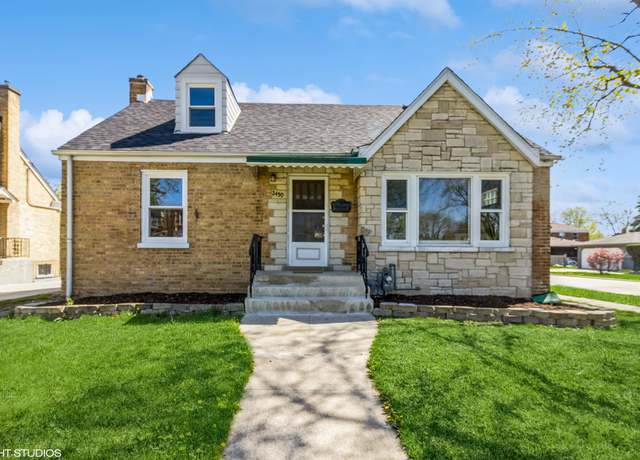
4530 Cracow Ave, Lyons, IL 60534
Based on information submitted to the MLS GRID as of Thu Apr 25 2024. All data is obtained from various sources and may not have been verified by broker or MLS GRID. Supplied Open House Information is subject to change without notice. All information should be independently reviewed and verified for accuracy. Properties may or may not be listed by the office/agent presenting the information.
School data is provided by GreatSchools, a nonprofit organization. Redfin recommends buyers and renters use GreatSchools information and ratings as a first step, and conduct their own investigation to determine their desired schools or school districts, including by contacting and visiting the schools themselves.Redfin does not endorse or guarantee this information. School service boundaries are intended to be used as a reference only; they may change and are not guaranteed to be accurate. To verify school enrollment eligibility, contact the school district directly.
Transportation in Brookfield, Illinois is highly accessible, with a variety of options for residents. The town experiences moderate traffic levels, making driving by car a convenient option for many. Public transportation is available, with Metra commuter rail service providing easy access to downtown Chicago. Additionally, Brookfield is conveniently located near several major highways, including Interstates 55 and 290, facilitating efficient travel in and out of the area. Learn more on our Brookfield city guide.
What types of properties are available in Brookfield?
Brookfield, Illinois offers a variety of single-family home types, including ranch-style homes, split-level homes, and contemporary-style homes. These homes can be found throughout the village, with many located in established neighborhoods and newer developments. Most properties feature 2 to 4 bedrooms and were built in various years. To explore different property types for sale in Brookfield, Illinois, use the 'Home type' filter located above the active listings. Customize your search by selecting options like single-family homes, condos, townhomes, and more.
What is life like in Brookfield?
Brookfield, Illinois offers a peaceful and serene living environment with a beautiful natural landscape. The region experiences a range of weather conditions, including warm summers and cold winters, providing residents with a diverse climate. The area boasts a variety of job opportunities across different industries, ensuring a vibrant and dynamic economy. Residents can engage in a wide array of recreational activities, such as exploring local parks, engaging in outdoor sports, and visiting various entertainment venues. There is a strong sense of community, with numerous local events and gatherings that foster connections among residents.
What are the schools and amenities like in Brookfield?
Brookfield, Illinois boasts a variety of public amenities for its residents. This includes a range of dining options, with numerous restaurants offering diverse cuisines. Outdoor enthusiasts will appreciate the well-maintained parks for recreational activities. For your daily necessities, there are several grocery stores available throughout the town. Additionally, Brookfield offers more amenities such as schools, libraries, and healthcare facilities, ensuring all resident needs are met within the town's boundaries.
In the past month, 11 homes have been sold in Brookfield. In addition to houses in Brookfield, there were also 3 condos, 1 townhouse, and 5 multi-family units for sale in Brookfield last month. Brookfield is a moderately walkable city in Cook County with a Walk Score of 61. Brookfield is home to approximately 18,830 people and 3,704 jobs. Find your dream home in Brookfield using the tools above. Use filters to narrow your search by price, square feet, beds, and baths to find homes that fit your criteria. Our top-rated real estate agents in Brookfield are local experts and are ready to answer your questions about properties, neighborhoods, schools, and the newest listings for sale in Brookfield. Our Brookfield real estate stats and trends will give you more information about home buying and selling trends in Brookfield. If you're looking to sell your home in the Brookfield area, our listing agents can help you get the best price. Redfin is redefining real estate and the home buying process in Brookfield with industry-leading technology, full-service agents, and lower fees that provide a better value for Redfin buyers and sellers.


 REDFIN IS COMMITTED TO AND ABIDES BY THE FAIR HOUSING ACT AND EQUAL OPPORTUNITY ACT. READ REDFIN'S FAIR HOUSING POLICY AND THE NEW YORK STATE FAIR HOUSING NOTICE.
 United States
 Canada