Welcome to your dream colonial home inside the Beltway, conveniently close to forest Glen metro for easy access throughout the DMV! This stunning property offers the perfect blend of classic charm and modern convenience. Step inside this spacious colonial boasting 4 bedrooms and 2.5 baths, where elegance meets functionality. The kitchen is a chef's delight with granite countertops and sleek stainless-steel appliances, ideal for preparing meals and entertaining guests with ease. The kitchen has a pleasant breakfast area beside the french doors opening to the rear garden, perfect for starting off your morning in the best way possible! The living room has a wood burning fireplace while the fo
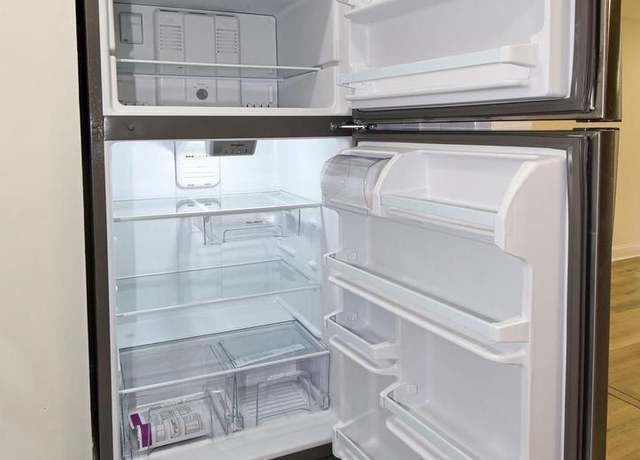
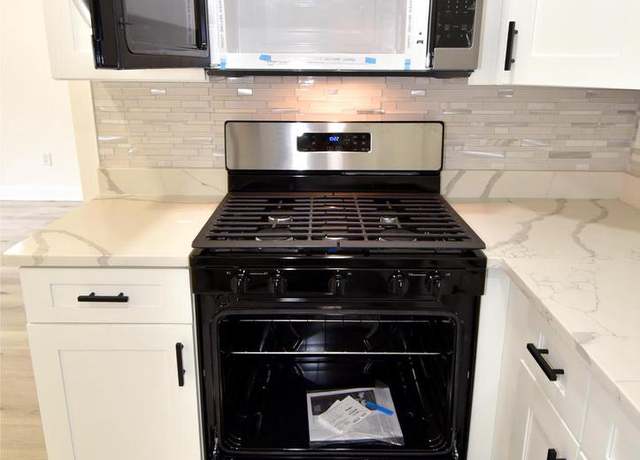
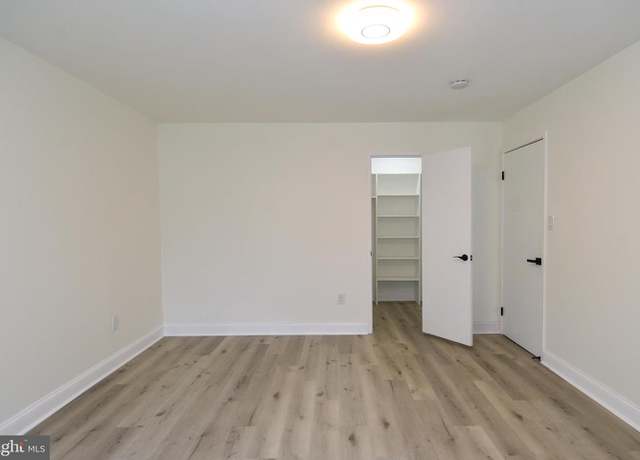
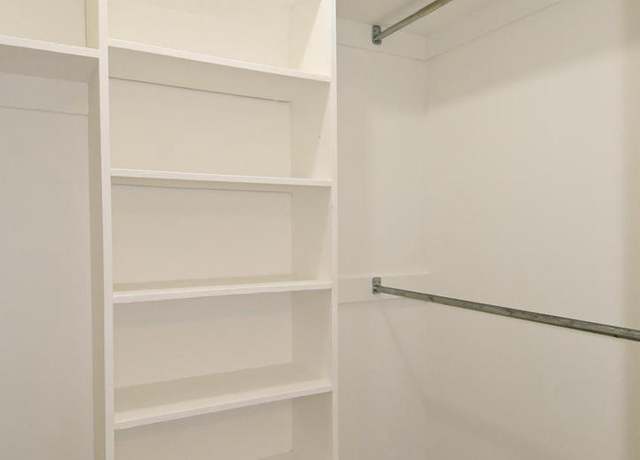
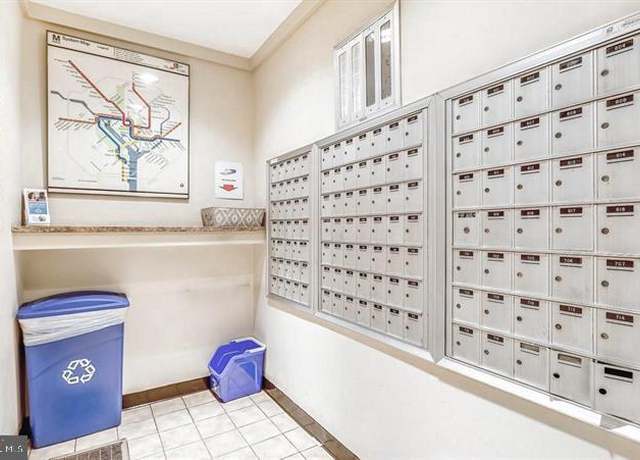
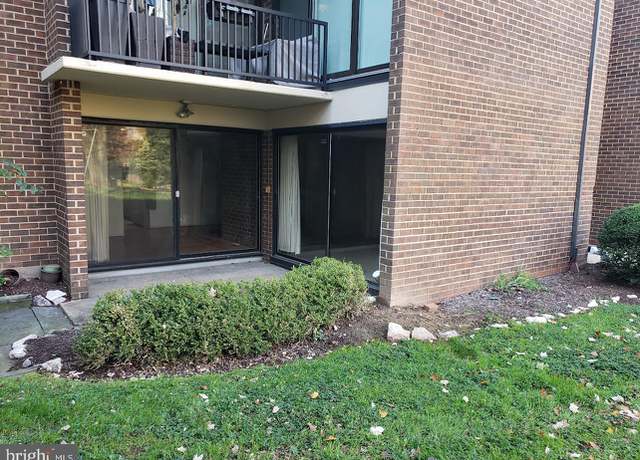
Welcome to this newly renovated 1 bedroom /1 bathroom condo. This unit was spared no expense! Enjoy the open floorplan layout. Everything is brand new; Kitchen cabinets, quartz counter tops, high-end stainless steel appliances, GAS cooking, new bathrooms, new lighting, new vinyl flooring, and neutral-color paint. The large bedroom has a huge walk-in closet. This unit is located on the first floor and has one of the best views of the pool and beautiful, well-kept grounds. Enjoy your own outdoor space that will be sure to impress. All utilities (water, gas, electric) are included in the lower monthly condo fee in Americana Finmark. Common laundry close by. Plenty of parking spots available.
1/34
$219,900
1 bed1 bath775 sq ft
2005 Coleridge Dr Unit 13-102, Silver Spring, MD 20902
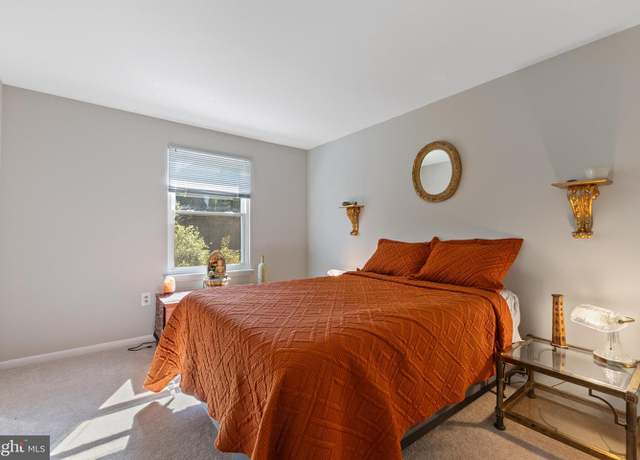
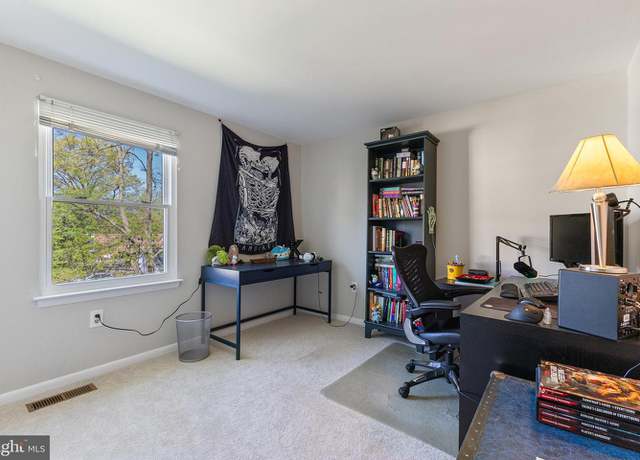
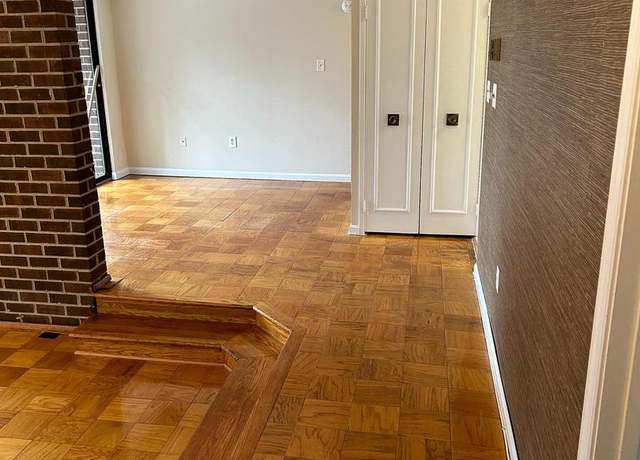
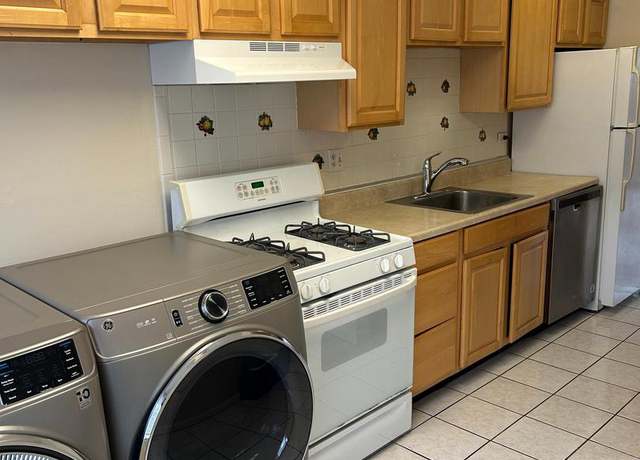
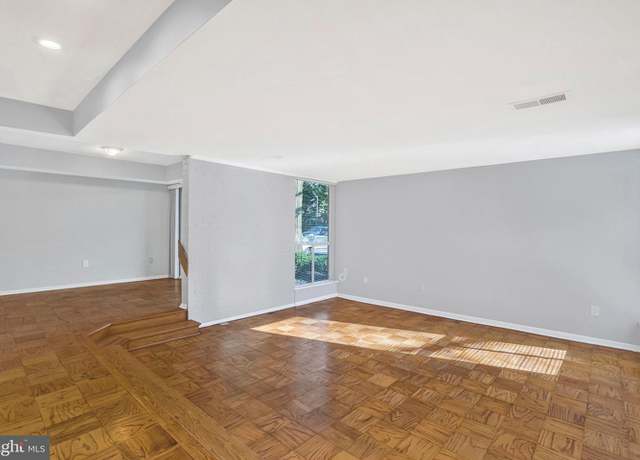
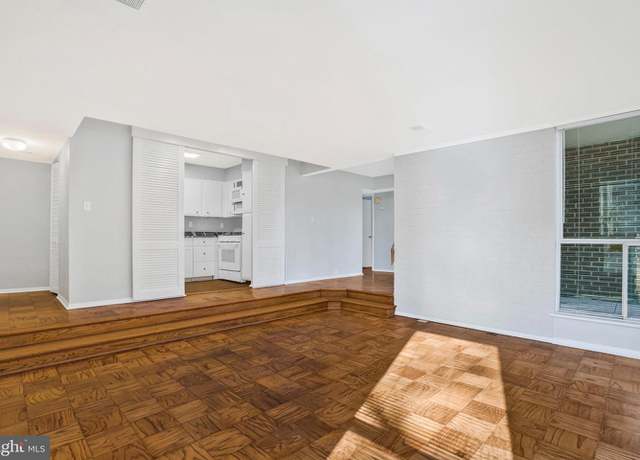
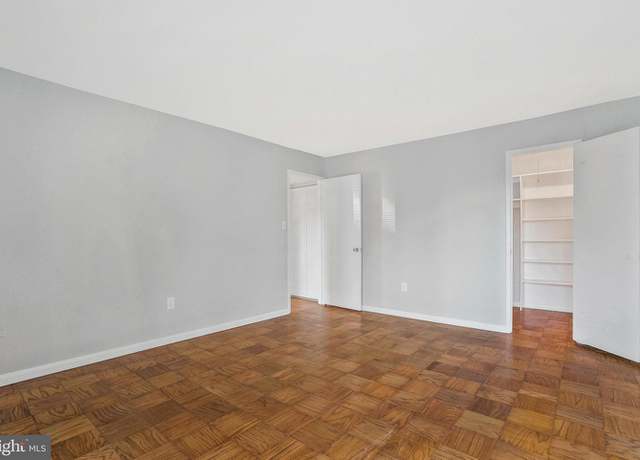
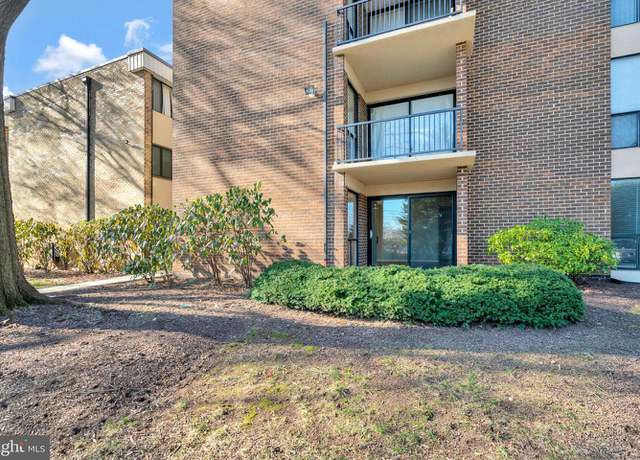
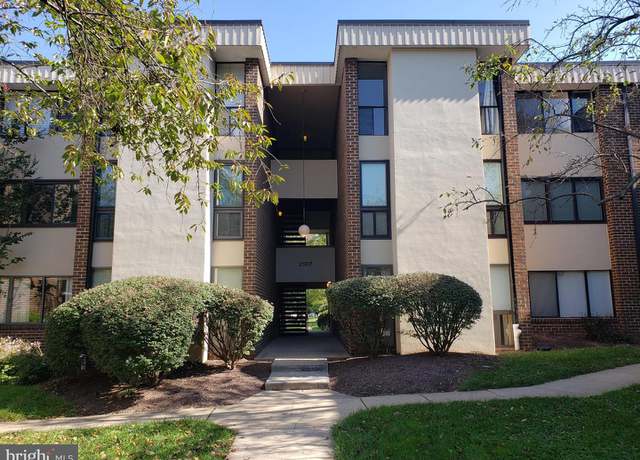
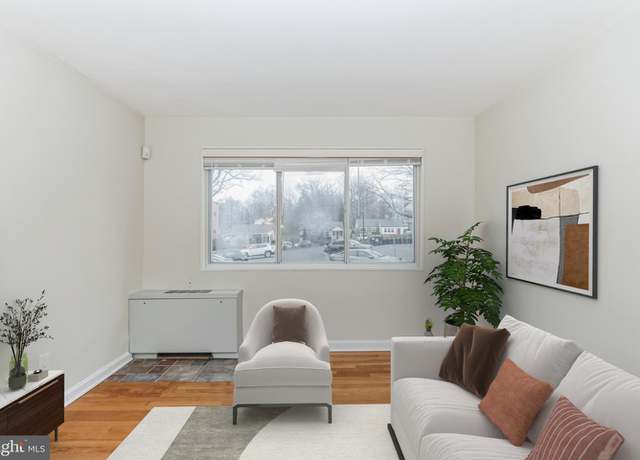
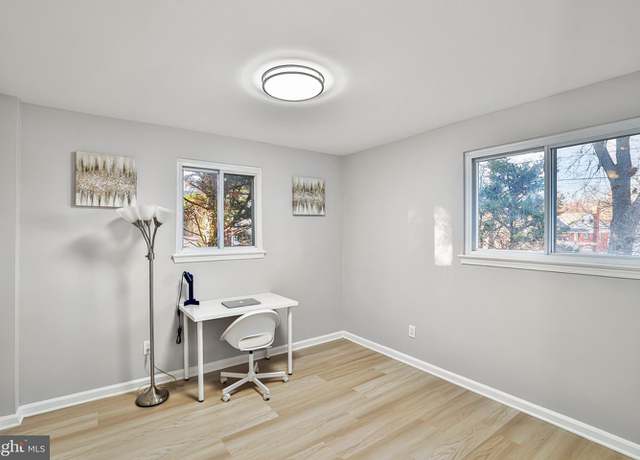
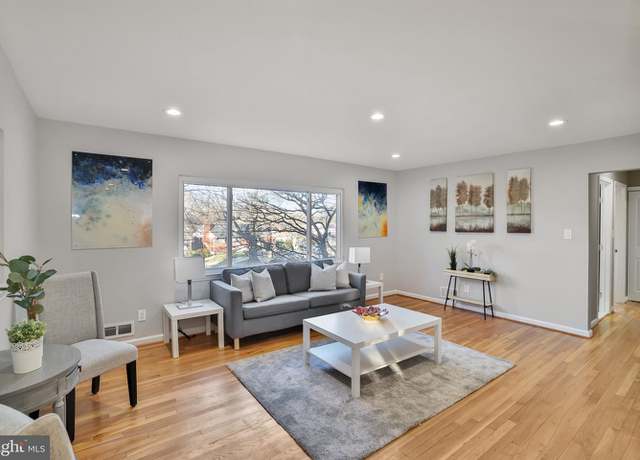
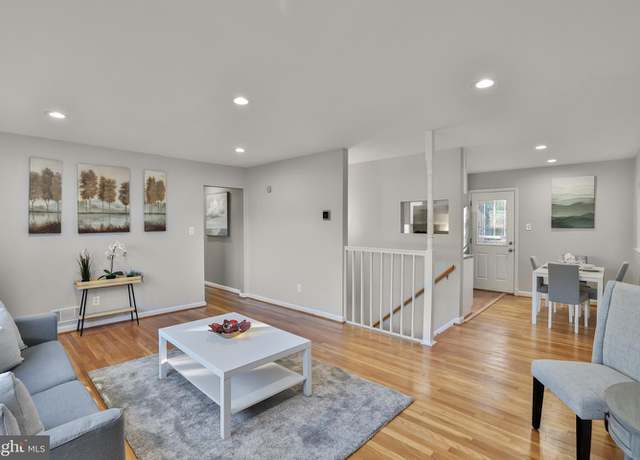
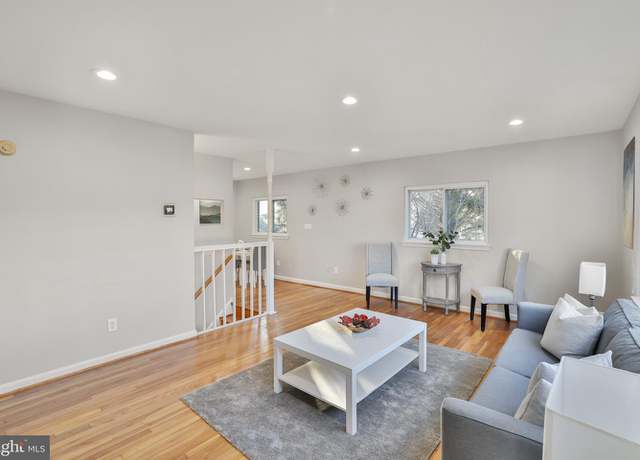
Get townhome size living with the conveniences and easy living of a condo! All utilities are covered in the condo fee. This over 1500 sq ft condo has very large size bedrooms with 2 of the 3 rooms include ensuites, a sunken living room with plenty of natural light shining through. The shiny and well taken care of parquet floors are in pristine condition. This unit is on the third level of this garden style condo community that includes a community pool, tennis court and a short distance to the metro stop Forest Glen. Come and make your own personal touches and enjoy the convenience of the washer and dryer inside the unit. This unit won't last.
1/15
$298,000
3 beds2.5 baths1,517 sq ft
2016 Coleridge Dr Unit 24-301, Silver Spring, MD 20902
Freshly remodeled 1-bedroom 1-bathroom condo. Featuring open floor plan, new kitchen cabinets with high quality quartz counter top, new stainless appliances, new bathrooms, new lightings, new flooring, new painting. All utilities (water, gas, electric) are included in the monthly condo fee. Plenty of parking spots available in parking lots. The lockbox is located on the unit’s front door. Located close to public transportation and highways.
1/41
$209,900
1 bed1 bath904 sq ft
9900 Georgia Ave Unit 27-405, Silver Spring, MD 20902
Condo ready to move in and call home. 1-bedroom unit with hardwood floors throughout. Updated kitchen featuring granite counters, white cabinetry and stainless-steel appliances. A spacious primary bedroom with a walk-in closet. All utilities : gas, electricity, water and trash are included in the condo fee. Great location, next to the Forest Glen Metro (Red Line), there is a walking path accesible from the community to the station, minutes from I-495 Beltway.
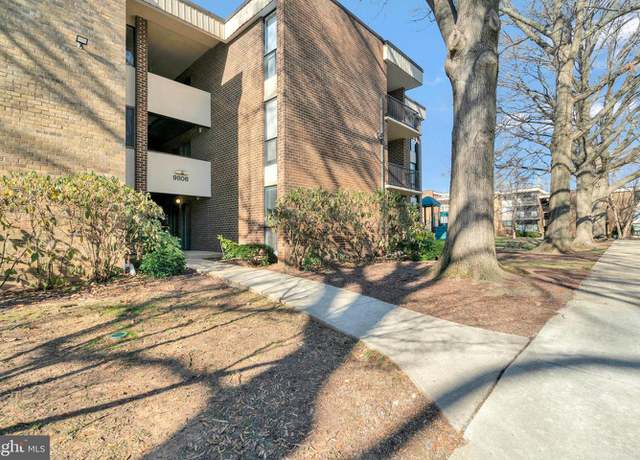
1/21
$179,900
1 bed1 bath775 sq ft
9806 Georgia Ave Unit 22-103, Silver Spring, MD 20902
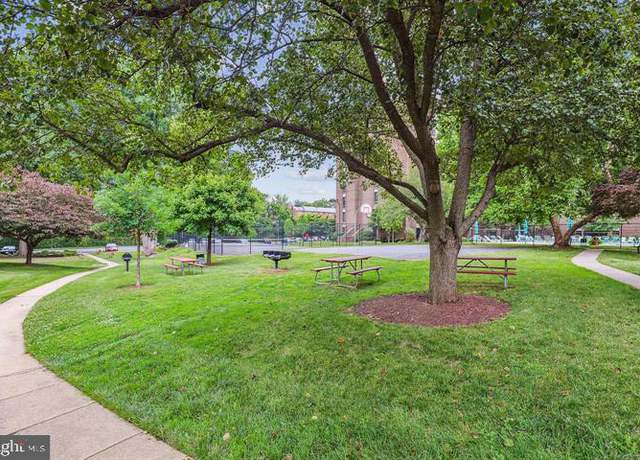
Don't Miss this Lovely Bright and Spacious Top floor condo. Separate dinning room, Large master bedroom, Kitchen w/ granite, new baths, refinished wood floors . Condo fee includes all utilities except cable and phone. Walking distance to Forest Glen Metro and Sligo Creek Trail, and close to Holy Cross Hospital. Less than 2 miles from downtown Silver Spring and Wheaton Mall. Community amenities include an outdoor pool, tennis courts, a dog park, a basketball court, and picnic/grilling locations throughout the community. Hurry! .
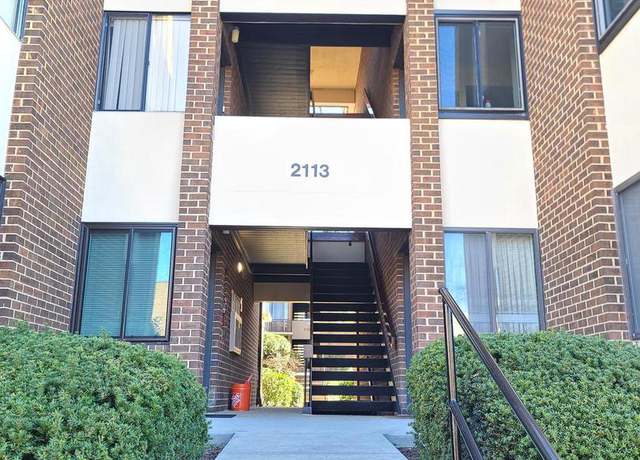
1/47
$269,000
2 beds2 baths1,047 sq ft
2113 Walsh View Ter Unit 9-301, Silver Spring, MD 20902
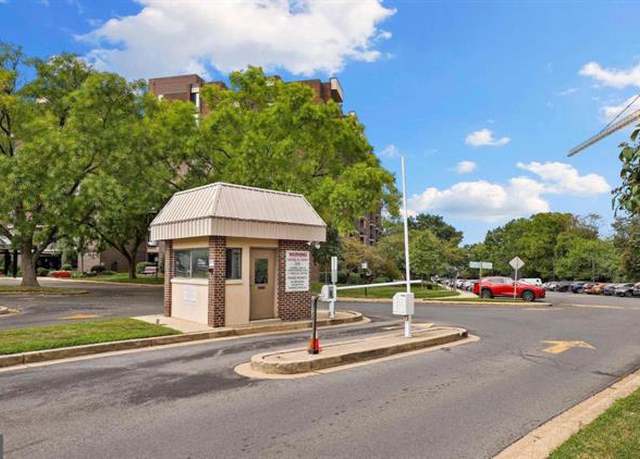
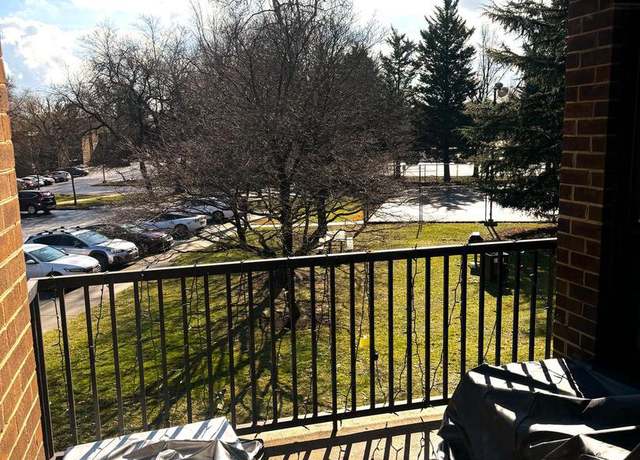
This exquisite 1-bedroom condo, located near the Forest Glen Metro, offers the perfect blend of convenience and luxury. Nestled within a secure gated community, you'll experience the tranquility of suburban living with the perks of city accessibility. Indulge in the worry-free lifestyle with ample parking, ensuring you always have a spot waiting for you. But that's not all – this community goes above and beyond with its amenities. Take a dip in the sparkling swimming pool, perfect for unwinding after a long day, or challenge friends to a game on the basketball court for some friendly competition. One of the most attractive features? CONDO FEE includes ALL UTILITIES(except internet) an
1/9
$169,900
1 bed1 bath775 sq ft
2101 Walsh View Ter Unit 17-203, Silver Spring, MD 20902
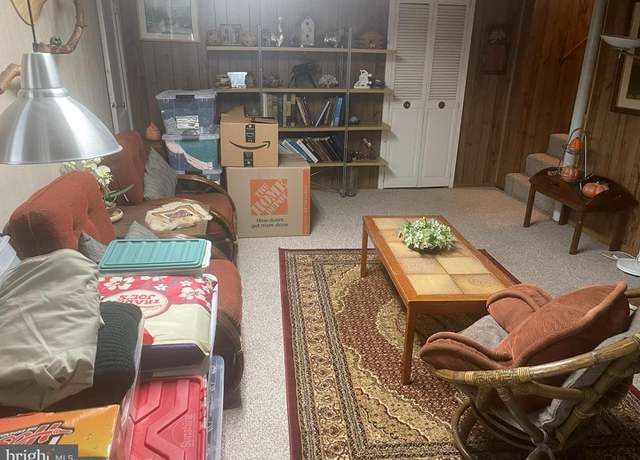
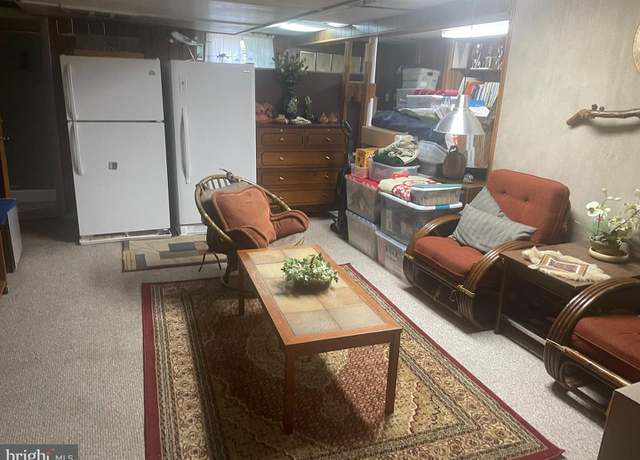
Garden Level Condominium in Americana Finmark Community! Investor Special!! Property" Sold As IS". Features Kitchen with Appliances with Separate Dining Room and Two Bathrooms. Spacious Oversized Living Room. Large Windows provides Natural Lighting. Primary Bedroom is Spacious with Walk In Closets and Plenty of Storage. Secondary and Third Bedrooms a Good Size with plenty of Closet Space . Condo fee Includes Heat, Air Conditioning, Gas, Electricity, Exterior Building Maintenance, On Site Maintenance Personnel, Snow Removal, & Trash. Gated Community Rich in Amenities, including a Community Pool, Basketball/Tennis Courts, Picnic Tables, BBQ Grills, Benches, Tot Lot, Community
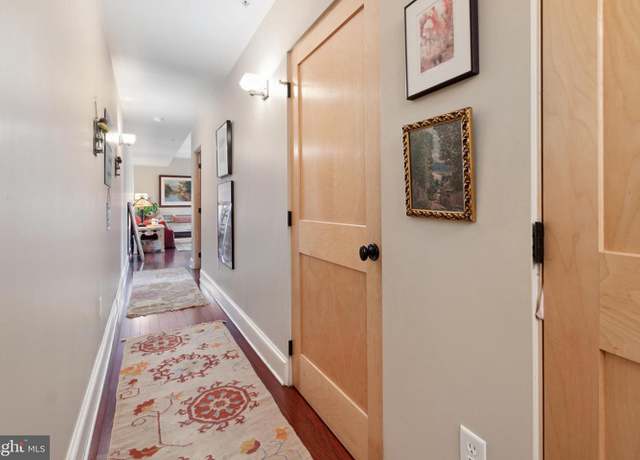
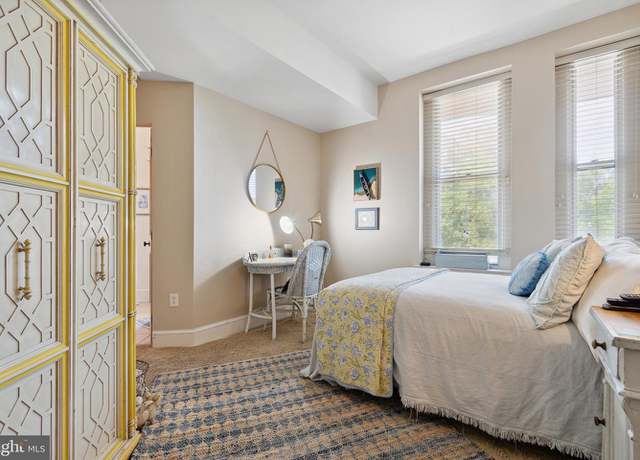
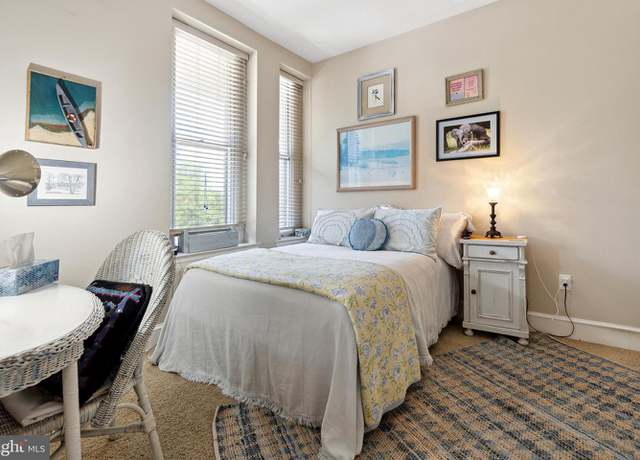
As you enter into this charming 1-bedroom, 1-bathroom condominium nestled in the heart of Silver Spring, Maryland you will be greeted by a gorgeous open floor plan. This inviting residence offers the perfect blend of comfort and convenience. Step into a spacious living area adorned with natural light, creating a warm and welcoming ambiance. The well-appointed kitchen features appliances and counter space, catering to culinary enthusiasts. The bedroom is perfect for a King or Queen size bed. This condominium offers a relaxed lifestyle. Located in a vibrant community, it's moments away from shops, dining, and easy access to major highways, making it an ideal place to call home. Come and exper
1/12
$145,000
1 bed1 bath600 sq ft
9730 Glen Ave Unit 104-97, Silver Spring, MD 20910
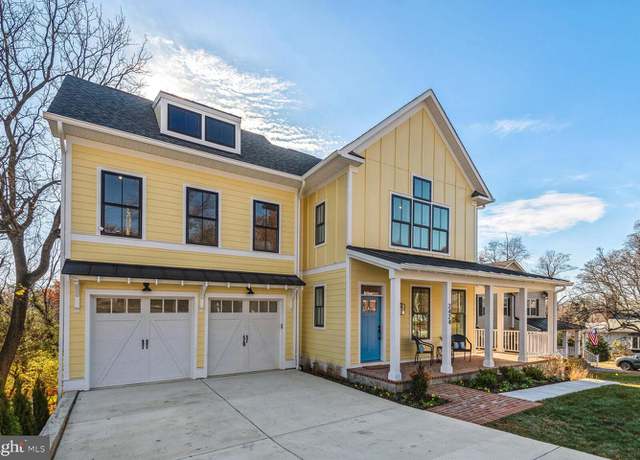
REDUCED. 4/12 NEW HOME - Multi-Generational Floor plan . Just 610 Steps to METRO Station entrance. 5200 SF, Total of 6 Bedrooms 5 and1/2 baths. The lower level sun filled suite is over 1200 SF and includes 2 Bedrooms. A very special home in a charming historic Forest Glen. Features include stone wrap around front porch with standing seam metal roof, 2 door 2 car garage, Hardiplank siding and an amazing Island kitchen (Quartz/Thermador Prof Range/walk in Pantry). This is just 3 blocks to the Red Line METRO Station. Historic Forest Glen is at the high point between Rock Creek and Sligo Creek parks and stream valleys. This house has great views out the front to historic St. Johns Church. Call
3 Recorded Lots in Historic Forest Glen. Just 3 Blocks to the METRO Station. The Historic House is not included in the price. NOTE: 7' SIDE YARD SET BACKS. Lots 7 and 8 are 50' x 200' The Corner Lot12 is 12.75' on Holman, 217' on Hollow Glen and 99' deep on the south side. A sketch of buildable area is attached. Building permits will require a Historic Area Work Permit. Discuss this with Listing Agent if you have questions.
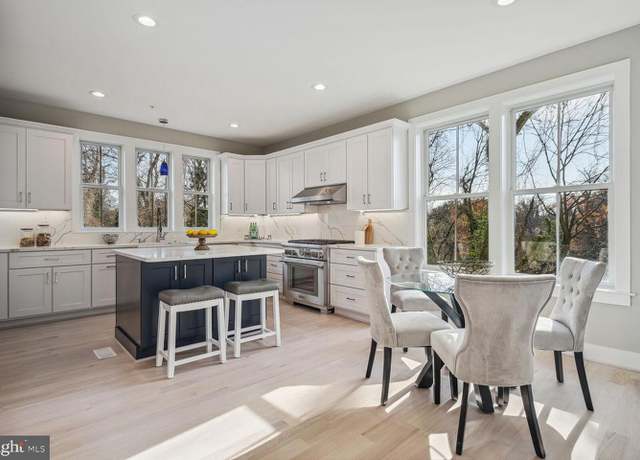
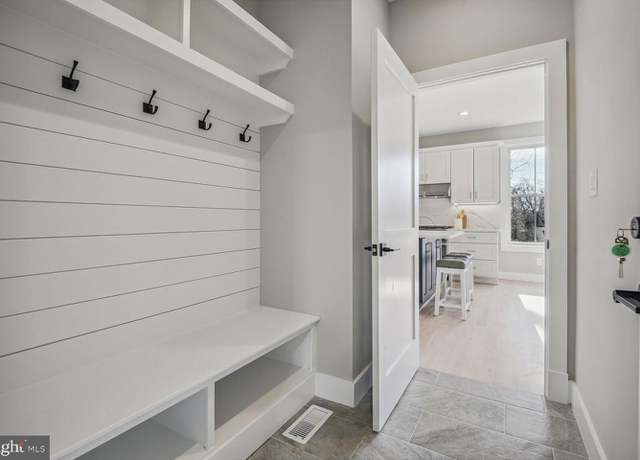
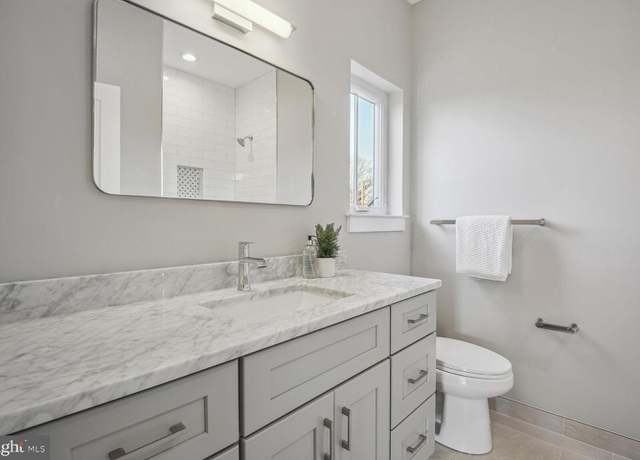
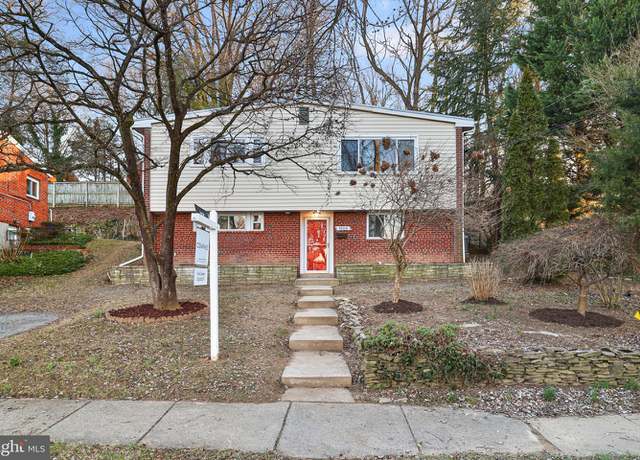
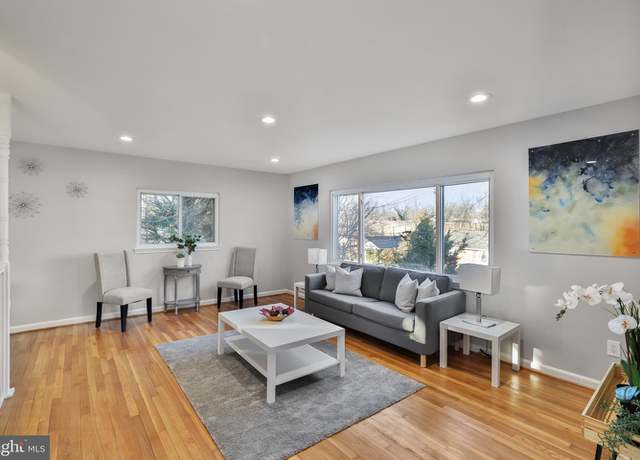
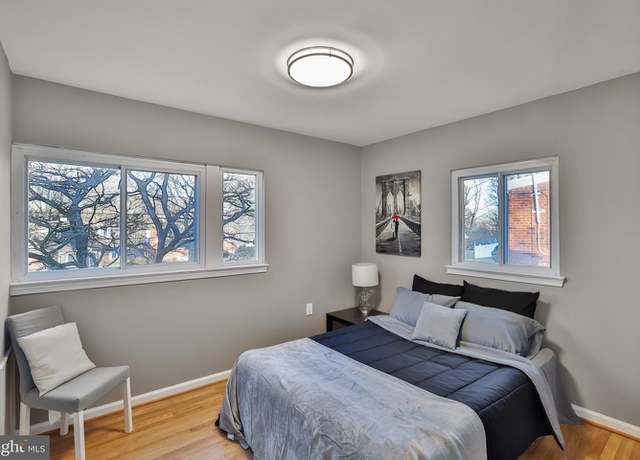
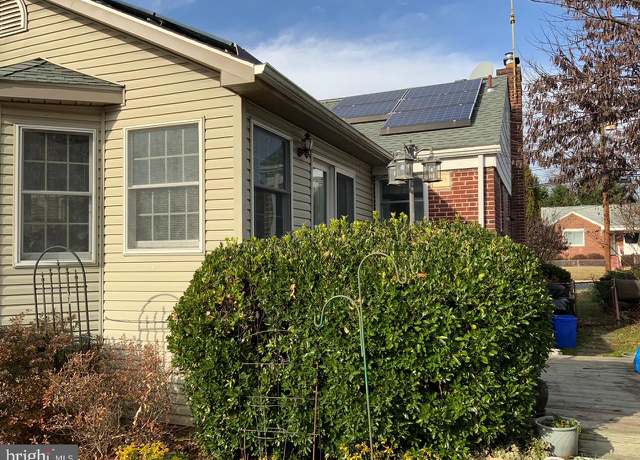
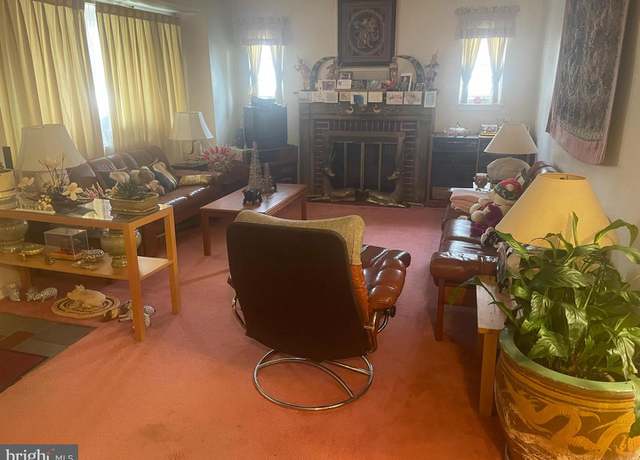
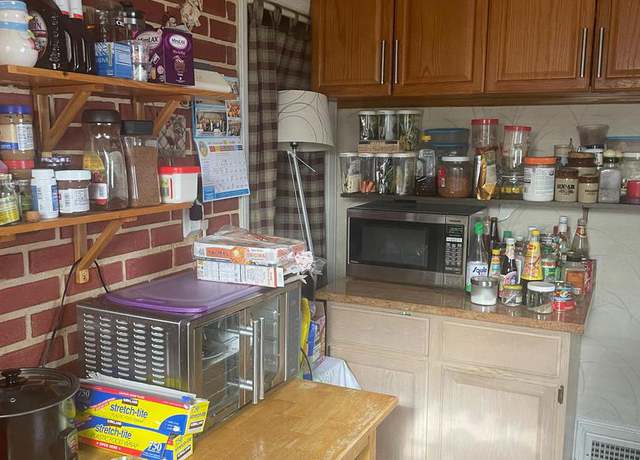
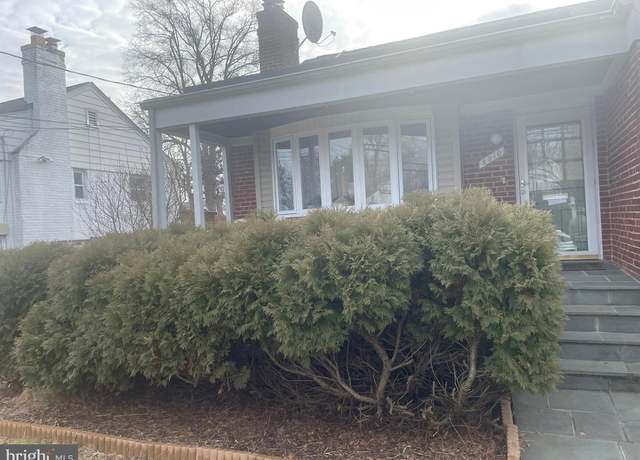
OPEN HOUSE - APRIL 27 2PM-4PM. This charming home has many great features! Located in one of the best Silver Spring locations in Sunset Terrace with no HOA fees. It’s only minutes away from family friendly parks, playgrounds, bike trails and a Golf Course nearby. It is conveniently located within walking distance of the Forest Glen Metro, Holy Cross Hospital, and a short distance drive to the beltway, shopping malls, Costco, downtown Silver Spring, and many other amenities. This home is move-in ready and comes with a BRAND NEW Gas Range w/ Griddle, Dishwasher, Dryer, Window Blinds, Mosaic Wall Tile, Bathroom Renovation, and Basement Flooring. Other items like the washer, water heater
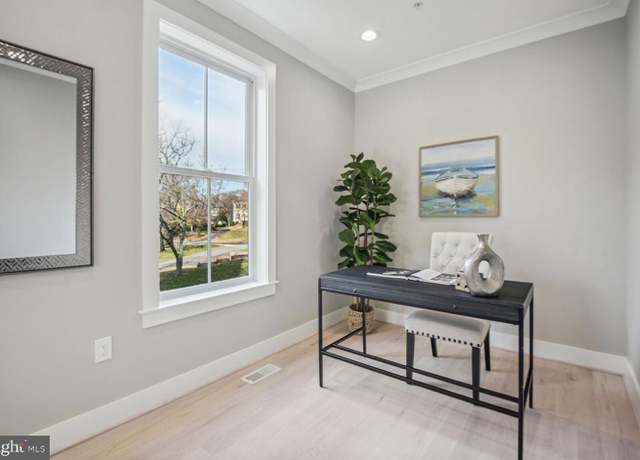
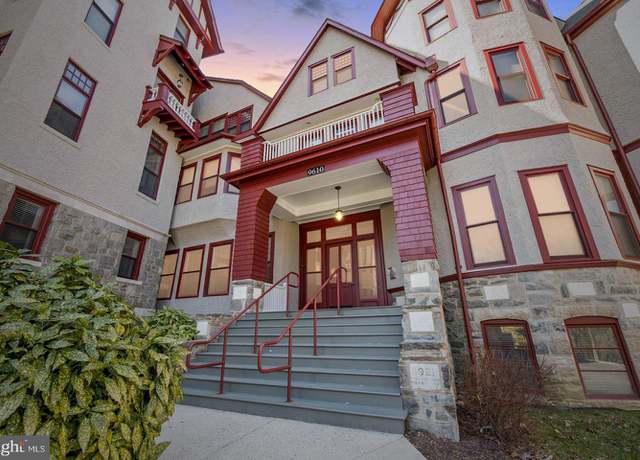
Discover a wealth of sought-after amenities at National Park Seminary, a community rarely rivaled in its offerings. Nestled alongside the picturesque trails and paths of Rock Creek, this pet-friendly enclave offers an unparalleled connection to nature right at your doorstep. Step into history as you enter the iconic Main Building, home to SH 204. This 1223-square-foot gem on the 2nd floor exudes charm and character from the moment you walk in. The kitchen and living area boast a bright, airy atmosphere with ample space for gatherings, highlighted by a wall of windows and lofty ceilings. Retreat to the bedroom wing for ultimate privacy, perfect for residents, guests, or a dedicated home offi
1/24
$425,000
2 beds1 bath1,223 sq ft
9610 Dewitt Dr Unit SH204, Silver Spring, MD 20910
Truly, a one -of-a-kind 2 bedroom, 2 bathroom condo plus 3 bonus rooms hidden behind an unassuming corner bookcase lies a captivating secret passage, unveiling a three-level bonus room that transcends the ordinary. This versatile space effortlessly adapts to different needs serving as a den for relaxation, a guest quarters for overnight visitors, or even a home office for remote work endeavors. Custom designed antiqued mirror and marble fireplace in living room, Extra large storage space (inside the condo), designer tiled primary bath, a dedicated parking spot in garage, washer/dryer in condo, newer windows, furnace, hot water heater, new hardwood flooring, new carpet, freshly painted. Lux
Indulge in refined living at 1606 Lansdowne Way, Silver Spring, MD 20910. This impeccably renovated and maintained residence boasts 4 spacious bedrooms and 2 baths, adorned with freshly painted interiors and meticulously restored hardwood flooring. The upgraded kitchen elevates culinary experiences, featuring modern amenities and stylish finishes. Nestled minutes away from downtown Silver Spring, metro access, shopping districts, hospitals, and major routes, this property seamlessly combines convenience with sophistication. Embrace the opportunity to call this meticulously curated house your home.
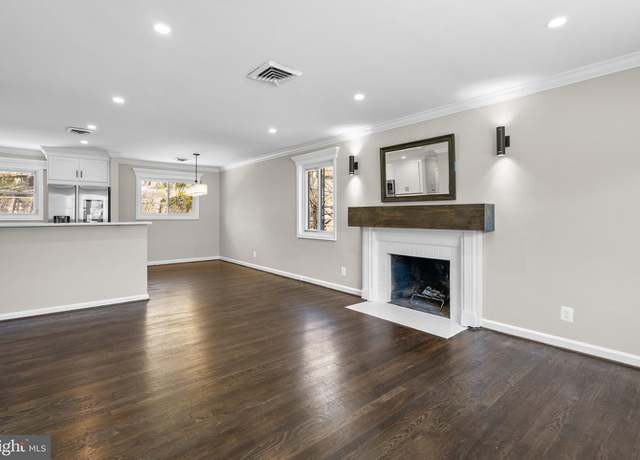
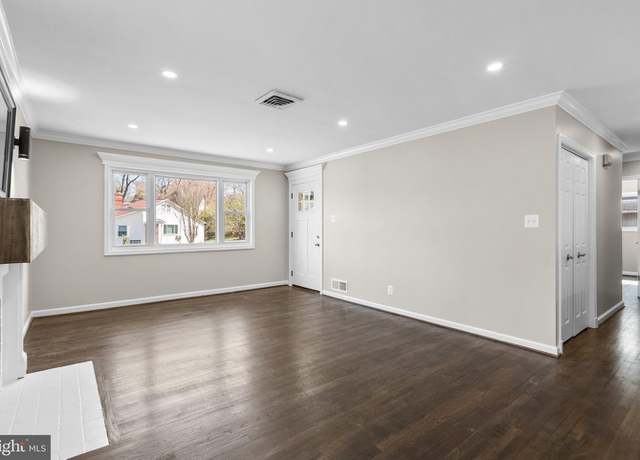
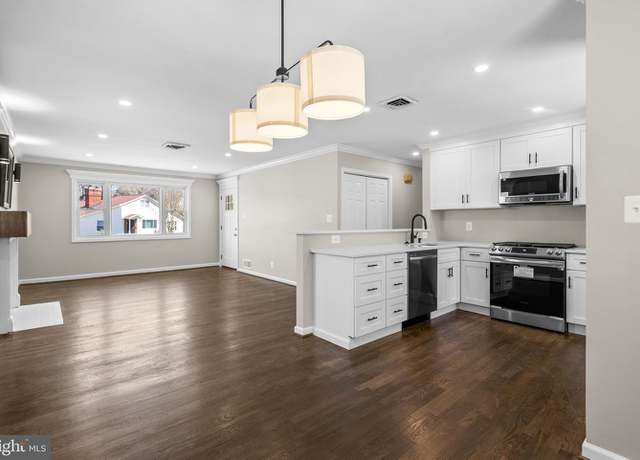
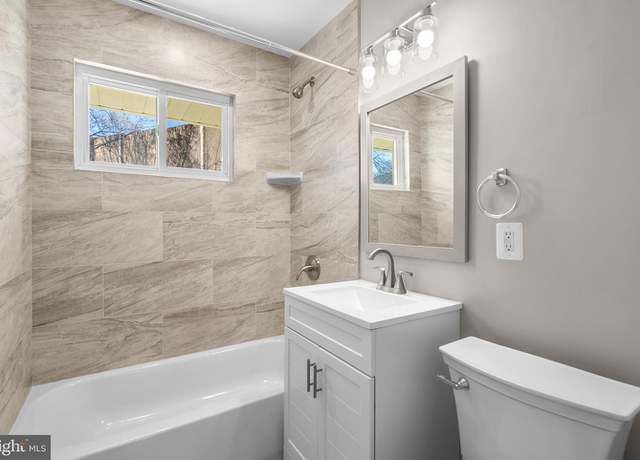
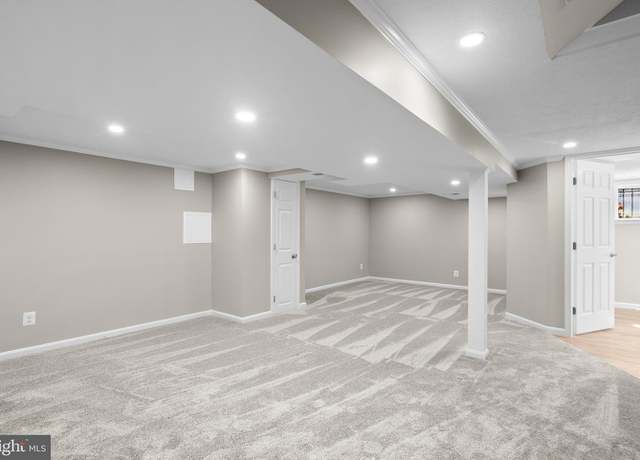
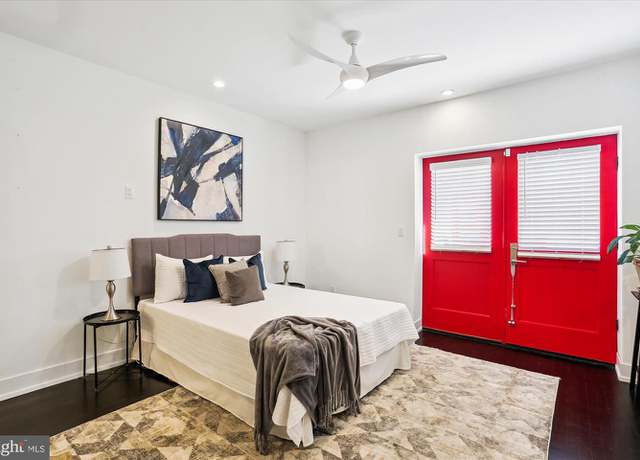
Fully renovated from top to bottom in 2024, this move-in-ready home blends modern convenience with elegant living and is located 1 mile from Forest Glen Metro Station. Enjoy a kitchen equipped with all-new stainless steel appliances, including a smart fridge and gas cooking, set against quartz countertops, complemented with brand-new, all-white cabinets and extensive crown molding throughout, adding a touch of sleek sophistication. The open-concept main level shines with freshly refinished hardwood floors, a completely updated bathroom, and a cozy fireplace, all under the glow of recessed lighting. Upstairs, comfort meets style with ceiling fans in every bedroom, while the lower level prese
Price Improvement. Welcome to the National Park Seminary Condominium, a historic building offering a unique blend of modern amenities and historical charm. This captivating community is surrounded by idyllic grounds and is in close proximity to Rock Creek Park, providing access to numerous walking trails. The unit itself boasts a contemporary layout with 2 bedrooms and 2.5 bathrooms, in addition to an in-unit washer and dryer, original hardwood floors reclaimed from the building's rich history, and upgraded finishes. The kitchen features top-of-the-line appliances, including a Bertazonni gas range, and a quartz countertop. Generous parking includes two surface parking spaces. In addition, s
Welcome to your new home at National Park Seminary that offers the perfect blend of comfort, convenience, and community. This exquisite home boasts an array of features that cater to both luxury and practicality. Step inside and be greeted by the warm allure of beautiful hardwood floors that run throughout the residence. The kitchen is a culinary haven, adorned with top-notch stainless steel appliances. Notably, the appliances have been thoughtfully upgraded to include a Kitchen Aid microwave/convection oven and an LG refrigerator, ensuring that every meal preparation is a breeze. Breathe easy with the state-of-the-art Air Knight air purification, filtration, and ultra-violet sterilization
School data is provided by GreatSchools, a nonprofit organization. Redfin recommends buyers and renters use GreatSchools information and ratings as a first step, and conduct their own investigation to determine their desired schools or school districts, including by contacting and visiting the schools themselves.Redfin does not endorse or guarantee this information. School service boundaries are intended to be used as a reference only; they may change and are not guaranteed to be accurate. To verify school enrollment eligibility, contact the school district directly.
Forest Glen, Maryland boasts a well-connected transportation network, making it a convenient location for residents who prefer driving their cars. The area experiences moderate traffic levels, ensuring a smooth driving experience for most of the day. Public transportation is also readily available, with the Forest Glen Metro Station providing easy access to the wider D.C. metropolitan area. Additionally, Forest Glen is conveniently located near the Capital Beltway, a major highway that encircles Washington, D.C., offering quick access to various parts of Maryland and beyond.
What types of properties are available in Forest Glen?
Forest Glen, Maryland offers a variety of single-family home types, including ranch-style homes, split-level homes, and contemporary homes, among others. These homes can be found throughout the neighborhood, with some located near the Forest Glen Metro Station and others nestled in the quiet residential streets. Most properties in Forest Glen, Maryland feature 3 to 4 bedrooms and were built in the 1950s to 1970s. To explore different property types for sale in Forest Glen, Maryland, use the 'Home type' filter located above the active listings. Customize your search by selecting options like single-family homes, condos, townhomes, and more.
What is life like in Forest Glen?
Forest Glen, Maryland offers a serene and picturesque environment with lush greenery and a variety of natural landscapes. The region experiences a range of weather conditions throughout the year, providing residents with diverse seasonal experiences. The area boasts a thriving job market with a wide range of employment opportunities in various industries. Residents can engage in a multitude of recreational activities, including outdoor sports, cultural events, and community gatherings. Forest Glen, Maryland is a vibrant and dynamic community that fosters a sense of belonging and encourages residents to explore and engage with their surroundings.
What are the schools and amenities like in Forest Glen?
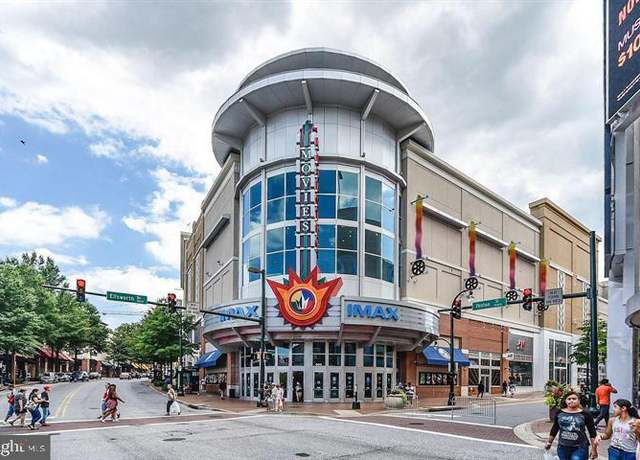
Forest Glen, Maryland offers a variety of public amenities to enhance your living experience. You'll find a well-stocked grocery store for all your daily needs. Dining options are also available with a restaurant serving a variety of cuisines. Outdoor enthusiasts will appreciate the park, perfect for leisurely walks or picnics. Additionally, other amenities such as a library, post office, and community center are available for residents' use.
In the past month, 2 homes have been sold in Forest Glen. In addition to houses in Forest Glen, there were also 11 condos, 1 townhouse, and 0 multi-family units for sale in Forest Glen last month. Find your dream home in Forest Glen using the tools above. Use filters to narrow your search by price, square feet, beds, and baths to find homes that fit your criteria. Our top-rated real estate agents in Forest Glen are local experts and are ready to answer your questions about properties, neighborhoods, schools, and the newest listings for sale in Forest Glen. Our Forest Glen real estate stats and trends will give you more information about home buying and selling trends in Forest Glen. If you're looking to sell your home in the Forest Glen area, our listing agents can help you get the best price. Redfin is redefining real estate and the home buying process in Forest Glen with industry-leading technology, full-service agents, and lower fees that provide a better value for Redfin buyers and sellers.


 REDFIN IS COMMITTED TO AND ABIDES BY THE FAIR HOUSING ACT AND EQUAL OPPORTUNITY ACT. READ REDFIN'S FAIR HOUSING POLICY AND THE NEW YORK STATE FAIR HOUSING NOTICE.
 United States
 Canada