Welcome to this exquisite all-brick home, nestled on nearly 2 acres of pristine land, where luxury meets meticulous attention to detail. With 5 bedrooms and 5 full bathrooms, this property is designed for both comfort and grandeur, offering an idyllic space for entertaining. Step inside to discover a wealth of upgrades that enhance every corner of this home. From the elegant Brazilian cherry floors to the designer bathrooms and gourmet kitchen boasting Wolf appliances and high-end granite countertops, every detail speaks of quality and refinement. The main level features a versatile office/study, a cozy family room complete with a fireplace, and a sunroom where you can bask in the natural l
Welcome to 10651 Chadwell Ct! Discover the epitome of comfort, style, and convenience in this exquisite colonial home. Boasting nearly 6,000 sq ft of living space, it sits on a private cul-de-sac, occupying nearly an acre of fully fenced, flat land. Perfectly positioned, it offers easy access to shops, restaurants, parks, and commuter routes, ensuring a lifestyle of seamless enjoyment. Freshly manicured landscaping leads you to the front door where you are greeted with a beautiful 2-story foyer with new light fixtures, stylish Benjamin Moore paint, arched hallways and rich hardwood floors. The bright living room flows seamlessly into the spacious office with plantation shutters. Separate di
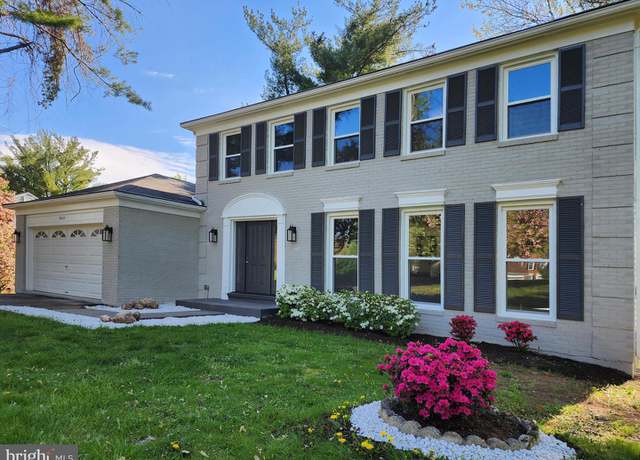
Welcome to this exquisite custom renovation nestled in the prestigious Foxvale Farm community. No detail was overlooked in refurbishing this magnificent 4-bedroom, 3.5-bath colonial home, situated on a spacious 0.5-acre lot. Upon entry, you'll be greeted by an open and airy floor plan adorned with brand-new 10” wide hardwood floors that seamlessly flow throughout the main and upper levels. The home is bathed in natural light from the abundance of new windows, illuminating the sleek design and modern finishes at every turn. The heart of the home, the chef’s kitchen, has been meticulously expanded and upgraded with new 42” cabinets, premium Quartz countertops, Kitchen Aid st
Incredible 5 acre scenic estate in Great Falls sited at the very end of a private road! 16,000+ interior SF including the main house, detached garage and studio, and log cabins. Large swimming pool and built-in outdoor kitchen. The main house features high ceilings, large format rooms, impressive window/ door package with gorgeous views of the land, walkout access to the rear deck and garden, and attached garage. The detached 4-car garage includes a studio space with full kitchen and full bath above.
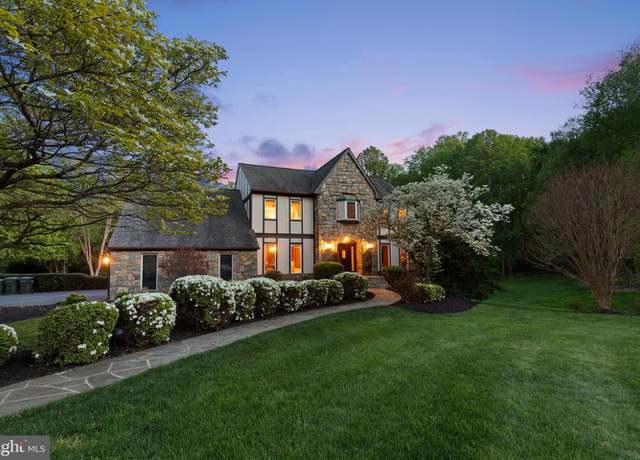
Welcome to this exquisite English Tudor home, meticulously constructed with authentic building stone and adorned with timeless elegance. Nestled at the end of a tranquil cul-de-sac on a sprawling, level lot, this property boasts meticulous landscaping featuring vibrant Dogwood and Azalea blooms. Step into the expansive rear yard, cleared and perfect for recreational activities like soccer or football. Enjoy the serene ambiance complemented by a charming water feature and a spacious Trex deck, ideal for outdoor entertaining. Upon entry, be greeted by a marble center hall, leading to a large dining room, showcasing hardwood floors, intricate crown molding, and distinguished chair and wainscot
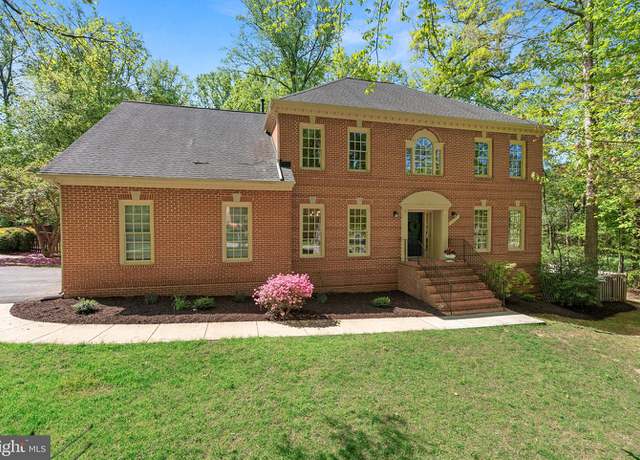
Join us this Sunday, April 28th, from 1-3pm for an Open House. Introducing 9304 Fitz Folly Dr, an impressive brick colonial situated on 1.73 beautifully landscaped acres backing to trees. Incredible location in the heart of Great Falls, tucked away on a quiet cul-de-sac off River Bend Road. This meticulously maintained home features many upgrades throughout including hardwood floors, crown molding and trim, custom windows, recessed lighting, 4 fireplaces and more. You're going to fall in love with the spacious layout - perfect for family time and entertaining alike. A separate dining room and front sitting room cater to more formal gatherings while the light filled two-story living room is
As you enter the driveway of this verdant and lush retreat situated on 1.6 acres imagine having your lawn party on a cool summer day. Pass by the three car garage with a side entry door and walk up the flagstone walkway to the covered flagstone porch and elegant wood front door. Gleaming hardwood flooring will greet you in t he 17 foot foyer along with recessed lighting, custom wainscot, chair rail. and crown moulding. Wide hallways lend a feeling of spaciousness and comfort with access to all the main level rooms. Leaving the entrance hall you can walk through a wide hallway with skylights which could be used as a caterer's hall for your entertaining. Access to the laundry room with ta
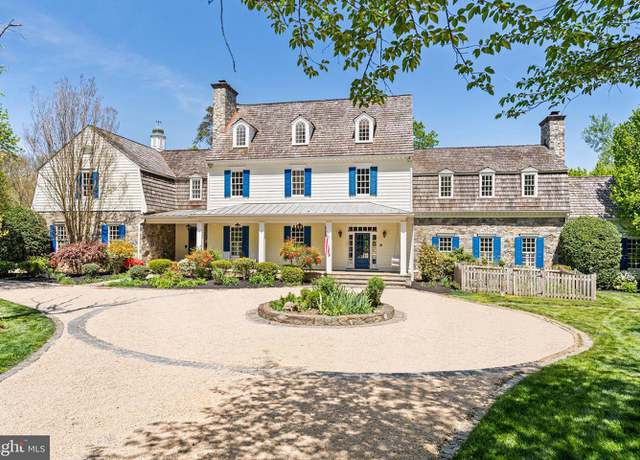
This enchanting French country estate is positioned prominently on the hilltop of a picturesque 1.73 acre site. Surrounded by mature landscaping and lush gardens, the main residence features five generous bedrooms, including a spacious primary suite with a separate sitting room and private terrace overlooking the gardens. The home is resplendent with luxurious amenities including multiple living and entertainment areas, 2 kitchens, an AGA range, Subzero refrigerators, Miele appliances, 6 fireplaces, a complete spa, Sonos sound system with 14 zones, and a home theater. A covered breezeway connects the main residence with the carriage house which includes a full kitchen, two bedrooms, a full
Experience daily luxury and an elevated lifestyle in one of Vienna’s most coveted communities! Picturesquely nestled in the exclusive neighborhood of Woodland Estates, this 4BR/3.5BA, 4,202 sqft residence (+2,058 sqft unfinished basement for total of 6,200+ sqft) evokes visions of grandeur with gorgeous colonial architecture, a traditional brick façade, and a neatly manicured 0.83-acre lot. Immaculately maintained and updated, the entertainment-ready interior dazzles with beautiful hardwood flooring, soaring foyer ceilings, an organically flowing layout, oversized windows, an expansive living room, an elegant formal dining room, and a dedicated office with French doors. Fashion
For your most discerning buyer, we present this unique 6200+sqft contemporary home with bespoke elegant finishes, enhanced by renowned architect Mark McIntarff, and lovingly renovated by the current owners. This gated 2 acre private oasis is nestled amidst towering trees and lushly landscaped with perennial gardens, koi ponds and waterfall with a sparkling pool as its centerpiece! A refined and sophisticated residence showcasing floor to ceiling windows in the soaring 18+ft ceiling Living and Family Rooms, this home boasts natural unstained cherry floors throughout, an all Miele appliance kitchen with custom cabinetry and 6 bedrooms, with the Primary Bedroom Suite on the top level. Radian
Welcome to the beautiful house 1150 Kettle Pond Ln, a stunning residence nestled in the prestigious Great Falls. This home has 4 bedrooms and 2.5bathrooms, 2Car Garage within its spacious 26,731square feet and Private backyard with gorgeous deck, across the street from HOA parkland, the residence, The current property is in great condition. DON'T MISS THIS OPPORTUNITY TO LIVE IN GREAT FALLS!
Thank you for your interest in 648 Deerfield Farm Court. Please contact Joanna Banks to set up all appointments. There is no lockbox. This listing is by appointment only and Listing agent will accompany you. Please see offer instructions in Documents Section & email your offer to listing agent and send a text to Joanna to confirm receipt. Thank you! Welcome to an exceptional entertainer's paradise nestled in the heart of Great Falls, Virginia. Presenting 648 Deerfield Farm Court, a meticulously designed custom French Colonial residence built by Hans Schmit and Winthrop Custom Builders. This luxurious home, positioned on the most sought-after lot within the esteemed Deerfield Farm Subd
Welcome to this inviting brick home nestled in the charming Colvin Run Mill neighborhood. This spacious 7,830 sq. ft. residence overlooks the scenic backdrop of Difficult Run Park. A circular driveway welcomes you to a formal entrance, revealing an impressive two-story foyer with an elegant staircase, perfect for hosting gatherings in the formal dining, living room and sunroom spaces. Flowing seamlessly, the floor plan connects these areas to the generous family room and kitchen. Designed to be open and airy, the family room boasts a impressive fireplace with marble surround and built-in cabinets. Adjoining this area the breakfast area and gourmet kitchen, complete with a central island 5-
The residence at 816 Polo Place heralds back to a time when Washington officials socialized together. Known for its grand events, the home has hosted government officials, diplomats, celebrities and famous Americans. Featured on the front page of the Washington Post for its Christmas decor the home hosted an annual Christmas Party for approximately 350 invited guests. The residence’s place in the Washington world of domestic and global politics is well known. From the White House to Congress , the home has been a place of debate and resolution. For nearly three decades, Senators, Congressman, Cabinet Secretaries, Ambassadors, UN officials, and, most of Government have visited. The own
Presenting a lovingly maintained and recently updated classic colonial in the bucolic community of Great Falls Forest. This 1/3 acre lot is ideally situated on a no through street. The backyard is surrounded by lush vegetation and trees, and backs to a trickling stream that attracts and nurtures the local flora and fauna. Look at our photos to see the variety of local visitors that come to visit this backyard oasis. Great Falls Forest is a friendly, well-kept community, with quiet streets, friendly neighbors, and a very low HOA fee. Recent updates to the home include: New roof and gutters with leaf guards 2024. All new whole house paint April 2024. New carpet April 2024. Remodeled Master Ba
Nestled among trees this completely remodeled Tudor style home perfectly sited on 2.2 acres. This redesigned home provides fantastic living spaces with attention to detail on all the interior design elements. Offering 5 bedrooms, 3 ½ baths and large barn with 6 stalls and 2 tack rooms. Featuring a stunning Kitchen with quartzite counters, Smart technology LG appliances. Family room with vaulted ceilings and a wall of windows. Ride your horse directly out to River Bend Park and other nearby trails.
This home's standout attribute is its BREATHTAKING VIEWS—offering an unparalleled panorama from every angle and window. Embrace the ESSENCE OF COUNTRY LIVING with the serene beauty of Great Falls right at your doorstep, where every glance outwards is met with the picturesque tranquility of nature's finest landscapes. Nestled at the end of a serene country path, this iconic property in Great Falls occupies a peaceful 5.4 acres of IDYLLIC LAND. It boasts the privilege to extend or subdivide through a connection with the nearby state-maintained roadway. The grand stone residence is meticulously crafted, featuring a spacious porch with an elegant tongue-and-groove ceiling that encircles t
* * * EXCEPTIONAL CUSTOM-BUILT HOME * * * Nestled in a serene, park-like setting, less than 2.5 miles from Great Falls Village, this one-of-a-kind, custom-built, all-brick home offers an exceptional value for the discerning buyer. Situated on 2 acres, this residence boasts a myriad of features both inside and out. As you approach the home, a circular driveway with a charming fountain welcomes you to the large double-door entrance. Stepping into the double-story, marble-floored foyer, you are greeted with abundant natural light. To one side, the formal living room beckons with its beautiful fireplace, while the spacious dining room on the other side invites you and your guests to enjo
Welcome to this beautifully updated home nestled in the highly sought-after Cedar Chase community, conveniently located just off Route 7. Boasting a prime location near Tyson's Corner, Reston, and Dulles Airport, this residence offers the perfect blend of luxury and convenience. Step inside to discover the elegance, with marble flooring gracing the foyer and flowing seamlessly into the formal living room. Gleaming hardwood floors adorn the dining room, while the family room, bathed in natural light, effortlessly connects to the breakfast area and kitchen. The kitchen features tastefully painted cabinets complemented by sleek black knobs, creating a timeless aesthetic. A large mudroom and th
Stunning Modern home built by architect PD Gravitts for himself and his family. Resort-style living includes a forty-four-foot pool, two decks, a creek, and walking hiking trails on five private acres. Bowa Builders did most of the renovations on the house including a heated three-car garage with an unfinished space above, dormer windows, and endless possibilities. This is accessed by a newly paved driveway flanked by custom stone walls and a stunning breezeway connecting to the house. Upon entering, the soaring two-story living and dining areas are washed with light from skylights and walls of windows. Fabulous treed views are enjoyed throughout the house, giving a tree-house effect while
Completely updated in 2023, this home boasts an updated kitchen, all seven bathrooms revamped, new recessed lighting, a fresh roof, and numerous other enhancements. It has undergone comprehensive updates, leaving no detail overlooked! Nestled within the esteemed community of Great Falls, Virginia, this splendid abode offers 5 bedrooms, a ground floor study/bedroom, 7 bathrooms, and rests on an expansive 0.83-acre lot at the end of a cul-de-sac, providing ample space, comfort, and elegance for families in search of luxury living at its finest. Upon entry, you'll be greeted by the beautifully crafted dining and living areas, along with the airy family room that complements the open layout. Th
Nestled on five acres in Great Falls, this 6-bedroom estate is a masterpiece of luxury living. With elegant finishes, 12 fireplaces, gourmet kitchen, two spacious primary suites, multiple entertainment areas, and a convenient location, this home is a true gem. This home has 3 finished levels with over 10,000 sf, all ensuite bedrooms, multiple staircases, office/library, 4 car garage, circular driveway, an elevator-ready shaft and more. All in a convenient location near Great Falls Village, Tysons Corner, Reston Town Center and Dulles Airport. This custom home has been designed to incorporate the rich architectural details prevalent in homes throughout the surrounding neighborhood. The home
Welcome to 10824 Fawn Drive, a stunning residence nestled in the prestigious Great Falls. This elegant home boasts 5 bedrooms and 3 bathrooms within its spacious 3400 square feet. The interior exudes timeless sophistication, featuring high ceilings, exquisite hardwood floors, and an abundance of natural light. The gourmet kitchen is a chef's dream, equipped with stainless steel appliances. The primary bedroom offers a peaceful retreat with a spa-like ensuite bath. Outside, the expansive 2.7 Acres lot provides ample space for outdoor relaxation and entertaining. This property seamlessly combines luxury and comfort, offering a serene escape from the hustle and bustle of city life. Discover th
Introducing 400 Montpelier Road, an impressive brick colonial situated on 5 private wooded acres of land in the heart of Great Falls. This meticulously maintained home features many upgrades throughout including hardwood floors, crown molding and trim, custom windows, recessed lighting and more. You're going to fall in love with the spacious layout - perfect for family time and entertaining alike. A separate dining room and front sitting room cater to more formal gatherings while the eat-in kitchen is ideal for more casual family time. The gourmet kitchen is well lit with upper and under cabinet lighting and offers abundant countertop space. A sun room off the kitchen is filled with sunligh
New home in locust grove. Langley school district. home has some options still to choose. Home will have 6 BD 4.5 bath with large yard covered porch, two fireplaces and 4 finished levels 3 car garage. Home completion in 4 to 6 months.
Welcome to this stunning traditional style home offering spacious living across three levels, with a second detached two-car garage providing additional versatile space. Boasting 6 bedrooms and a plethora of amenities, this residence is an ideal blend of comfort and luxury. Main Level: Enter into a large tile foyer, setting the tone for elegance and warmth throughout the home. The main level features a large family room adorned with a fireplace, perfect for gatherings and cozy evenings. A generously sized living room offers ample space for entertaining or relaxation. Hardwood flooring extends seamlessly, adding a touch of sophistication to each room. The eat-in kitchen is bathed in natural
OPEN HOUSE SATURDAY 12-3pm. Nestled amidst the serene landscapes of beautiful Great Falls, this majestic estate is situated on roughly 2 acres and is the epitome of luxury living. An architectural masterpiece, it boasts a timeless design and unparalleled craftsmanship at every turn. From the grand foyer adorned with Chambord crystal chandeliers and marble floors to the soaring ceilings embellished with intricate crown molding, every element exudes sophistication and grandeur. All TV's/audio are included in the sale of the home. Indulge your culinary passions in the state-of-the-art gourmet kitchen, outfitted with top-of-the-line appliances, and a spacious center island. Whether hosting a ca
This exquisite Asian-Inspired retreat on a secluded 5-acre oasis is tucked away in one of the most private and highly sought-after Great Falls communities. The magnificent 5/6-bedroom, 4.5-bath estate is a true sanctuary of luxury living. Inspired by Asian design, this custom-built masterpiece combines timeless elegance with modern comforts to offer an unparalleled living experience. Step inside to see the elegant living spaces and be greeted by an abundance of natural light that flows through the home. Everywhere you look you'll see the custom Asian-inspired architectural details of the home. The expansive great room with soaring, two story clerestory ceiling, adorned with numerous windows
This property is a spectacular bucolic 8.43 acre equestrian property located just off Georgetown Pike near the Village of Great Falls. The privacy and tranquility of this property cannot be beat. Located at the end of a country lane winding past beautiful estates and mature trees framing the road. The stately traditional brick colonial with a circular drive and four car detached garage with an attic is handsomely sited at the entrance of the property. The property includes a full service guest house, 6 stall barn, two run in sheds, 4 paddocks, a lighted riding ring with gravel walkway from the barn and thoughtfully fenced and crossed fenced. The house feels like a country home with wide-p
Meet Chateau Blanc- A captivating European inspired mansion on a sprawling 2.4 acre privately fenced upscale estate in McLean Virginia. Gated property accessed up by a privately manicured winding driveway! This exclusive masterpiece nestled high on a hill dominating above all the other multi-million-dollar homes in the area features designer fixtures and craftmanship, highest quality imported fixtures, and thoughtfully designed spaces, offering the utmost in resort-style living. The voluminous foyer boasts 27 ft soaring ceilings, elegant chandeliers, beautiful wide plank white oak custom hardwood flooring and Italian imported Calacatta marble floors and accents, with an abundance of natural
A Magnificent Luxury Estate to be the next measure of epic! COMING SOON - End of 2024! Discover true luxury living in this architectural masterpiece spanning 11,720 sqft across 3 levels. Nestled on a 2-acre lot at the end of a cul-de-sac in a new subdivision in the heart of Great Falls, this home, part of the Langley school district, redefines opulence. Featuring a grand foyer, a modern gourmet kitchen with a walk-in pantry, living, dining, family, mud, and sun rooms, this home boasts only the finest high-end finishes. The oversized 4-car garage includes 2 EV charging stations. Entertain effortlessly with a private swimming pool, patio, outdoor fireplace, and a full bathroom. Explore 5 pr
Sales offices open Mon-Wed 12-4pm at 1337 Beulah Road. Introducing The Manors at Still Pond, Gulick Group's newest enclave of 7 home sites with your choice of 4 portfolio models to build. The Vincent features an open floor plan, the amenities the modern family prefers, 4-sides brick exterior, designer finishes and exceptional luxury details throughout, including inset cabinetry in the Kitchen and Owner's Bath. The Upper Level offers a Sitting Room on the Owner's Suite, 5 bedrooms and 5 bathrooms. Great Falls is a peaceful community with a semi-rural feel and unparalleled access to the Potomac river, miles of trails and national parks, yet still convenient to shops, restaurants and recreatio
Welcome to a realm where elegance, craftsmanship, and globally renowned design converge to create the extraordinary haven of Château de Lumière. This amazing home was meticulously designed and built by The Building Group, with uncompromising finishes and flawless details. Inspired by the finest traditions of European architecture, with over 20,000 square feet, it is prominently positioned on 5.5 fully secured, secluded acres with mature gardens. Unveil a world of uncompromising finishes, impeccable details and prestigious materials such as custom brick, cast stone, slate roofing, glass mosaics, plaster molding and imported marble. This residence has state-of-the-art electronics
Sales offices open Mon-Wed 12-4pm at 1337 Beulah Road. Introducing The Manors at Still Pond, Gulick Group's newest enclave of 7 home sites with your choice of 4 portfolio models to build. The clean, contemporary Winthrop features an open floor plan, the amenities the modern family prefers, 4-sides brick exterior, designer finishes and exceptional luxury details throughout, including inset cabinetry in the Kitchen and Owner's Bath. The Upper Level offers en-suite 5 bedrooms including an luxurious owner's suite. Great Falls is a peaceful community with a semi-rural feel and unparalleled access to the Potomac river, miles of trails and national parks, yet still convenient to shops, restauran
DEPENDING ON THE OFFER SELLER WILL ENTERTAIN A BUYER BROKER BONUS AND/OR INCENTIVE TO BUY DOWN YOUR RATE! Nestled on 2 acres of luscious & peaceful, private land in Great Falls, is your refuge from the everyday hustle and bustle of city life. This exquisite custom home welcomes you to a thoughtfully designed layout, starting with a grand foyer and curved staircase upon entry. Coffered ceilings, rich hardwood floors, and numerous fireplaces throughout the home bring warmth and aesthetic uniqueness. Work peacefully from home in your personal Library knowing the chaos of the city carries on. Formal Living and Dining Rooms are perfect for entertaining, while the Great Room provides a rel
Sales offices open Mon-Wed 12-4pm at 1337 Beulah Road. Introducing The Manors at Still Pond, Gulick Group's newest enclave of 7 new home sites with your choice of 4 portfolio models to build. The clean, contemporary Evanton features an open floor plan, the amenities the modern family prefers, 4-sides brick exterior, designer finishes and exceptional luxury details throughout, including inset cabinetry in the Kitchen and Owner's Bath. The Upper Level offers an expansive sitting room on the owner's suite, 3 additional bedrooms with an option for a fifth. Lower lower includes finished great and game rooms and full bath. Great Falls- a semi-rural community with unparalleled access to the Potoma
School data is provided by GreatSchools, a nonprofit organization. Redfin recommends buyers and renters use GreatSchools information and ratings as a first step, and conduct their own investigation to determine their desired schools or school districts, including by contacting and visiting the schools themselves.Redfin does not endorse or guarantee this information. School service boundaries are intended to be used as a reference only; they may change and are not guaranteed to be accurate. To verify school enrollment eligibility, contact the school district directly.
In Great Falls, Virginia, transportation is primarily car-centric, with most residents opting to drive to their destinations. The area experiences moderate to high levels of traffic, particularly during peak commuting hours. Unfortunately, Great Falls does not have a public transportation system, making car travel essential. However, the region is well-connected with nearby highways and freeways, including Route 7 and the Capital Beltway, providing easy access to surrounding areas. Learn more on our Great Falls city guide.
What types of properties are available in Great Falls?
Great Falls, Virginia offers a variety of single-family home types, including ranch-style homes, colonial-style homes, contemporary-style homes, and modern-style homes. These homes can be found throughout the Great Falls area, with many located in established neighborhoods and newer developments. Most properties feature three to six bedrooms and were built between the 1960s and present day. To explore different property types for sale in Great Falls, Virginia, use the 'Home type' filter located above the active listings. Customize your search by selecting options like single-family homes, condos, townhomes, and more.
What is life like in Great Falls?
Great Falls, Virginia offers a serene and picturesque environment with its rolling hills, lush greenery, and scenic views. The region experiences a variety of weather conditions, including mild summers and chilly winters, making it ideal for outdoor enthusiasts. The area boasts a thriving job market with diverse employment opportunities across various industries. Residents can engage in a range of recreational activities, such as hiking, biking, and exploring the local parks and trails. Additionally, the community hosts numerous cultural events and festivals, providing ample entertainment options for individuals of all interests.
What are the schools and amenities like in Great Falls?
Great Falls, Virginia, boasts a variety of public amenities for its residents. You'll find a selection of restaurants offering diverse culinary experiences. The area also features several parks, providing ample opportunities for outdoor leisure and recreation. For your daily needs, there are grocery stores conveniently located within the region. Additionally, Great Falls, Virginia, offers more amenities such as fitness centers, libraries, and retail shops, making it a well-rounded community.
In the past month, 11 homes have been sold in Great Falls. Find your dream home in Great Falls using the tools above. Use filters to narrow your search by price, square feet, beds, and baths to find homes that fit your criteria. Our top-rated real estate agents in Great Falls are local experts and are ready to answer your questions about properties, neighborhoods, schools, and the newest listings for sale in Great Falls. Our Great Falls real estate stats and trends will give you more information about home buying and selling trends in Great Falls. If you're looking to sell your home in the Great Falls area, our listing agents can help you get the best price. Redfin is redefining real estate and the home buying process in Great Falls with industry-leading technology, full-service agents, and lower fees that provide a better value for Redfin buyers and sellers.


 REDFIN IS COMMITTED TO AND ABIDES BY THE FAIR HOUSING ACT AND EQUAL OPPORTUNITY ACT. READ REDFIN'S FAIR HOUSING POLICY AND THE NEW YORK STATE FAIR HOUSING NOTICE.
 United States
 Canada