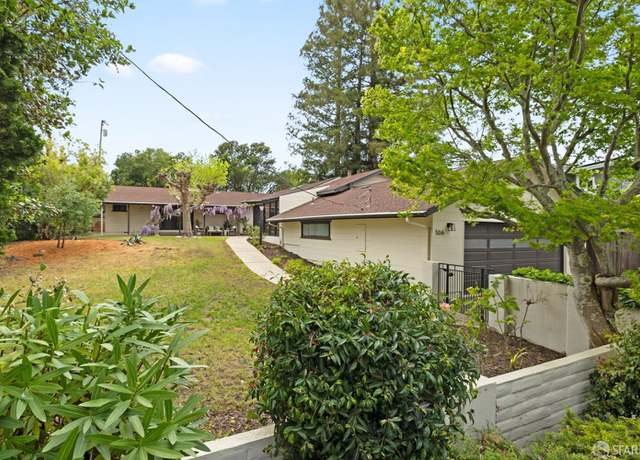
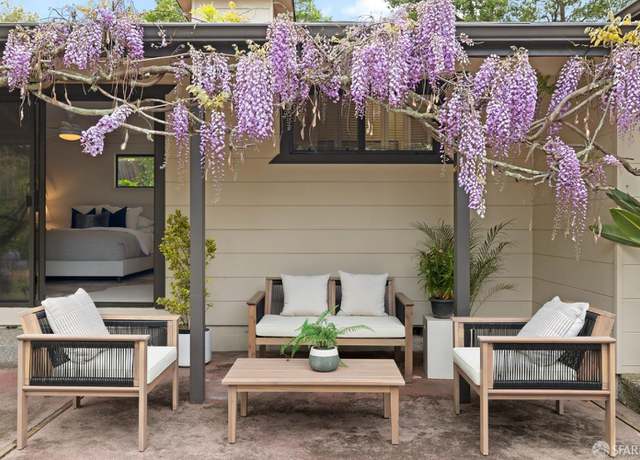
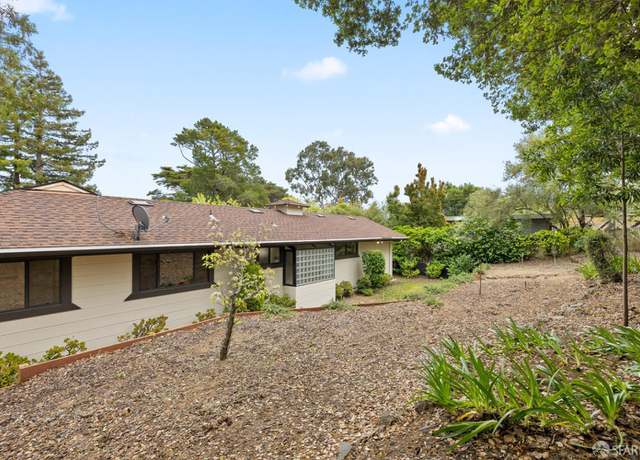
Mid-century stunner located on a very private lane. Nestled amidst the picturesque surroundings, this architectural gem captures the essence of timeless elegance & modern sophistication. The clean & minimalist design, adorned with large windows creates a seamless blend between indoor & outdoor living. Step inside, & you are greeted by an open floor plan that exudes both warmth & style. The spacious living room allows natural light to flood the space & showcase the exquisite craftsmanship & attention to detail that went into every aspect of its design. The master suite, a true sanctuary, features a spa-like ensuite bathroom, a gracious walk-in closet,
Quintessential Easton addition home with traditional charm yet updated for casual living & contemporary elegance. This meticulous residence seamlessly blends the timeless appeal of classic architecture with modern amenities & a relaxed atmosphere, creating the perfect balance between old-world charm & contemporary comfort. The welcoming porch, with its charming details sets the tone for the warmth & hospitality that awaits inside. As you step through the front door, the foyer greets you with a sense of grandeur. From the foyer, you are drawn into the living room, where the splendor of natural light illuminates the space. This room serves as a versatile space, perfect
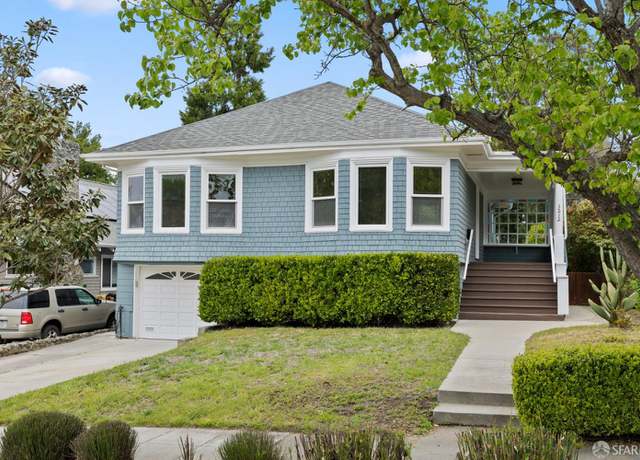
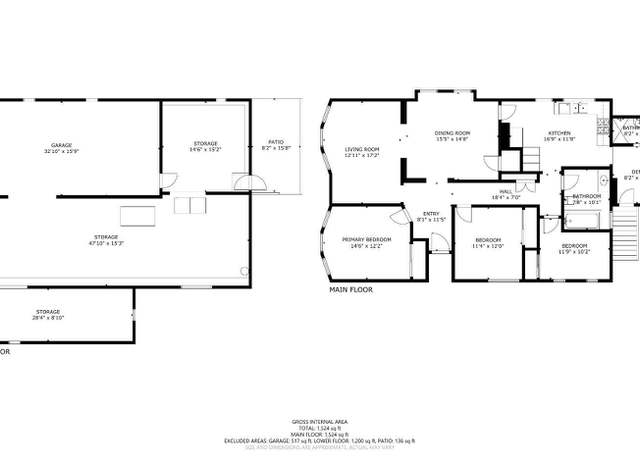
Welcome to 1450 Alvarado Avenue! This charming four-bedroom, two-bath home is nestled in the highly sought-after Easton addition in Burlingame. With its ideal floor plan, this home boasts a layout designed for comfort and functionality. On the ground floor, youll find a sun soaked living room, formal dining room, perfect for hosting gatherings, as well as a cozy breakfast room for casual meals. Outside the breakfast room enjoy amazing views of the Peninsula and Bay. A bedroom and full bathroom adds convenience for guests or for those preferring single-level living plus a bonus room for your at home office needs. Upstairs, three bedrooms await, along with another full bathroom. Ample storage
This stunning 5BR/4.5BA home offers impressive architecture and beautifully renovated interiors in the highly sought-after Burlingame Park neighborhood just blocks from Burlingame Avenue. The classic millwork, eye-catching wall coverings, and elegant lighting, along with wooden shutters and hardwood floors throughout, create a sophisticated ambiance. The formal living room has been transformed into a sleek executive office, while the luxurious gourmet kitchen boasts top-of-the-line appliances. The Kitchen opens to an adjacent family room, which features a built-in bookcase and French doors lead to patio and yard creating a seamless indoor-outdoor living experience. The primary suite, along
MAGICAL STORYBOOK COTTAGE home nestled in the heart of the Easton Addition neighborhood of Burlingame. Unique architectural elements create instant curb appeal with its fairytale sloping roof, cable front accents, & leaded stained-glass windows, artfully sheltered amid soaring birch trees & flowering garden. Gothic revival front door & internal archways punctuate the dramatic design with vaulted original beam ceilings, parquet flooring, brick fireplace, wrought iron railings, & curved wooden staircase. Adjacent formal dining room for easy entertaining. Eat-in kitchen showcases custom cabinets, Dacor range and garden views. Three spacious bedrooms include secluded prima
MODERN, LUXURY, & COMFORT await you at Floribunda Casitas Condominiums. This exceptional unit is conveniently located w/ n walking distance of Broadway & Downtown Burlingame, offering access to vibrant shops, restaurants, & top-rated schools. Step into the grandeur of this modern condo unit, boasting dramatic 9'high ceilings & a meticulously designed open floor-plan layout adorned w/ stylish lighting fixtures. The spacious dining area seamlessly transitions into the living room, leading to a serene balcony, perfect for unwinding with a cup of coffee. MODERN European custom kitchen features waterfall white quartz countertops & backsplash, along w/ premium Thermado
Welcome home to 1680 Skyline Blvd, meticulously renovated in April 2024 w/ luxury vinyl plank flooring, fresh paint, new recessed lighting & fixtures, refreshed baths w/ new vanities & toilets & custom doors. The central location of this 4-bed 2-bath haven offers a large park across the street! The home's floor plan starts from the entryway & towards the dedicated dining room or the living room, both brightened w/ large windows and new light fixtures. The kitchen is a central highlight of the home w/ views of the lush, zen backyard & features freshly painted & glazed cabinetry & tile. Continue through the kitchen to the family room w/ fireplace, &am
Large Ray Park huge corner lot family home. 4 bedrooms, 2.5 bathrooms, family room, separate dining room, hardwood floors, and fireplace in living room. The huge yard backs up to a creek with multiple levels to entertain, includes fish pond and outdoor pizza kitchen.
This modern masterpiece, built in 2018 embraces mid-century aesthetics and design principles in Lower Hillsborough on a secluded half-acre. Designed by Nancy Sheinholtz Associates, the home is surrounded by redwoods and features a modern facade of stainless steel and stone. Inside, polished concrete floors and glass walls underscore the modern vibe. The layout promotes indoor/outdoor living with retractable glass doors connecting the spacious great room to the outdoor pool area. The kitchen is a modern culinary space with top-tier appliances. There are 5 bedrooms, each with its own bath, plus an office. Main-level bedroom suite, upstairs primary suite and two additional suites, plus a priva
1500 Newlands Avenue is a well-constructed elevatored 20-unit apartment with secured parking for 24 cars and 21 storage lockers. It features a mix of (6) Two-Bedroom/1 Bathroom and (14) One-Bedroom/1 Bathroom units, all have a private patio or balcony. Current ownership has implemented a renovation program for 17 out of 20 units, giving a clear and proven plan for considerable rental upside upon turnover. Renovated units feature an in-unit washer/dryer, hardwood flooring, and recessed lighting. Renovated kitchens feature modern stainless steel appliances, granite countertops, tile backsplash, and shaker cabinetry. Bathrooms have sleek tiling with high-end shower heads and faucets. The build
Welcome to 1370 Lasuen Drive, a stunning residence nestled in the prestigious Mills Estate neighborhood of Millbrae. Boasting captivating views of the San Francisco Bay and SFO, this recently updated home offers a rare blend of luxurious comfort and breathtaking natural beauty. Spanning approximately 2,020 sq ft, the interior exudes a sense of spaciousness and sophistication, perfect for modern living. With 4 spacious bedrooms and 2 beautifully appointed bathrooms, this home provides ample space for relaxation and rejuvenation. Situated on a generous 7,638 sq ft lot, this property offers expansive outdoor space ideal for both relaxation and entertainment. One of its most distinctive feature
Discover the allure of this exceptional condo in the heart of downtown Burlingame. Enjoy the convenience of having an elevator next to your unit. Boasting an impressive walkability score and unparalleled convenience, this residence offers a spacious living room adorned with a cozy fireplace, a generous dining area, and a well-appointed eat-in kitchen with a breakfast bar. Step outside to the balcony, accessible from both the kitchen and the second bedroom, creating a seamless indoor-outdoor living experience. The primary suite is a luxurious retreat, featuring a spa-like tub with jets and a separate stall shower, while the second bedroom offers ample closet space and direct access to the ba
Lovely, warm and inviting top floor condominium residence near vibrant downtown Burlingame with its fine dining, shopping, library, an Apple Store and easy access to all commuting routes. Welcoming formal entry leads you to the roomy LR/DR combination with fireplace, access to spacious balcony. Modern kitchen, breakfast bar, spacious pantry, garden window. Primary suite ideally located at opposite end of 2nd bedroom to maximize privacy. Updated baths. Plantation shutters, plenty of closet space with mirrored doors, recessed lighting, skylights. In-unit laundry. 2-car parking + extra storage. Unit is located at back of building. Only 15 units in complex.
This newly updated home is situated on a picturesque, serene street, offering the perfect blend of tranquility and convenience. Just steps away from the vibrant downtown Burlingame, this location is truly unbeatable. The elegant main house spans 1,911 sqft and boasts a layout designed for comfort and style. It features three well-appointed bedrooms, two luxurious bathrooms, and two spacious living areas, creating an inviting atmosphere for both relaxation and entertaining. The textured hardwood floors exude warmth and character, while the marble kitchen countertops add a touch of sophistication. The chef's kitchen, equipped with high-end appliances, is a culinary enthusiast's dream. The hom
Compass Commercial is pleased to announce the exclusive listing of a one-of-a-kind corner duplex quite literally on the border of San Mateo & Burlingame. -- Constructed in 1941 and located on an oversized 6,852 square foot corner lot 4 & 6 Warren Road is just blocks from the restaurants and shopping at the heart of Burlingame Avenue. This luxury duplex is comprised of two MASSIVE 2-Bedroom/1-Bathroom units at 1,607 square feet (4 Warren), and 1,291 square feet (6 Warren); both with private one-car garages and large private backyards. The tenants pay ALL utilities directly, including water, trash removal, gas and electric. The sewer lateral line work is scheduled to be completed
A rare example of old Hollywood glamour nestled in the hills of bucolic Burlingame. This stunning 1920's Spanish-style home was built for starlets serving San Mateo's burgeoning movie colony has been painstakingly kept up with period details like original cast iron fixtures and inlaid wood floors. In this large 4 bedroom, 3 bath, old-world craftsmanship and modern amenities - a steam shower, updated baths, and a chef's kitchen-artfully co-exist. The lower floor can be used as a guest or in-law unit, . Upstairs, host dinner parties in you elegant formal dining room. In the living room, take in the view of the San Francisco Bay from under towering barrel-vaulted ceilings. Entertain on your ge
Experience luxury condo living in Burlingame’s highly sought-after neighborhood. As the recipient of the prestigious Gold Nugget Award in 2012, this gated community boasts modern architectural design, quality finishes, open-concept floor plan, high ceilings, upgraded window shutters and more! This rare 3 bedrooms 2 bath unit offers a spacious 1450 sq ft living space with a versatile den and a generous sized laundry room. The inviting open kitchen equipped with stainless steel appliances, gas range stove, quartz countertop, offers pantry storage and ample counter sitting. Flowing seamlessly from the kitchen is the living area with a modern gas fireplace and access to a sunny private b
Rare opportunity to purchase a well-maintained fourplex in Burlingame's Broadway Neighborhood. This 1978 fourplex, located just a block-and-a half from Broadway, has a unit mix of (1) 2-Bedroom/1-Bathroom unit and (3) 1-Bedroom/1-Bathroom units. Unit 1 has a spacious, private backyard, Units 2 and 3 have been remodeled in 2022 and 2019, respectively. All four units have garbage disposals and dishwashers. The three spacious upstairs units (2, 3, 4) have vaulted ceilings with high vertical windows offering abundant natural light. There are dual pane windows in 3 of the 4 units and an abundance of parking with 5 carports, and a large private two-car garage. All units have storage and access to
Gorgeous New Construction in Burlingame! California Living at its very best! Modern new construction built with every attention to detail. Electronic front gate. The great room offers a wall of glass that (Fleetwood windows and sliding wall doors) opens to the manicured yard - bringing the optimal indoor/outdoor Bay Area living experience to your home! The chef's kitchen with Thermador built-in appliances is an entertainer's dream with an XL island with breakfast bar, tons of modern cabinetry looking to the great room and dining area. 4 en-suites including one on the main floor with luxurious finishes in the baths! Gorgeous light wood floors throughout, glass stairwell with custom iron rai
Unbeatable Value in Burlingame! Don't miss this opportunity to own a home, walking distance to Downtown Burlingame Ave and Broadway! Abundant shopping, dining, and entertainment options, This property holds immense potential to remodel, rebuild, or expand allowing you to create your dream home. Prime size lot in an ideal location in mid-peninsula. Award winning Burlingame schools are merely a few blocks away along with Burlingame Village Park. Near public transportation, hubs of Millbrae Bart Station, and Cal train station. Easy access to hwy 101, 92 and quick access to San Francisco airport. Zoned commercial C-2 offering various potential for possibly an office, retail, hotel, repar shop a
BRAND NEW GATED ESTATE. .. CARMEL MODERN ON DOUBLE LOT WITH ADU! Savor "that new house smell" from this charismatic luxury estate on one of Burlingame's most treasured streets. Easton Drive, the famed gateway to Burlingame's Easton Addition, and just a block from the Hillsborough border, hosts this curated lifestyle statement by esteemed local builder BG Pacific. Sweeping gated front grounds, akin to Hillsborough or Atherton, create a sense of arrival and spacious set-back from the road. Artisan construction details, from the smooth grey stucco, to the rustic stone accents and nods to European design. The exterior endears you with its Carmel architectural ambiance, while inside lo
Experience luxury and sophistication in this completely remodeled and expanded prime Lower Hillsborough home. Nestled in a private cul de sac location on a . 49 acre lot, this residence offers a warm and inviting floorplan with spacious formal living, dining, family and kitchen areas. The first floor features the original master plus two bedrooms and a second-story addition with a stunning primary suite retreat and another large ensuite bedroom, plus an office loft area. Abundant natural light and modern flare through the newly installed Nano door and skylights, this home combines comfort with style. Upgrades abound, from new windows, roof, electrical, plumbing and floors to a fully transfo
Unique opportunity to unlock the advantages of buying an in-progress home built by Thomas James Homes. When purchasing this home, you will benefit from preferred pricing, design personalization, a guaranteed delivery, and more. Estimated home completion is late Summer 2024. Step inside to be greeted by an ADU with en suite bathroom, and living space with kitchenette. The gourmet kitchen comes complete with an eat-at island, and walk-in pantry. Adjacent to the dining area is the great room with fireplace. Head upstairs to the loft, 2 secondary bedrooms, a full bathroom, and a laundry room with sink. The grand suite hosts a luxurious en suite bathroom with a dual-sink vanity, freestanding so
PRIME Trophy Opportunity! EXISTING BUILDING or DEVELOPMENT PROJECT This is a fully Entitled 120 Unit Residential Condominium. Located in the prestigious Mills Estates neighborhood of Burlingame and within walking distance of many shops, the Mills-Peninsula Hospital and, the Millbrae BART & CalTrain stations. With 120 units and 150 parking spaces, this building offers six stories of studios, one, and two-bedroom residences of unparalleled sophistication. Also, there will be 6 affordable to low-income households. The project proposes to provide 150 spaces (31 more than required), including 28 tandem spaces for 56 vehicles. The 169,232 square feet building will have a net rentable square
Old World Charm!!! Prime Location . .. excellent opportunity to have a home plus income. 1044 Paloma Avenue (026-196-250) and 1315 Carmelita Avenue 9026-196-260) This property has Two Homes on two separate Parcels!! Beautifully remodeled units . .. they show like new homes. Paloma has 2 beds, 1 bath, laundry area, small basement plus an upstairs finished attic/storage. Large formal living room, custom kitchen, breakfast nook, new bathroom, separate dining room, wood burning fireplace, hardwood floors along with shared patio and shared 2 car garage. 1315 Carmelita Avenue APN 026-196-260 has 1 Bed 1 Bath with custom kitchen, eating area in kitchen, new bath, wood burning fireplace, hardwood
The subject property comprises three legal parcels of vacant land covering an area of approximately 0.9 acres and presents a unique opportunity for commercial, residential, multi-family, or mixed-use development. The vacant land offers developers and investors a blank canvas to explore various possibilities. This site is situated on El Camino Real, one of Burlingame's primary roads, providing excellent accessibility and visibility. Furthermore, the property is conveniently situated across from Mills-Peninsula Hospital and Burlingame Shopping Plaza, making it an attractive option for various development possibilities. The Millbrae Intermodal Train Station is also nearby, offering convenient
Introducing 2515 Poppy Drive - Your Dream Home Awaits! Experience the pinnacle of luxury living in this meticulously remodeled and extended English Tudor-style residence in Burlingame's prestigious Easton Addition. With four spacious bedroom suites and four-and-a-half bathrooms across three expertly designed levels, this home is elegance and comfort personified. Enter through the grand foyer into a formal living room with gleaming hardwood floors and soaring ceilings, setting the tone for opulence. The Chef's Dream Kitchen features top-of-the-line appliances, perfect for culinary masterpieces. Cozy up by one of two gas fireplaces, adding warmth and charm. Upstairs, the lavish master suite o
Completely renovated 8-unit apartment complex in downtown Burlingame! The property is fully renovated to an exceptional level and very well located 2-blocks from Burlingame Avenue, a bustling downtown that serves as the heartbeat of the community with boutique shops, restaurants, cafes and more. Marketing Package and photos for every unit available upon request.
Fantastic Property, Incredible Opportunity! Seamless and inviting Indoor/Outdoor living! One of a Kind Custom-Built home w/ meticulous Attention to Detail. A Sophisticated eye for Design combines to create an environment of tasteful Elegance and Luxurious living enhanced by Sweeping and Stunning views of the Bay on this Rare 1/3+ acre lot. Rich Bamboo & Marble Floors and Brilliant Light set an ambient tone within, while an Inviting Pool & wide Patio stretches the expanse of the back of the home, taking full advantage of the Secluded, Lush Natural Setting. A Grand Living Room and Banquet size Dining room, 4/5 Bedrooms, 3 Full Baths, Gourmet Granite Kirchen, Brkft Nook, Family Roo
Iconic Downtown Burlingame Gem. Premier Location!!! Steps To Burlingame Avenue. This Trophy Property Consists Of 4 One Bed-Room Units And 4 Studios. Sitting In The Most Desirable Part Of The Entire Peninsula. Located Directly Across The Street From The Burlingame Library And City Hall. Well Maintained Building Boasts 7663 Sq. Ft. Approx. On A 5320 Sq. Ft. Lot. Attached Parking. On-Site Laundry. On-Site Locked Storage Units. Common Area Seating And BBQ Area. Building Shows Pride Of Ownership. All Units Are Currently Occupied. Tremendous Upside.
Great opportunity to purchase a property with approved plans to expand and redesign the existing home into a modern craftsman. Nested in the heart of Burlingame park this property offers a remarkable location. The listing price is for the existing home which consist of 2 bedroom 1 bathroom with 1550sqft of living space. Home is being offered in as-is condition with an approved plans by the City's Planning Commission to expand existing single story home from 1550sqft to a 2 story 2647sqft modern 4 bedroom/ 4 bathroom home. The open concept design includes a bedroom and a den downstairs plus 3 other bedrooms upstairs. The design also includes a wine cellar in the partially finished basement.
PRIME LOWER HILLSBOROUGH LOT WITH . 90 ACRES OF USABLE LAND! NEWLY RENOVATED POWERFUL WATER WELL!!!! SAVE ON YOUR WATER BILLS WHEN WATERING YOUR GARDENS! YOU WILL NOT FIND A BETTER CHOICE THAN THIS CURRENTLY IN HILLSBOROUGH!!! Located at the end of an exclusive cul-de-sac in the prestigious historic Fagan Estates subdivision. This lot features A WIDE SPRAWLING GREEN LAWN with almost an acre of pristine land to BUILD YOUR DREAM HOME! Encompassed by an abundance of mature trees offering total privacy. Only . 5 miles walking distance to bustling Downtown Burlingame. The lot offers the perfect canvas to get everything you've dreamed about with only your imagination being the limit. ONCE-IN-A-LI
School data is provided by GreatSchools, a nonprofit organization. Redfin recommends buyers and renters use GreatSchools information and ratings as a first step, and conduct their own investigation to determine their desired schools or school districts, including by contacting and visiting the schools themselves.Redfin does not endorse or guarantee this information. School service boundaries are intended to be used as a reference only; they may change and are not guaranteed to be accurate. To verify school enrollment eligibility, contact the school district directly.
Homes for sale in Burlingame have a median listing price of $2.6M. Some of these homes are Hot Homes, meaning they're likely to sell quickly.
What are some of the most popular neighborhoods in Burlingame?
Popular neighborhoods include Easton Addition, Burlingame Park, Mills Estates, Downtown San Mateo, Central San Mateo, Skyfarm, Downtown Burlingame, and San Mateo Park.
Burlingame, California boasts a robust transportation system with a variety of options for residents. The city has public transportation, including buses and trains, providing convenient alternatives to driving. For those who prefer to travel by car, traffic levels can vary but are typically moderate. Additionally, Burlingame is strategically located near major highways and freeways, offering easy access to surrounding areas. Learn more on our Burlingame city guide.
What types of properties are available in Burlingame?
Burlingame, California offers a variety of single-family home types, including ranch-style, contemporary, and modern architectural designs, with most properties featuring three to five bedrooms and built in various years. These homes can be found throughout the city, from the peaceful residential neighborhoods near Burlingame Avenue to the scenic hillsides surrounding Mills Canyon Park. To explore different property types for sale in Burlingame, California, use the 'Home type' filter located above the active listings. Customize your search by selecting options like single-family homes, condos, townhomes, and more.
What is life like in Burlingame?
Burlingame, California offers a tranquil and picturesque environment with a diverse range of landscapes, including hills, parks, and a beautiful coastline. The region experiences a mild Mediterranean climate, characterized by warm summers and cool winters, allowing residents to enjoy outdoor activities year-round. The area boasts a thriving job market, with numerous employment opportunities in various sectors, including technology, healthcare, and finance. Residents can engage in a plethora of recreational activities, such as exploring the local parks, hiking trails, and participating in community events and sports leagues. Additionally, the town offers a vibrant downtown area with an array of dining, shopping, and entertainment options.
What are the schools and amenities like in Burlingame?
Burlingame, California offers a variety of public amenities to cater to the needs and interests of its residents. There are numerous restaurants available, providing a wide array of dining options. The city also boasts several parks, perfect for leisure and recreational activities. For daily necessities, residents can visit any of the grocery stores located within the city. Furthermore, Burlingame offers more amenities such as libraries, fitness centers, and shopping centers, ensuring a comfortable and convenient lifestyle for its residents.
In the past month, 18 homes have been sold in Burlingame. In addition to houses in Burlingame, there were also 8 condos, 1 townhouse, and 4 multi-family units for sale in Burlingame last month. Burlingame is a fairly walkable city in San Mateo County with a Walk Score of 70. Burlingame is home to approximately 28,295 people and 35,418 jobs. Find your dream home in Burlingame using the tools above. Use filters to narrow your search by price, square feet, beds, and baths to find homes that fit your criteria. Our top-rated real estate agents in Burlingame are local experts and are ready to answer your questions about properties, neighborhoods, schools, and the newest listings for sale in Burlingame. Our Burlingame real estate stats and trends will give you more information about home buying and selling trends in Burlingame. If you're looking to sell your home in the Burlingame area, our listing agents can help you get the best price. Redfin is redefining real estate and the home buying process in Burlingame with industry-leading technology, full-service agents, and lower fees that provide a better value for Redfin buyers and sellers.


 REDFIN IS COMMITTED TO AND ABIDES BY THE FAIR HOUSING ACT AND EQUAL OPPORTUNITY ACT. READ REDFIN'S FAIR HOUSING POLICY AND THE NEW YORK STATE FAIR HOUSING NOTICE.
 United States
 Canada