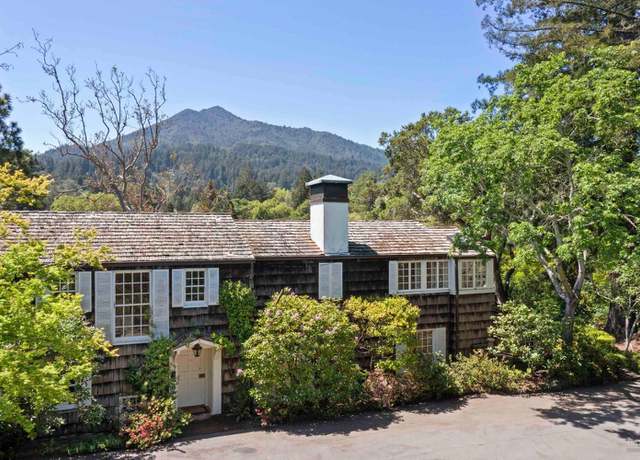
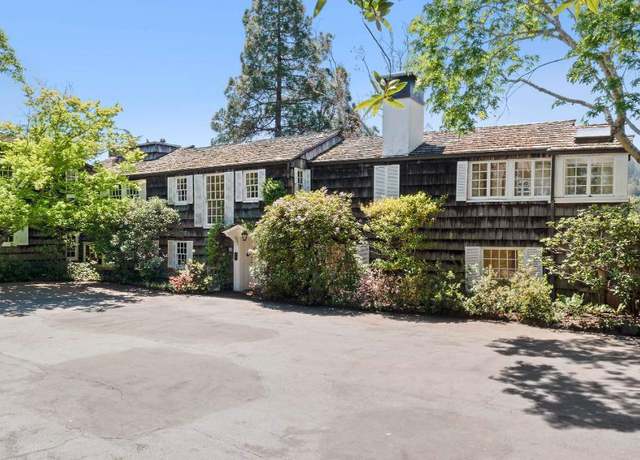
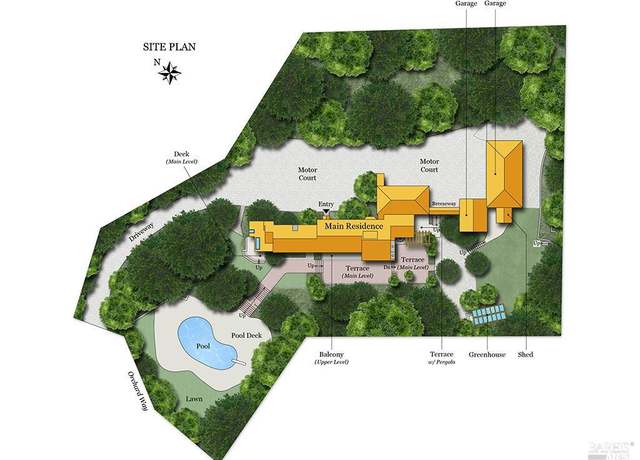
Own a piece of Kent Woodland's history. An incredibly rare offering of a premiere legacy property on Orchard Way in lower Kent Woodlands. A gated, private drive leads to an impressive, stately residence built by one of the original Kent family members close to 90 years ago. Conveniently located on a knoll just above the main corridor of Woodland Road, this property is serene and private, south-facing, with incredible views of Mt. Tamalpais. This is an ideal opportunity for those looking for a premium piece of land in a superb location to create an estate of distinction and beauty.
This single-level remodeled stunner is nestled in arguably the best & most desirable/sought-after neighborhood in Marin, Kentfield Gardens. Ideally situated within very close proximity to both the elementary and middle schools, the property boasts a rare/huge . 25+- acre level lot w/ charming curb appeal & beautiful grounds that look out to serene open space views. The interior has been tastefully remodeled to offer a blend of sophistication & comfort, featuring a family room & a living room, vaulted ceilings & skylights to bring in an abundance of natural light. An open floor plan seamlessly integrates indoor & outdoor living spaces, as the chef's kitche
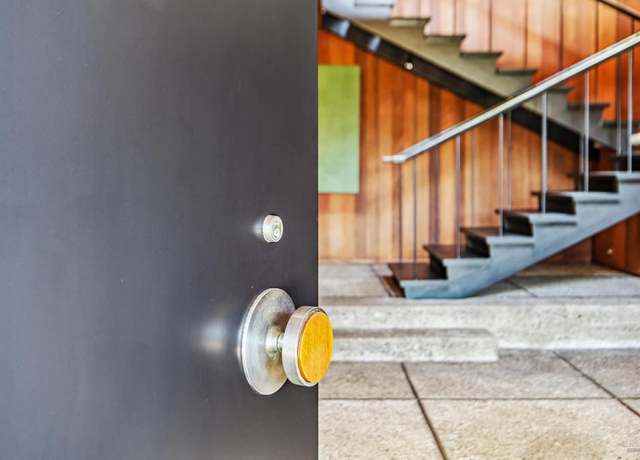
Step into a masterpiece of Mid Century design at 25 Rock Road, where the visionary touch of renowned architect George Rockrise meets the landscapes crafted by Lawrence Halprin. Nestled in Kent Woodlands in Marin County, CA, this architectural gem boasts captivating views of Mount Tamalpais and the East Bay, inviting you to embrace the essence of California living. The main house unfolds with grace, revealing Rockrise's signature elements at every turn. From the striking open stairwell to the warm embrace of redwood paneling, each detail reflects his commitment to both form and function. Walls of windows flood the interiors with natural light, seamlessly blending indoor and outdoor spaces. W
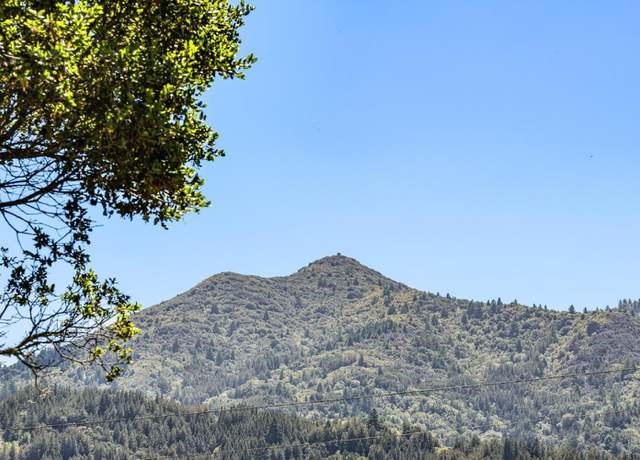
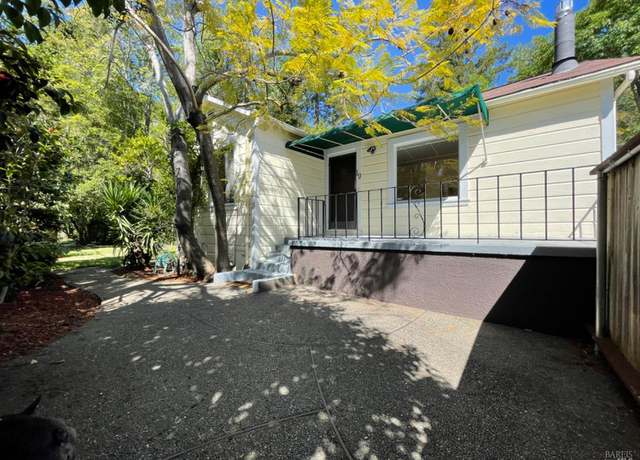
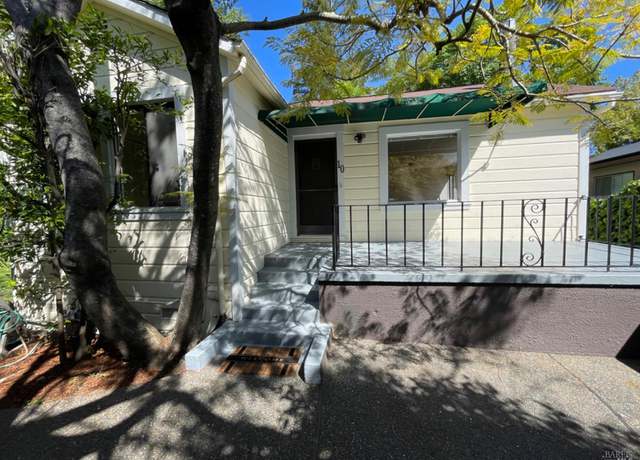
Welcome to 10 Hillside Ave. Charming Cottage Style home located in the highly sought after flats of Kentfield on oversized lot. Perfect for the First Time Home Buyer or the Savvy Investor looking to maximize its redevelopment potential. Flexible RMP Zoning allows for an Extraordinary Opportunity with possibilities for Single Family or Multi Family purpose. (Please consult with County of Marin for Development potential. ) Surrounded by Multi Million Dollar Estates alongside a beautiful and serene creekside setting. Walking distance from Downtown Ross, Woodland Market, shopping and restaurants.
Offering impeccable design, timeless elegance, and breathtaking views of Mt. Tamalpais, 121 Woodland Rd is a contemporary residence with traditional references and unlike anything else in Marin County. The 5,945sq ft home is situated on an acre of meticulously landscaped grounds and offers a lifestyle of unparalleled luxury. Crafted by a team of visionaries, including interior designer Paul Wiseman, the home was extensively rebuilt, expanded, and completed in 2009. Magazine-worthy interiors, art walls, and large-scale public rooms with ten-foot ceilings seamlessly transition to the park-like outdoors. The 4 bed/ 4 full/ 4 half-bath home has one ensuite bedroom on the main level and 3 bedroo
Amazing opportunity for a contractor or developer to upgrade this home to realize its full potential. This property is perched in the hills with lovely views and beautiful natural surroundings. The main living level has tall ceilings with clear-story windows that let the sunlight in throughout the day. The great room comprises the kitchen with a prep island ideal for entertaining, a large fireplace, and a dining area. A full bathroom on this floor and access to an outdoor deck and patio. The lower level has 2 bedrooms and 1 full bathroom. The primary bedroom is oversized, and there is space for an additional en-suite bathroom. The lower level has a multi-purpose space with a full bathro
This tranquil, picturesque, mostly level, one acre property nestled at the entrance to one of Marin County's most beloved trailheads at Baltimore Canyon Open Space Preserve was designed by award-winning, mid-century modern architect, Ian MacKinlay. Known for using glass to create wide open vistas that blur the distinction between inside and out, this home features towering walls of south-facing glass imbuing the residence with an ethereal quality, as if suspended amidst the surrounding forest. The original owners, pioneering outdoor enthusiasts, esteemed for their pivotal role in preserving the Marin Headlands from development, selected this location to build their family home due to its pr
One of Marin's outstanding architectural works of art unveils itself in the offering of 99 Rock Rd in exclusive Kent Woodlands. Tall walls of glass are seamlessly integrated into the original mid century design with perfect indoor/outdoor living throughout. Soaring ceilings throughout the home's public spaces make the residence ideal for entertaining and hosting of large events. The heart of the home is a huge open great room that flows directly to the level grounds and pool. Beautiful established gardens & old growth trees with ability to have sprawling level lawn. The original wood siding remains current in today's design world for mid century inspired homes. GREAT versatile floorpl
Offering privacy, serenity, and an intimate connection with nature, 603 Goodhill Road is a rarity in Marin County. This south-facing 4 bedroom/3.5 bath, 3,606 square foot single-level residence is magazine worthy, offers beautifully scaled public spaces, and a seamless connection with the outdoors. Thoughtfully designed and meticulously maintained, the ranch-style home includes a grand living room with French doors leading to a sprawling Connecticut Bluestone terrace and custom water feature. The formal dining room and high-end kitchen connect to the family room, with abundant natural light. The primary bedroom suite enjoys private access to the backyard and features a large walk-in closet
Located in the coveted Ross Terrace community and rarely available, 30 Ross Terrace is a highly desirable end unit on the back side of this private enclave. The Craftsman style home spans 3,306 square feet (per Context Visuals), and features four bedrooms (with an en-suite bedroom on the ground level), four baths, and an office. An elevator conveniently accesses all floors. Upon entering, you are greeted by a sunlit formal living room with terrace that exudes warmth with its rich hardwood floors, meticulous millwork, and fireplace. The floor plan flows effortlessly from the dining room to a well-equipped kitchen with stainless steel appliances and a functional center island. A connecting la
This classic home features sweeping south views of Mt. Tamalpais and Ross Valley. A park-like level lot, studded with native oak and redwood trees, surrounds this sun-drenched magazine worthy property. Exquisite, luxe craftsmanship and stunning natural beauty frame the resort-like setting. Custom built to impeccable standards, recently updated with a modern twist, the traditional floor plan flows seamlessly from indoors to out. Kitchen/family room open to the entertaining deck, pool with spa, pool house and expansive lawn. 4 bedrooms upstairs with the 5th bedroom separate, over the garage. Located at the end of a private, 5 home cul de sac, close to excellent schools and conveniences, this
Ross School District!! Unrivaled, magazine worthy renovation just completed in one of Marin's most prestigous and desirable locations. Magnificent, bespoke design effortlessly blends wood beams, Oak flooring, designer lighting, hand crafted tile work, & timeless metal doors & windows. Reminiscent of classic Santa Barbara inspired design with a more contemporary interior twist, the 5 main home + detached 1 bedroom guest/pool house is a design stand out. Soaring ceilings with incredible volume & warmth throughout. Seamless indoor/outdoor living spills from the public spaces to the resort like +- 4/10th of an acre grounds. Flexible floor plan allows for up to 4 generous family
The property offers an exceptionally well-located quality nine-unit building, consisting of six two-bedroom, one bath units and three one-bedroom, one bath units. The units have been well maintained, with five out of nine units completely remodeled and upgraded with hardwood flooring, granite counter tops, new appliances (including dishwashers), and all new fixtures. All units have large decks or dedicated outdoor space. There are excellent views from the units and all units have working fireplaces. The roof is approximately five years old. The property is located on a 20,327 square foot lot, with approximately. 8,280 square feet of living space. The property provides both first time multif
Located in the coveted flats of Kentfield. This gated sun filled property has many level areas and is gently sloped. Main house has 3 bedrooms and 2 bathrooms, hardwood floors, and a fireplace with a large attached deck. Updated kitchen and primary bathroom. Rear of the house off of the kitchen is a large pergola and patio. Side yard is level lawn, with a viewing patio. The remodeled cottage (ADU) is 1 bedroom and additional room for either bedroom or home office. There is a smaller unit currently being used as a music studio. Two car garage, with extra storage. Off-street parking for 8+cars. Mature landscaping with different areas of the yard provide various vignettes to work with for th
Sleek design, magazine-worthy interiors, a coveted location, and resort-like grounds are hallmarks of this extraordinary luxury residence. Sited on a . 8893-acre lot and offering 5,609 square feet of living space, 224 Woodland Road is both architecturally stunning and magazine worthy. Located in the coveted flats of Kent Woodlands and offering the ultimate in privacy, serenity and inspiring views of Mt. Tamalpais, the home is defined by its striking façade and sophisticated elegance. The well conceived three level residence offers 6 bedrooms/5.5 baths, large-scale public spaces, an open floor plan, high ceilings, hardwood floors, and clean lines. Floor-to-ceiling windows and La Cantina fol
Spyglass Hill is one of Marin's best communities, due to the convenient location, great weather, nice amenities, proximity to scenic recreational pathways & the excellent Kentfield schools. Unit 635 is a warm & welcoming 2/2, with a specially protected, sheltered feeling due to direct, level access from the garage & a private view. The green views through old oak and laurel trees with a peek of Mt. Baldy is serene. The spacious primary suite comfortably fits a king-sized bed and has a great walk-in custom closet. Other features include a brand new stainless steel refrigerator, filtered water, newer W/ D in unit, radiant heat. A wonderful place to call home! Pool, spa, spo
Located in Kentfield's coveted Del Mesa neighborhood, 446 Palm Avenue is a sanctuary and an entertainer's dream with 5,040 sq ft (per Context Visuals), six bedrooms, five and one half baths, which includes a retreat-like primary suite and spa-like bath with private office and access to the outdoors. This move-in ready home offers a versatile layout and ample space for all needs, featuring grand scale public rooms, beautiful design, and superb indoor-outdoor connectivity. The chef's kitchen boasts new quartz countertops, a Viking double oven, Sub-Zero refrigerator, and Wolf cooktop. A connecting family room leads to an expansive deck with large stone fireplace that serves as an outdoor room
Nantucket-style gated residence in the coveted flats of Kent Woodlands! Transformed with designer finishes & smart systems. Nestled on ~0.72-acre peaceful & private lot. Set in nature w/ majestic redwoods, oaks, Japanese maple & palm trees. Seamless indoor/outdoor flow with lush hydrangeas & roses framing a large wrap-around lawn (former pool). Beautiful classic architecture, hard-to-find scale & proportions, open floor plan, vaulted & box beam ceilings, skylights, crown moldings, 3 modern fireplaces & A/C. Comfortable floor plan w/ multiple common areas for lounging and entertaining. A grand living/dining room, large chef's kitchen with center isla
This newly built architectural masterpiece designed by Hatfield architecture and Dumican Mosey Studio offers panoramic views of Mount Tamalpais unsurpassed in the history of Kent Woodlands, only 15 miles from San Francisco. Southwest facing, the residence sits at the edge of the Baltimore Canyon Preserve offering 193 acres of preserved trails, creeks, and waterfalls. The 6,690 sq. ft. , 6-bedroom, 6 full & 2 half bathroom Cedar, glass and stucco designed residence splashes architectural drama into one of the most unequaled, private sites in Kent Woodlands, offering exceptional views of Mt. Tam from nearly every room.
Welcome to 380 Vista Grande, a masterpiece of elevated design nestled in the heart of Greenbrae with breathtaking views spanning across the Bay. This meticulously designed property offers a blend of luxury, functionality, and convenience, creating an ideal place to call home in Marin. Step through the doors and be embraced by an open-concept floor plan designed for both comfort and entertainment. High-end fixtures and finishes adorn every corner, infusing the home with an air of refined sophistication. The heart of the home, the chef's kitchen, is a culinary haven boasting Bertazzoni Professional appliances, a spacious center island perfect for gathering, and a walk-in butler's pantry with
Experience European Charm in an exquisite hidden gem nestled in Kentfield, Marin County. This artisanal estate, owned by KiVi organic skincare line, offers a harmonious sanctuary with 6 beds, 7.5 baths, and 6,135 sqft of luxury. Prepare to be captivated by panoramic views of the bay, Mount Tamalpais, Mount Diablo, and the East Bay. Meticulously remodeled, the home embodies Mediterranean villa allure, with a grand living room, gourmet kitchen, and elegant dining area maximizing the breathtaking views. The estate comprises a main house, guest house, in-law unit, and gym/pool house. The guest house and in-law unit offer comfortable accommodations, while the gym/pool house includes a jacuzzi sp
Adorable 2 Beds 2 Baths condo with many tasteful upgrades in the desirable Spyglass complex. Featuring beautiful granite countertops, stainless steel appliances, and gorgeous baths with glass shower doors, tile walls and floors. Enjoy wooded views and access to the private balcony from the living room and primary bedroom. Complex offers tennis, spa and swimming pool, and nearby transportation, Hwy 101, walking/biking paths along Corte Madera Creek, hospital, shopping, and award winning schools. What a lovely place to call home!
Welcome to Marin's finest Life Plan Community, aka. a Continuing Care Retirement Community (CCRC), The Tamalpais Marin, a Sequoia Living Community. Our new streamlined residency approval process may have you welcoming in the New Year at The Tamalpais! Available are all the comforts of home in an enhanced and active, independent and elevated lifestyle. Our plush units and communal spaces are all newly renovated! Enjoy the natural beauty of our spectacular grounds encompassing an incredible 360-degree view of Mt. TAM, S. F. Bay, Greenbrae, and/or skylines, a library, gym, auditorium, heated indoor pool and spa, billiards, beauty salon, business center, auditorium, bocce ball, putting green,
Property has significant structural issues and will most likely not qualify for conventional financing. Property involved in litigation and only as is offers will be considered. Welcome to this charming two-unit residence situated in the highly sought-after Baltimore Canyon area of Larkspur. The upper level features a spacious 2-bedroom, 1.5-bathroom unit, providing a comfortable and inviting living space boasting hardwood floors, wood-burning fireplace, exposed beams, and French doors leading to a tranquil outdoor setting. Downstairs features a 1-bedroom, 1-bathroom unit boasting a bonus room, a full kitchen, and a separate entrance, offering versatility for various living arrangements or
Located in Union County, the Chandler Grande Ronde Ranch features 2,389 acres of land ideal for agriculture, forestry, and recreation. Excellent grazing ground ideal for sheep and cattle, as well as stands of timber ready for harvesting. The property supports Douglas-fir, Ponderosa pine, White fir, Western larch, Englemann spruce, Western White pine. There is approximately 6-7 million board feet of timber on the ranch. The ranch's history of timber management dates back to the early 1970s, with notable harvesting activities conducted by Boise Cascade. Bordering the Umatilla National Forest, outdoor enthusiasts have endless opportunities for game such as elk, deer, black bear, and upland bir
This area's enrollment policy is not based solely on geography. Please check the school district website for more information.
Elementary schools
Middle schools
High schools
GreatSchools Summary Rating
9/10
Ross Elementary School
Public, K-8
8/10
Neil Cummins Elementary School
Public, K-5
7/10
Anthony G. Bacich Elementary School
Public, K-4
7/10
Adaline E. Kent Middle School
Public, 5-8
-/10
Tamalpais Adult/community Education
Public, N/A
School data is provided by GreatSchools, a nonprofit organization. Redfin recommends buyers and renters use GreatSchools information and ratings as a first step, and conduct their own investigation to determine their desired schools or school districts, including by contacting and visiting the schools themselves.Redfin does not endorse or guarantee this information. School service boundaries are intended to be used as a reference only; they may change and are not guaranteed to be accurate. To verify school enrollment eligibility, contact the school district directly.
Kentfield, California offers a variety of transportation options for its residents. The town experiences moderate traffic levels, making driving by car a feasible option for daily commutes. Public transportation is available in Kentfield, providing an alternative for those who prefer not to drive. Additionally, Kentfield is conveniently located near several major highways and freeways, ensuring easy access to surrounding areas.
What types of properties are available in Kentfield?
Kentfield, California offers a variety of single-family home types, including ranch-style homes, contemporary homes, and modern homes. These homes can be found throughout the Kentfield area, with many located in established neighborhoods and residential communities. Most properties in Kentfield feature three to five bedrooms and were built in various years. To explore different property types for sale in Kentfield, California, use the 'Home type' filter located above the active listings. Customize your search by selecting options like single-family homes, condos, townhomes, and more.
What is life like in Kentfield?
Kentfield, California offers a serene and picturesque environment with its lush greenery and rolling hills. The region experiences a mild Mediterranean climate, characterized by warm summers and cool winters. Employment prospects in Kentfield are diverse, with a range of job opportunities available across various industries. Residents can engage in a wide array of recreational activities, including hiking, biking, and exploring the numerous parks and trails in the area. Additionally, Kentfield provides access to a vibrant arts and cultural scene, with local galleries, theaters, and music venues offering entertainment options for all tastes.
What are the schools and amenities like in Kentfield?
Kentfield, California offers a range of public amenities to cater to the needs of its residents. The town is home to several restaurants, providing a variety of culinary options. For outdoor enthusiasts, Kentfield boasts a number of parks, perfect for relaxation and leisure. Grocery shopping is convenient with the presence of multiple grocery stores in the area. Additionally, other amenities such as schools, libraries, and healthcare facilities are readily available in Kentfield, California.
In the past month, 3 homes have been sold in Kentfield. In addition to houses in Kentfield, there was also 1 condo, 0 townhouses, and 2 multi-family units for sale in Kentfield last month. Find your dream home in Kentfield using the tools above. Use filters to narrow your search by price, square feet, beds, and baths to find homes that fit your criteria. Our top-rated real estate agents in Kentfield are local experts and are ready to answer your questions about properties, neighborhoods, schools, and the newest listings for sale in Kentfield. Our Kentfield real estate stats and trends will give you more information about home buying and selling trends in Kentfield. If you're looking to sell your home in the Kentfield area, our listing agents can help you get the best price. Redfin is redefining real estate and the home buying process in Kentfield with industry-leading technology, full-service agents, and lower fees that provide a better value for Redfin buyers and sellers.


 REDFIN IS COMMITTED TO AND ABIDES BY THE FAIR HOUSING ACT AND EQUAL OPPORTUNITY ACT. READ REDFIN'S FAIR HOUSING POLICY AND THE NEW YORK STATE FAIR HOUSING NOTICE.
 United States
 Canada