Welcome to 15005 Candover Ct in Leisure World! This 2-bedroom, 2.5-bathroom home presents a prime opportunity for your personal touch and updates. Situated in the gated community of Leisure World, this 2-level townhome-style condo offers affordability without compromising on comfort. Enjoy the abundance of amenities within Leisure World, making it a desirable destination for active living and relaxation. Step onto the large balcony spanning the width of the home, offering a serene outdoor retreat to unwind and enjoy the surrounding views. Assigned parking and exterior storage add convenience and practicality to your everyday living experience. With your creativity and vision, transform this
1/3
$199,900
2 beds2.5 baths1,359 sq ft
15005 Candover Ct Unit 281B, Silver Spring, MD 20906
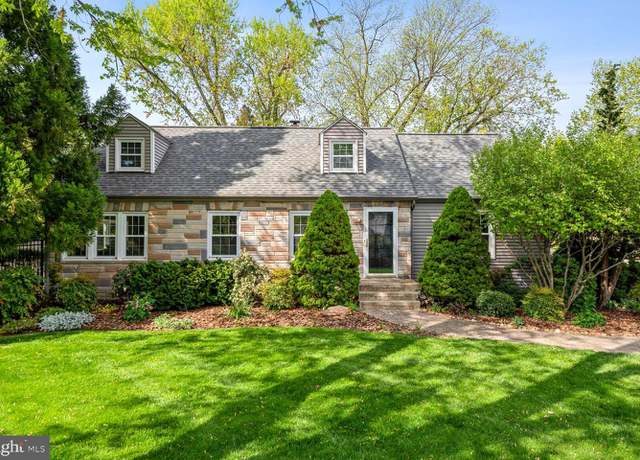
Positively beautiful! The moment you walk in you will fall in love with this enchanting home full of charm and character. With three bedrooms and two and half baths, it offers both space and comfort. Surrounded by a picturesque yard, this home offers a haven of tranquility, while the magnificently landscaped garden delights with its vibrant colors and blooms. The outdoor space is perfect for relaxing and entertaining. The three car detached garage has abundance of storage space. Step into a world where charm and comfort intertwine, embrace the beauty of living with nature right at your doorstep. Close to ICC, shopping, parks, and restaurants.
As you step into the front porch, you're greeted by vinyl flooring offering both durability and style expanding the living space. The carpet on the first level covers the original hardwood floors. The kitchen underwent a complete transformation in 2017 with ceramic flooring and granite countertops equipped with stainless steel appliances, and the crown molding adds an elegant touch to the space, while a ceramic backsplash enhances both functionality and aesthetics. The hall bathroom with marble flooring was renovated in 2018. You can unwind by the fireplace in the living room creating a welcoming ambiance for gatherings. Additional improvements include new windows in 2017, a new garage door
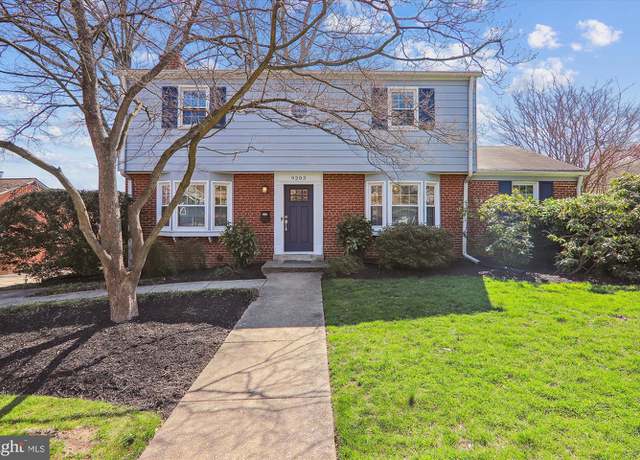
* * Interior photos to come later today * * Don't sleep on this one! Amazing colonial in Woodside Park featuring large rooms, tons of storage, first floor bedroom/office, beautiful kitchen and idyllic backyard with screened-in porch. Home opens to large living room with built in bookshelves and wood burning fireplace. Kitchen is spacious with white cabinetry throughout, stainless steel appliances, tastefully colored Corian countertops, and subway tiled backsplash (2022). Kitchen offers counter seating, is open to the dining room with oversized window and also provides access to the private and serene backyard. Yard is fully fenced in the rear, beautifully landscaped and features flagston
Welcome to this single-family, detached home with hardwood floors throughout, plentiful light, an expanded kitchen and dining area, finished second level, expansive backyard, and fully rentable, income-generating basement suite or extra living area. The home has been updated with a brand new HVAC (2024), new flue lining, sanded hardwoods and fresh paint throughout, upgraded luxury vinyl flooring in both kitchens, new hot water heater, double-paned vinyl insulated windows and more. Enter the home into a welcoming living area with walls of windows. There are multiple spaces for eating and dining, with a dedicated dining area and eat-in kitchen. The bedrooms are offset, for privacy, and share
This property may be eligible for a special Maryland Community Lending Program offered by Prosperity Home Mortgage. Buyer doesn't need to be a first time buyer and there are no income limits on the buyer. Rates can be about 0.5% below market!!! Happy to connect you. City living at its finest is found in Silver Spring, ideally situated just blocks to the Red & Purple Line Metro stations. Built in 2016, this sparkling home features engineered hardwood flooring throughout, quartz countertops, in unit washer & dryer, and a balcony that overlooks a treed green space. The many building amenities include a fitness room, roof terrace, bike storage room, separate unit storage, sky loung
Lovely 2BR/2BA 2nd floor unit in Aspen Forest 2 with vaulted ceiling in Living Room. Large windows make this unit extremely bright, includes a window in the kitchen. Move-in ready. Washer/Dryer in unit. Recent paint, new flooring, granite counter in Kitchen. Private garage with extra parking in front of the garage. Garage is separately deeded. Expected on market April 25,2024 so owners can get the unit ready for showing. Open House, Sunday, April 28, 2024, from 1:00 PM to 4:00 PM.
$265,000
2 beds2 baths1,028 sq ft
13406 Shady Knoll Dr #13406, Silver Spring, MD 20904
Welcome to this spacious 5 BR and 3 full BA home in Springbrook Terrace! This subdivision is a quiet sanctuary, offering peace and serenity while being conveniently located just off NH Ave between the Beltway and the ICC. This home has been beautifully maintained by the original owner! A split-foyer design, it is a Modern Mid-Century gem with custom upgrades when originally built. Step up to a living room with large windows and lots of natural light. A separate dining room overlooks the backyard greenery. Kitchen has thoughtful cabinet design with pull-out cabinet shelving. From the kitchen you enter a wonderful year round sunroom with abundant daylight and panoramic landscape views. Th
Explore this charming single-family residence nestled in the sought-after Countryside community. This split-level home boasts 3 bedrooms, 2.5 baths, and a 2-car garage, offering a seamless blend of comfort and convenience. The luminous living area and refined dining space flow effortlessly into the eat-in kitchen, overlooking the expansive, level backyard. A spacious family room with a wood-burning fireplace provides an inviting ambiance for intimate gatherings and casual relaxation—an oversized laundry/utility/mudroom. Embrace Countryside's tranquil surroundings and amenities, including a 21-acre park featuring a lake, tennis courts, basketball courts, playgrounds, and scenic hiking
Welcome to 10118 Greeley Avenue, one of the most charming homes in all of Silver Spring! Prepare to be wowed as you step inside this adorable Colonial! The highlight of this home is the gorgeously renovated kitchen featuring marble counters and all new appliances, plenty of space for a table and additional island seating, all illuminated by Murano Glass light fixtures from Italy. A new porch off the kitchen allows for easy access to the side and back yard. The main level boasts re-finished hardwoods throughout, a spacious living room with new gas fireplace and the beautiful sunroom with access to the fenced backyard! Utilize this multi-functional space in many ways - this bright + sunny
Buyers will love this charming cape filled with natural light and tons of character! Working from home is a pleasure in this sun-filled house. 4 bedrooms, 2 full bathrooms, a wood-burning fireplace, large bay window, built-ins, recessed lighting, fresh paint, and newly refinished hardwood floors. The kitchen has 42-inch solid wood cabinetry, stainless steel appliances, and granite counters. The unfinished basement offers additional opportunity for living space. The huge slate patio is perfect for entertaining and outdoor dining. This house is a short distance to nearby South Four Corners and Argyle Local parks, and to Sligo Creek Trail, with easy access to 495 and
Welcome to this charming Takoma Park cottage bungalow, exuding timeless appeal and enhanced by a detached studio! Built in 1923, this delightful home is replete with superb architectural details, including wonderful woodwork, amazing wood floors, gorgeous archways, and fabulous outdoor space. As you step onto the inviting covered front porch, featuring a tongue and groove ceiling, you'll immediately feel the warmth and charm of this home. The light-filled living room welcomes you with recessed lighting, decorative ceiling molding, two ceiling fans, and a dual-sided fireplace with glass doors. Flowing seamlessly from the living room is the large eat-in country kitchen, boasting a French coun
Nestled in the highly sought-after neighborhood of Takoma Park, 7508 Piney Branch Road presents a state-of-the-art re-designed home crafted for the ultimate in modern living and entertaining. With 4 bedrooms and 3.5 bathrooms spread across three thoughtfully designed levels, this residence exudes elegance. Upon entry, you'll be greeted by upscale finishes and fine architectural details, including Red Oak flooring, LED recessed lighting, crown molding, new Anderson windows, a smart home monitoring system, and exquisite French doors. The main level is designed to impress, featuring a versatile sunroom/mudroom, a sun-filled living room adorned with a wood-burning fireplace, an open dining room
Welcome to your dream home, nestled in a serene neighborhood, which is freshly painted and offers the perfect blend of modern comfort and classic charm. The heart of the home is the newly remodeled kitchen which features new cabinets and backsplash, stainless steel appliances, and ample storage space, ensuring both style and functionality. Retreat to the master suite connected to the newly remodeled ensuite on one wing of the home and three more bedrooms and newly renovated bathroom on the other side of the home for a family or accommodating guests and/or office space. Step outside and discover your own private oasis—a sprawling yard with endless possibilities in the back of the home
Wonderful Split-Colonial with loads of space and open floorplan in a fabulously private setting backing to trees! Pics coming soon and showings begin Thursday!
Once in a while a tremendous home comes along - better than you could have ever imagined! This is that home! An unbelievable opportunity, 815 Notley has been thoughtfully cared for and updated over the last 30 years and it’s now ready for you to enjoy. This home is a show-stopper! Nestled within the charming community of Paint Branch Farms in a more rural setting in Silver Spring, this enchanting Cape Cod-style home exudes warmth, comfort, and timeless elegance. As you approach from the driveway the setting is classic, charming and inviting. Set against a backdrop of lush greenery and meticulously manicured landscaping, this picturesque residence boasts undeniable curb appeal. The ex
First time on the market in 39 years! Lovingly maintained and completely updated throughout. Photos and more coming soon. Open Sunday from 2-4pm. Don’t miss this one!
Your permanent vacation begins here in this lovely 2 bedroom, 2 full bath condo serenely set overlooking tall trees and occasional wildlife. Just move right in and enjoy the new carpeting and fresh paint while you unpack, meet your neighbors, and explore all that Leisure World has to offer. The bright and sunny enclosed balcony is perfect for relaxing while you enjoy cool breezes from the open windows and listen to the singing birds and rustling trees. .A plethora of activities and events await in the large, very active, surrounding Leisure World Community. Park your car in your own garage space with no need to go outside in poor weather as the bulidling entrance is just steps away.
Welcome to Leisure World, a 55+ gated community. Great location for this end unit Berkeley II model backing to the broadwalk, close to Clubhouse 1. Beautiful patio looks out onto trees. Fresh neutral paint and carpet throughout, ready for you! Coop fee includes everything: taxes, utilities, basic cable and internet, all amenities-fitness center, grounds and trails, woodshop, 2 clubhouses, art studios, more! Come see all that Leisure World offers!
$218,000
2 beds2 baths1,600 sq ft
3472 Chiswick Ct Unit 41-A, Silver Spring, MD 20906
Welcome to Unit 906 at The Parkside Plaza - a stunning, West Facing 1 Bedroom/ 1 Bath unit flooded with natural light in Silver Spring, MD. Contemporary and move-in ready, you will enjoy spacious and designated living room and dining spaces that allow for multiple placement combinations. A beautiful kitchen with stainless-steel appliances, spacious bedroom that easily accommodates a desk/office, and tons of storage space. All Utilities Included in Condo Fee. 24-Hour Concierge, Pool, Gym, Courtyard are some of the amenities at this lovely community. A short-distance walk to Silver Spring Metro, restaurants, tons of shopping and access to 495/Highways.
Welcome to your new home on a spacious corner lot, where comfort and style intertwine effortlessly. This meticulously renovated residence boasts a blend of modern amenities and timeless charm, promising a lifestyle of luxury and convenience. Step inside to discover a chef's dream kitchen, meticulously redesigned with sleek finishes, stainless steel appliances, and ample counter space, perfect for culinary adventures and entertaining alike. The adjacent renovated bathrooms offer a spa-like retreat, featuring elegant fixtures and designer touches. As you explore further, you'll be greeted by new carpet and tile flooring that exude both warmth and sophistication, complemented by freshly painte
$599,997
3 beds2 baths1,550 sq ft
15556 Prince Frederick Way Unit 115-B, Silver Spring, MD 20906
A great opportunity to own a little piece of Sunshine in Leisure World of MD, an age 55 and over gated community. This 2 bedroom 1 full bath home includes an additional sunroom and a 2 garage! Also included is and enclosed patio for your privacy or for your furry friends to hang out. Full Sized washer and dryer is in the property. The bathtub has been converted into a shower with glass doors.
This expanded Woodmoor colonial offers loads of space and a great location - close to shopping, dining and transportation. A covered entrance leads into a large living room with crown molding, a wood-burning fireplace and enough space for two separate seating areas. This opens on to a renovated eat-in kitchen with formal dining area, granite countertops, a seating peninsula and a door to the spacious back deck with built-in bench seating. It’s a great set up for large-scale indoor-outdoor entertaining. Off the kitchen is a large bedroom, a renovated bathroom with a jetted Jacuzzi tub, and a bonus room that would be perfect for a home office. Upstairs is an expansive primary bedroom wi
OPEN HOUSE - APRIL 27 2PM-4PM. This charming home has many great features! Located in one of the best Silver Spring locations in Sunset Terrace with no HOA fees. It’s only minutes away from family friendly parks, playgrounds, bike trails and a Golf Course nearby. It is conveniently located within walking distance of the Forest Glen Metro, Holy Cross Hospital, and a short distance drive to the beltway, shopping malls, Costco, downtown Silver Spring, and many other amenities. This home is move-in ready and comes with a BRAND NEW Gas Range w/ Griddle, Dishwasher, Dryer, Window Blinds, Mosaic Wall Tile, Bathroom Renovation, and Basement Flooring. Other items like the washer, water heater
Experience Luxurious Living in this Amazing 4-Level Home that is Bigger Than it Looks, Boasting 5 Bedrooms and 2.5 Baths! It's Loaded with Upgrades & Improvements that You Have to See To Appreciate! Updated Kitchen, Baths, HVAC, Roof, Electric, Generator & More. Beautiful Updated Kitchen with Cherry Cabinets, Granite Countertops, and Stainless-Steel Appliances, Open to Dining Room and Perfect for Cooking, Eating and Entertaining. Spacious Living Room features Vaulted Ceilings, lots of Light and Plenty of Space for Relaxation and Gatherings. A Sunroom Addition at the Rear Adds Extra Space and Comfort, While a Detached Garage & Workshop (with Electric) and Driveway Provide
This lovely 4 bedroom, 2 full and 2 half bathroom brick townhome is ideally located in a quiet neighborhood in a great area and includes 2 convenient reserved parking spaces! This home includes fresh neutral paint throughout and offers upgraded luxury vinyl plank flooring and upgraded new carpet. The main level features an open floor plan with a spacious and bright living room, a dining room that can be used for formal or casual dining, a convenient half bathroom and the generously sized eat-in kitchen is flooded with natural light and feels open and airy. This home also features an elevator!! The upper level offers a primary bedroom with en-suite, 2 additional spacious bedrooms and a ful
Resting on a quiet cul-de-sac drive deep in Poplar Run, 1105 Verbena Court is a unique property within the community and it's easy to see why. Steps from home you will find neatly manicured walking trails, abundant in the community. Its convenience to metro by car or neighborhood bus route makes the daily commute into the greater metro area highly accessible, while the home itself sits quietly nestled amongst a full tree line. Entering the home, there is nothing but natural sunlight which cascades inside through the big front windows onto a grand two-story entrance. This home features an open floor plan highlighting the 5 bedroom/5.5 bathroom layout, supplemented by an open floor plan on th
Welcome home to this 4 bedroom, 2.5 bathroom split-level single family home in Silver Spring! Walk into a light and bright living room area with beautiful LVP floors and abundant natural light. Move easily from the dining area to the fully-equipped kitchen with stainless steel appliances and ample cabinetry and countertop space. Make your way onto the back deck which provides the perfect space for outdoor dining and entertaining. The next lower level of the home features a spacious family room or recreation room as well as a bedroom and half bathroom. On the upper level of the home you will find the primary bedroom with a private en-suite bathroom featuring a beautiful glass shower stall. T
Picturesque cape cod with 3 levels of finished space. Completely updated! Main level boasts a open floorplan with sunny living room and cozy fireplace with door leading to a stunning screened in patio, dining area, and updated kitchen with stainless steel appliances, quartz countertops and island with breakfast bar seating. Main level offers 2 spacious bedrooms and a full hall bathroom. The upper level features and oversized master bedroom with built-ins, walk-in closet, and update private bathroom with tile shower. The fully finished lower level offers two more rooms (perfect for guest rooms, home office, rec room, etc), a den with extra refrigerator and laundry, and a full updated bathroo
This warm, updated and expanded brick rambler offers the perfect space for first-time buyers, empty nesters, or those looking for one-level living. Don't let the front exterior photo fool you - this home is much larger than it looks! The main level, flooded with light from oversized windows, features a large living room and enlarged kitchen with granite countertops, warm wood cabinets, gas stove and pantry. An adjacent dining room has French doors to the private, fenced backyard with patio. The primary bedroom features a walk-in closet and beautifully renovated full bath with shower. A hall bath, also updated, serves the other two bedrooms. The tastefully finished lower level has space for
Meander through flowering tree-lined streets in sought-after Strathmore at Bel-Pre to your dream home! Rarely available classic Victorian/Colonial-style home with romantic front porch made of teak wood. All backing to the quiet and serene setting of Matthew Henson State Park! A nature lovers dream! AND less than 1 mile to METRO and more. .. Quality built Fairfield Home Hampton Model w 2 car side-load garage. MAIN LEVEL: features center-hall entry foyer, library w French doors has built-in storage and shelves, half-bath, living room w/ floor to ceiling windows, separate formal dining room has a bay-window and view of park, large kitchen with picture window has views of parkland, pantry
New in Woodmoor, this mid-century rambler has been stylishly updated - inside and out! As you approach the home, you’ll be wowed by the tiered, landscaped front yard with mature perennials, stone steps and paths and a gracious front entrance. Inside, you’ll find a bright living room with a gas fireplace and a big window overlooking the front yard. A beautifully renovated kitchen features granite countertops, stainless steel appliances, a lovely tile backsplash, loads of counter space and storage as well as casual dining space and a powder room. Doors lead to the back yard and a cozy patio. Off the kitchen is a sunny back bedroom with skylights and gorgeous views of the backyard.
Welcome to this stunning and unique three-story gem of Mid-Century Modern architecture, in renowned architect Charles Goodman’s Rock Creek Woods, a quiet sought-after community just north of Old Town Kensington. A Mid-Century Modern Oasis * * * Step inside this light-filled sanctuary, nestled amidst lush shrubs and mature trees. Boasting nearly 2300 square feet of exquisite living space, this home offers the perfect blend of style, comfort, and functionality. Stylish Living Spaces * * * The main level features a spacious dining/living area complete with a wood-burning fireplace. The remodeled open kitchen and renovated bathroom feature high-end materials. On the floor above, you
Step into this stunning detached home in Silver Spring! Nestled on a peaceful, private road, you'll find a generously sized driveway. As you enter, the sunroom provides access to the main living area. Stainless steel appliances, abundant counter space, elegant granite countertop , and a charming peninsula breakfast bar await you in the kitchen. Additionally, the lower level features a fourth bedroom with abundant natural light. The spacious living room showcases a stunning brick accent wall embracing a cozy wood-burning fireplace. Step onto the Spacious deck and soak in the beauty of the spacious backyard! Upstairs, three sizable rooms await, drenched in natural light. Recessed lighting
School data is provided by GreatSchools, a nonprofit organization. Redfin recommends buyers and renters use GreatSchools information and ratings as a first step, and conduct their own investigation to determine their desired schools or school districts, including by contacting and visiting the schools themselves.Redfin does not endorse or guarantee this information. School service boundaries are intended to be used as a reference only; they may change and are not guaranteed to be accurate. To verify school enrollment eligibility, contact the school district directly.
Silver Spring, Maryland boasts a robust transportation network, making it easy for residents to navigate the city by car. The area experiences moderate to high levels of traffic, particularly during peak commuting hours. Public transportation is readily available, with options including buses and the Metrorail system. Additionally, Silver Spring is conveniently located near several major highways, offering quick access to surrounding areas. Learn more on our Silver Spring city guide.
What types of properties are available in Silver Spring?
Silver Spring, Maryland offers a variety of single-family home types, including ranch-style homes, split-level homes, and contemporary homes. These homes can be found throughout the city, with ranch-style homes typically located in established neighborhoods, split-level homes scattered throughout various communities, and contemporary homes situated in newer developments. Most properties in Silver Spring, Maryland feature three to five bedrooms and were built in various years. To explore different property types for sale in Silver Spring, Maryland, use the 'Home type' filter located above the active listings. Customize your search by selecting options like single-family homes, condos, townhomes, and more.
What is life like in Silver Spring?
Silver Spring, Maryland offers a vibrant and dynamic living experience. The landscape is characterized by a mix of urban and suburban areas, with a variety of housing options to suit different preferences. The weather in Silver Spring is characterized by distinct seasons, with warm summers and mild winters. The area boasts a range of job opportunities across various industries, including technology, healthcare, and education. Residents can enjoy a multitude of activities, such as exploring local parks, dining at diverse restaurants, attending cultural events, and engaging in recreational pursuits.
What are the schools and amenities like in Silver Spring?
Silver Spring, Maryland offers a variety of public amenities to its residents. Yes, there are numerous restaurants available, providing a range of culinary options to suit diverse tastes. Parks are also plentiful in Silver Spring, offering green spaces for relaxation and leisure. Grocery stores are conveniently located throughout the area, ensuring easy access to daily necessities. Additionally, Silver Spring boasts other amenities such as libraries, fitness centers, and cinemas, contributing to a vibrant and engaging community lifestyle.
In the past month, 48 homes have been sold in Silver Spring. In addition to houses in Silver Spring, there were also 84 condos, 10 townhouses, and 0 multi-family units for sale in Silver Spring last month. Silver Spring is a moderately walkable city in Montgomery County with a Walk Score of 63. Silver Spring is home to approximately 70,779 people and 32,954 jobs. Find your dream home in Silver Spring using the tools above. Use filters to narrow your search by price, square feet, beds, and baths to find homes that fit your criteria. Our top-rated real estate agents in Silver Spring are local experts and are ready to answer your questions about properties, neighborhoods, schools, and the newest listings for sale in Silver Spring. Our Silver Spring real estate stats and trends will give you more information about home buying and selling trends in Silver Spring. If you're looking to sell your home in the Silver Spring area, our listing agents can help you get the best price. Redfin is redefining real estate and the home buying process in Silver Spring with industry-leading technology, full-service agents, and lower fees that provide a better value for Redfin buyers and sellers.


 REDFIN IS COMMITTED TO AND ABIDES BY THE FAIR HOUSING ACT AND EQUAL OPPORTUNITY ACT. READ REDFIN'S FAIR HOUSING POLICY AND THE NEW YORK STATE FAIR HOUSING NOTICE.
 United States
 Canada