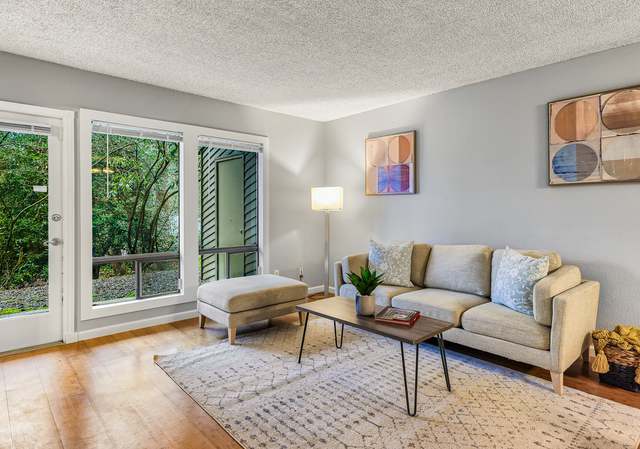
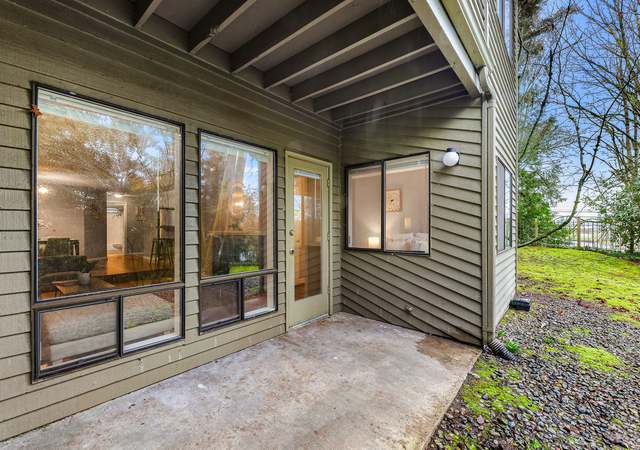
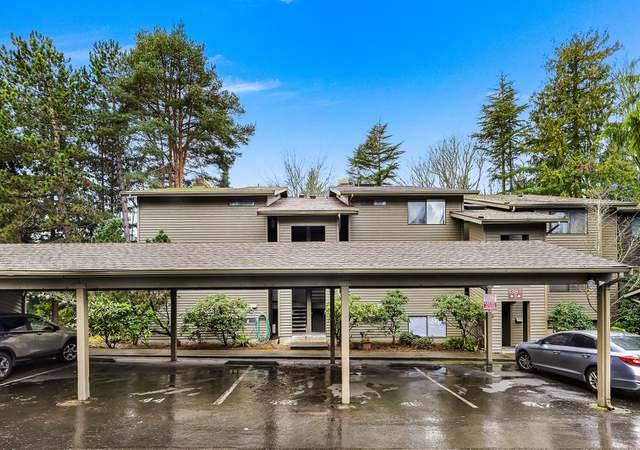
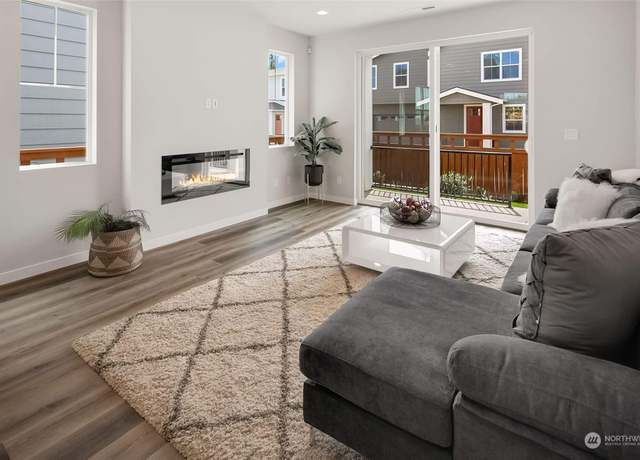
SELLER WILL PAY 1-year of HOAs with a full price offer (up to $8064) & PRICE IMPROVEMENT! Ground level unit with private backyard area off of the patio; tranquil territorial views. This two bedroom, two bath home lives large! Oversized bedrooms are on opposite sides of the unit for privacy, & each has access to a bathroom. Full-size laundry in unit. Storage closet off of patio. All hard surface flooring. Dedicated carport parking space with many visitor spots. HOAs include water/sewer, cable, garbage and common areas. Newer appliances. Convenient access to SeaTac Airport, 509, 518, I5, and 405. Shop in Burien or nearby Westwood Village. Nearby bus lines. Home Inspection and all H
1/30
$313,500
2 beds2 baths980 sq ft
138 SW 116th St Unit G12, Seattle, WA 98146
Listing provided by NWMLS as Distributed by MLS Grid
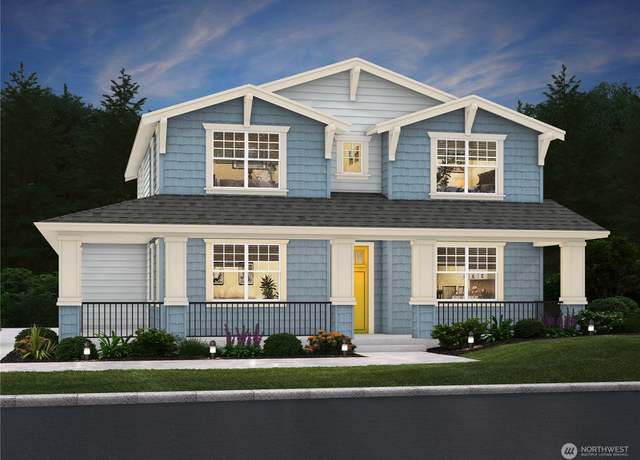
Phase 3 Homes Now Available! Altamura by Conner Homes offers the best of urban living. Our Plan F1 boasts an open kitchen with Quartz counters, subway tile backsplash, and under-cabinet lighting. Luxury vinyl plank flooring throughout the main level and an electric linear fireplace in the great room. The main level also features a spacious bedroom and 3/4 bath. Upstairs, a roomy Primary suite with an ensuite bath, custom shower, double sinks, Quartz counter, and tile floor awaits. Three more well-sized bedrooms and a generous upper-level bonus area. Step outside to fenced and landscaped yard with a covered patio and a gas BBQ stub. Brokers, please register buyers before 1st visit. July Comp
1/19
$975,900
5 beds3 baths2,323 sq ft5,005 sq ft (lot)
558 SW 98th Pl #49, Seattle, WA 98106
Listing provided by NWMLS as Distributed by MLS Grid
Immaculate Brick Duplex. Immaculate up/down Duplex with 2 bedrooms in each unit. Upstairs unit offers 1 1/2 baths. Upstairs garage is currently converted to room being used as 3rd bdrm. /den. Peek City view, great partially fenced corner lot. Vinyl plank flooring installed in 2022. New roof in 2020, New bath fitters bath (lower unit) in 2021. New leaf guard gutters in 2018 and all new thermo-pane windows in 2016. Excellent condition inside and out. Detached storage shed, great RV, boat and off street parking for up to 10 cars. EZ conversion back to Single family as stairway is intact allowing for a four bedroom, 2 1/2 bath home with second kitchen. You simply won't find a better Duplex
1/30
$695,000
4 beds2.5 baths2,360 sq ft0.29 acre (lot)
10803 4th Ave S Unit A & B, Seattle, WA 98168
Listing provided by NWMLS as Distributed by MLS Grid
With some vision, paint & updates this home will shine bright! Bonuses include a large front deck, brand new roof and a 2 bedroom 1 bath detached additional dwelling unit (DADU) with kitchenette. This would also be a great investment for owners who live on one side and rent the other and watch your property appreciate! Versatile space that is also ideal for multigenerational living. Conveniently located on major bus route and proximity to light rail stations, easy access to 509, 518, 405 and I-5 and minutes to SeaTac Airport, Southcenter Shopping mall & surrounding restaurants.
1/28
$599,950
4 beds2 baths1,480 sq ft6,250 sq ft (lot)
11246 1st Ave S, Seattle, WA 98168
Listing provided by NWMLS as Distributed by MLS Grid
Discover the epitome of modern sanctuary living at Tapestry in Greenbridge with an Assumable loan available at 2.75%! Enjoy nearby Greenbridge Cafe, offering gourmet sandwiches & soups with fresh, local ingredients. Revel in proximity to Sea-Tac airport, downtown Seattle, & Alki Beach. Immerse in luxury with $30,000+ in upgrades, including a chef's dream kitchen & covered patio. This stand-alone home boasts 4 bedrooms, including a spacious primary bedroom with an ensuite oversized shower. Greenbridge, a vibrant community, offers schools, parks, & more. Engage, play, & thrive amidst pedestrian paths and diverse art installations. Don't miss your chance to own a san
1/40
$738,000
4 beds2.5 baths1,823 sq ft2,752 sq ft (lot)
818 SW 97th St, Seattle, WA 98106
Listing provided by NWMLS as Distributed by MLS Grid
Welcome to this impeccably maintained modern home, blocks from bustling White Center, & a stones throw from West Seattle!Natural light illuminates the open concept main floor, creating inviting space for entertaining. Step into a bright & welcoming kitchen that boasts abundant white shaker cabinets, sure to ignite your passion for cooking. Upstairs, discover a bonus room & sizeable bedrooms each with oversized closets. Indulge in the primary retreat, complete with a lavish bath & custom-designed boutique-style closet. Outside, unwind in the west-facing backyard oasis, with a smart irrigation system & extended patio. Nearby, Lake Hicks Park offers disc golf, bike
$975,000
4 beds3 baths2,615 sq ft7,658 sq ft (lot)
11025 11th Ave SW, Seattle, WA 98146
Listing provided by NWMLS as Distributed by MLS Grid
Fresh landscaping outside greets you as you drive up to your new home. Lets be real, here. .. this home is practically brand new! It has been lovingly maintained and cared for. With amenities that just make life easier, such as stainless steel appliances, an open concept kitchen/living room, walk-in pantry, quartz countertops, an outdoor space that is covered, as well as a fully fenced yard with access to the trail behind the house. The reading area at the top of the stairs is perfect for morning coffee, and slowly starting your day. The spacious primary bedroom features a beautiful bathroom with walk in closet. Located close to where you want to go, whether that is downtown Seattle, SeaTac
$925,000
4 beds2.5 baths2,402 sq ft3,480 sq ft (lot)
217 SW 96th Ln, Seattle, WA 98106
Listing provided by NWMLS as Distributed by MLS Grid
Remodeled in 2023, this 5 bed/4 bath home is ready for a lucky new buyer. The main level features an open kitchen/dining/living space with a lovely gas fireplace, plus 2 bedrooms and 2 baths. The upstairs could serve as a primary floor with its large bedroom, beautiful en suite bath, plus another bedroom for gym/office/whatever you need and deck access. The lower level is perfect for movies, games or playtime and has a bedroom, three-quarter bath and laundry area. Six mini-splits provide heat/AC throughout the home. Home sits on a huge, centrally located lot with tons of garden/entertaining space and a 2-car detached garage that's close to all the fun and dining in DT White Center. Only 10
$1,400,000
5 beds4 baths3,940 sq ft7,963 sq ft (lot)
216 SW 104th St, Seattle, WA 98146
Listing provided by NWMLS as Distributed by MLS Grid
Welcome to this sweet home for big living in West Seattle. This 2bd/1ba home was fully updated in 2020 with cathedral ceilings, recessed lighting, quartz countertop and stainless steel appliances. Further updates include the LVP flooring throughout the living space, fully fenced property including driveway, and lovingly cared for outdoor spaces and garden beds. Enjoy the gazebo, fire pit area, back yard, and park-like setting with the huge grass field next door. This home has the benefits of Greenbridge Neighborhood and shops 2 blocks away, the best food and drinks of White Center, and unbeatable highway access. 10min to the airport, 10 min to downtown, 15min to Ballard, and 20min to Belle
$539,500
2 beds1 bath780 sq ft8,016 sq ft (lot)
10021 1st Ave SW, Seattle, WA 98146
Listing provided by NWMLS as Distributed by MLS Grid
This stunning rambler-style residence has undergone a complete studs-out remodel, boasting luxurious finishes and modern comforts. Nestled on a spacious flat lot, this gem offers ample yard space for creating your private retreat. Relax by the cozy fireplace in the expansive living area or entertain guests in style. Located on a tranquil dead-end street, enjoy peace while being centrally positioned for easy access to Westwood Village, Seatac, and Downtown Seattle. With parks and shopping within walking distance, convenience meets serenity here. Retreat to generously sized bedrooms, including an ensuite primary bath for added luxury. Every detail has been crafted with high-quality features/f
$729,950
3 beds2 baths1,820 sq ft8,010 sq ft (lot)
10005 25th Ave SW, Seattle, WA 98146
Listing provided by NWMLS as Distributed by MLS Grid
Welcome home! Enter into this like-new 2019 Connor-built home that is nestled against a picturesque greenbelt. Over $60,000 worth of upgrades and featuring amenities such as A/C, high-end blinds, custom closets, wine bar, and more! Spacious open kitchen includes a walk-in pantry and tons of counter space - ideal for culinary enthusiasts. On the main level, discover a bedroom with a 3/4 bathroom. Upstairs, indulge in a sprawling primary bedroom, three additional bedrooms, and a generous recreation space. Meticulously landscaped yard boasts an extended patio and artificial turf - ensuring effortless upkeep. Two-car garage offers ample storage. Conveniently located near the 1st Ave S Bridge an
$998,000
5 beds3 baths2,720 sq ft3,760 sq ft (lot)
281 SW 97th Pl, Seattle, WA 98106
Listing provided by NWMLS as Distributed by MLS Grid
Welcome home to this cute one level rambler style home with open floorplan. This house has plenty of natural light throughout and the home, offers an open floorplan, double pane windows, newer roof, new hot water tank, new exterior paint, and new furnace. Flat level lot with good-sized Backyard with space to build a DADU. Build equity by building a DADU in the backyard to sell or to rent. Convenient area just minutes to Hwy 509 & 405, and hip Georgetown. Just 10 minutes to Downtown Seattle. Long driveway to park work trucks, and RV. Come take a look at this charmer while available. $10,000 seller credit if closing by end of May.
$549,500
2 beds2 baths960 sq ft4,590 sq ft (lot)
10622 2nd Ave SW, Seattle, WA 98146
Listing provided by NWMLS as Distributed by MLS Grid
Phase 3 Construction Now Available! Altamura by Conner Homes. This Corner Lot Plan G offers a roomy, open kitchen with quartz counters, a tile backsplash, and under-cabinet lighting. Luxury vinyl plank flooring and a cozy electric linear fireplace grace the main level, along with a bedroom and 3/4 bath. Upstairs, the spacious primary suite boasts a 4-piece bath with double sinks, quartz counter, and tile flooring. Three additional well-sized bedrooms and a generous bonus room await you & 2nd Story Balcony! Step outside to a fully fenced, beautifully landscaped yard, and relax on the covered porch with a gas BBQ stub. Brokers, kindly register buyers before their first visit. Don't miss
$997,900
5 beds3 baths2,487 sq ft4,920 sq ft (lot)
9836 6th Ave SW #50, Seattle, WA 98106
Listing provided by NWMLS as Distributed by MLS Grid
Move-In-Ready! Welcome to Altamura by Conner Homes. Our highly desired Plan B1 showcases a spacious kitchen with quartz counters, tile backsplash, and under-cabinet lighting. Enjoy luxury vinyl plank flooring and the cozy electric linear fireplace on the main level, where a bedroom and 3/4 bath provide convenience. Upstairs, discover the primary suite with a luxurious custom bathroom. Explore three additional generously sized bedrooms and a spacious bonus room. Step outside to the fully fenced corner lot, where a beautifully landscaped sizeable yard and a back porch equipped with a BBQ stub provide functionality. Brokers, kindly ensure buyers are registered before their first visit.
$1,009,900
5 beds3 baths2,487 sq ft5,519 sq ft (lot)
508 SW 98th Pl #46, Seattle, WA 98106
Listing provided by NWMLS as Distributed by MLS Grid
Welcome to this eccentric abode boasting an enchanting facade resembling days gone by. Wander through the corridors adorned with Pacific Northwest local landmark status. Once the curiosity is satisfied use your imagination to see the home with two kitchens and abundant parking/room for toys. Giant shop in the back of the garage available to you for your hobbies, work, or remodel projects. Wide territorial view over Georgetown flowing to Seattle. The zoning for this property is R6. The lot to the north side of the property is included (see zoning for opportunities). Notice the convenient drive-through garage, with access from two separate driveways as well as a roundabout driveway at the ent
$650,000
2 beds2.5 baths2,680 sq ft0.50 acre (lot)
10423 Meyers Way S, Seattle, WA 98168
Listing provided by NWMLS as Distributed by MLS Grid
Embrace luxury in West Seattle. This craftsman gem features a modern kitchen, hardwood floors, and a living area leading to a spacious deck, perfect for entertaining. The upper level boasts a grand master suite with en-suite spa and sunset-view balcony. The lower level offers versatility with a bonus room and extra bedrooms. Unique amenities include a cozy fireplace, cutting-edge entertainment system, quartz countertops, central air, tankless hot water heater and a reinforced deck with a premium hot tub for ultimate relaxation. Enjoy vibrant local dining and nightlife minutes away, ensuring convenience and a high-quality lifestyle. Upgrades totaling $350,000 add unparalleled opulence, makin
$846,000
4 beds3 baths2,548 sq ft3,240 sq ft (lot)
9609 13th Ave SW, Seattle, WA 98106
Listing provided by NWMLS as Distributed by MLS Grid
Tastefully remodeled inside and out with high quality materials. See bonus room for WFH office, baby room, or den. Main bathroom should be appreciated in person. Hardwood bamboo and tile floors. Lots of natural light throughout with vaulted ceilings, big windows, and skylights. Great comfort from the A/C and high efficiency Heat Pump. Enclosed deck makes a great sunroom with a planter and tool storage. Thoughtful landscaping with flower and vegetable gardens. Cute gazebo at the high corner of property yields amazing sunset views. Solid storage shed for all your tools. Brand new hot water heater. Tasteful cabinets, roof, cedar siding, heat pump installed in 2021-22. Spacious driveway for off
$487,000
2 beds2 baths1,120 sq ft8,160 sq ft (lot)
9848 26th Ave SW, Seattle, WA 98106
Listing provided by NWMLS as Distributed by MLS Grid
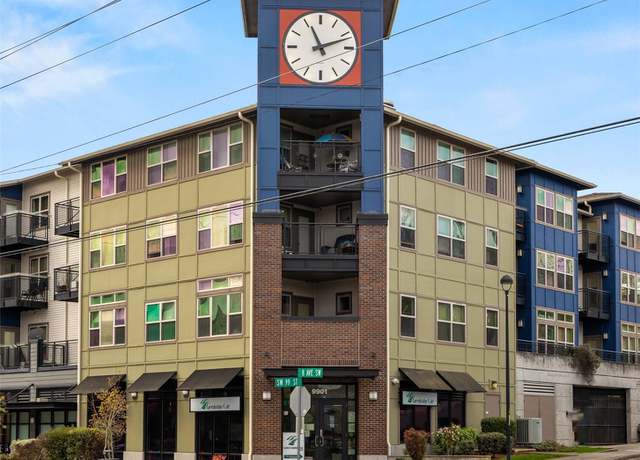
$50K PRICE IMPROVEMENT! Perfectly central & move-in ready, this sweet one-owner townhome is your chance to step into homeownership! A spacious open layout greets you w/ hardwood floors, fresh paint, a cozy gas fireplace & an updated kitchen w/ new quartz counters & updated appliances. 3 generously-sized bdrms offer plenty of space while a large, clean unfinished bsmnt is ready for your creative approach: bring your toolbelt to finish it out or use it for storage, a gym & more. A private 2-car garage & secure gated entry offer you peace of mind as you stroll your lively neighborhood close to dining, breweries & parks. Incredibly fast to downtown, SeaTac &
$499,999
3 beds2.5 baths2,162 sq ft2.56 acres (lot)
9743 26th Ave SW #602, Seattle, WA 98106
Listing provided by NWMLS as Distributed by MLS Grid
Wonderful location 5 minutes to Seattle in this all remodeled duplex, new paint in and out, new roof, new windows, new floors, new counters in bathrooms and kitchens, main level unit with 3 bed, full bath, full big kitchen and living area can be used as an office or business, same upstairs 2 bedrooms full bath, full kitchen and living area all ready to be occupied. CBPSO zoning allows residential and commercial, property has space for about 8 cars to park, a huge flat backyard. Perfect opportunity to live above your business or rent to supplement your income. More units can be built (buyer to verify), property is under King County jurisdiction, seller never rented the building or either uni
$1,000,000
— beds— baths2,400 sq ft6,260 sq ft (lot)
10730 S Myers Way, Seattle, WA 98168
Listing provided by NWMLS as Distributed by MLS Grid
Superb rehab and development opportunity near Westwood Town Center and up and coming White Center! Set on a huge 16,320 SF lot, don't let this homes rough exterior deter you, this home has amazing potential. Open floorplan with spacious sunny living spaces. 1 bedroom and a full bath on the main. Huge sunken rec room. Second level with primary bedroom with full bath ensuite and private deck. Third bedroom completes this level. Potential to sub divide and build a second home with ADU (Buyer to verify). Rehab the existing home and bring in rental income while you sub-divide and build. This is a rare opportunity, don't miss it!
$799,950
3 beds2 baths1,960 sq ft0.37 acre (lot)
9826 26th Ave SW, Seattle, WA 98106
Listing provided by NWMLS as Distributed by MLS Grid
Attention developers & home builders - OUTSTANDING RESIDENTIAL VIEW LOT near trending White Center! Cascade foothills/mountain views, beautiful sunrises! Build your own dream house or possibly combine w/ adjacent parcel for sale to build a 4+ dwelling units? Formerly a flat yard/lawn provides great building lot w/ level foundation area & gentle slope to paved street. 5205 sq ft parcel fully containing Lot #23 in Block 15, Beverly Park Div No. 1. Abuts another parcel for sale (MLS#2202436) that is 21,877sf fully containing lots 20, 21 & 22. Water/Sewer/Power/Gas in street. Close to Rainier & Glen Acres Golf Clubs. Quick access & short commutes to 509, 99, I-5, D
$175,000
— beds— baths5,205 sq ft (lot)
104 XX Meyers Way S, Seattle, WA 98168
Listing provided by NWMLS as Distributed by MLS Grid
Great Investment opportunity to develop in the vibrant, growing West Seattle area. Listing includes subdivision plan for 4 lots approved details attached. Recent Up Zoning allows for 7 lots if desired. TDR option to increase volume to 11 lots info attached or ask LA to details (Buyer to verify). Zoning is R12P. Everything is done just bring your plans and start the project. All docs are attached and available upon request. Utilities in street. Excellent neighborhood with huge upside. Seller open to owner financing negotiable.
$1,000,000
— beds— baths0.62 acre (lot)
9806 30th Ave SW, Seattle, WA 98126
Listing provided by NWMLS as Distributed by MLS Grid
Based on information submitted to the MLS GRID as of Wed Apr 24 2024. All data is obtained from various sources and may not have been verified by broker or MLS GRID. Supplied Open House Information is subject to change without notice. All information should be independently reviewed and verified for accuracy. Properties may or may not be listed by the office/agent presenting the information. Some IDX listings have been excluded from this website.
School data is provided by GreatSchools, a nonprofit organization. Redfin recommends buyers and renters use GreatSchools information and ratings as a first step, and conduct their own investigation to determine their desired schools or school districts, including by contacting and visiting the schools themselves.Redfin does not endorse or guarantee this information. School service boundaries are intended to be used as a reference only; they may change and are not guaranteed to be accurate. To verify school enrollment eligibility, contact the school district directly.
Homes for sale in White Center have a median listing price of $760K. Some of these homes are Hot Homes, meaning they're likely to sell quickly.
What are some of the most popular neighborhoods in White Center?
Popular neighborhoods include Inglesea, Shorewood, Riverton, Delridge, Salmon Creek, Shorewood, Seola Beach, Greater Duwamish, Highland Park, and West Seattle.
White Center, Washington offers a variety of transportation options, including public transit services. The area is served by King County Metro, providing residents with bus routes to various destinations. For those who prefer to drive, traffic levels can range from moderate to heavy, especially during rush hours. Additionally, White Center is conveniently located near several major highways, including Route 509, making it easy to navigate by car.
What types of properties are available in White Center?
White Center, Washington offers a variety of single-family home types, including ranch-style homes, split-level homes, and contemporary homes. These homes can be found throughout the neighborhood, with many options available in established residential areas. Most properties feature 2-4 bedrooms and were built between the 1950s and 1980s. To explore different property types for sale in White Center, Washington, use the 'Home type' filter located above the active listings. Customize your search by selecting options like single-family homes, condos, townhomes, and more.
What is life like in White Center?
White Center, Washington offers a unique living experience with its diverse community and vibrant atmosphere. The landscape is characterized by lush greenery, rolling hills, and picturesque views. The weather in White Center is known for its mild summers and cool, wet winters. The area provides a range of job opportunities across various industries, allowing residents to pursue their career goals. When it comes to things to do, White Center offers a plethora of entertainment options, including local eateries, shopping centers, and recreational activities for individuals of all interests.
What are the schools and amenities like in White Center?
White Center, Washington boasts a variety of public amenities for its residents. The area is home to several restaurants, offering a wide range of culinary experiences. Numerous parks provide open spaces for relaxation and recreation. Residents also have access to multiple grocery stores for their daily shopping needs. Additionally, White Center offers more amenities such as libraries, fitness centers, and community centers, enhancing the quality of life in the region.
In the past month, 8 homes have been sold in White Center. In addition to houses in White Center, there was also 1 condo, 2 townhouses, and 1 multi-family unit for sale in White Center last month. Find your dream home in White Center using the tools above. Use filters to narrow your search by price, square feet, beds, and baths to find homes that fit your criteria. Our top-rated real estate agents in White Center are local experts and are ready to answer your questions about properties, neighborhoods, schools, and the newest listings for sale in White Center. Our White Center real estate stats and trends will give you more information about home buying and selling trends in White Center. If you're looking to sell your home in the White Center area, our listing agents can help you get the best price. Redfin is redefining real estate and the home buying process in White Center with industry-leading technology, full-service agents, and lower fees that provide a better value for Redfin buyers and sellers.


 REDFIN IS COMMITTED TO AND ABIDES BY THE FAIR HOUSING ACT AND EQUAL OPPORTUNITY ACT. READ REDFIN'S FAIR HOUSING POLICY AND THE NEW YORK STATE FAIR HOUSING NOTICE.
 United States
 Canada