Discover this exceptional two-story home located in a desirable area of Winchester, boasting a prime location with no HOA fees. Step inside to a clean tile entrance leading to a beautifully designed interior featuring PAID OFF solar panels for energy efficiency. Enjoy gatherings in the expansive kitchen featuring a large center island, double oven, cooktop, and a convenient walk-in pantry, ideal for hosting and entertaining. The kitchen, great room, and entryway are adorned with waterproof luxury vinyl flooring, combining practicality with elegance. Notable features include new water heater, high ceilings throughout, and numerous upgrades and personal touches, ensuring comfort and style. Be
This French Valley home has a true California dreaming back yard with panoramic mountain views, situated on a 1/4+ acre end of culdesac lot. A private oasis to entertain friends & family. Gorgeous pool w/ baja shelf for lounging, waterfalls, lighting, spa and fire bowl. Allumawood covered patio w/ fans & large screen TV. Professionally landscaped yard includes palms, fruit trees, wood fire pit, bocce ball court, kennels for the dogs & shed for extra storage. Main floor bedroom w/ ensuite for multigenerational living. Patio @ front door opens to a huge great room w/ fireplace, TV, dining room & kitchen. Kitchen appointed w/ island, pendant lighting, stainless applianc
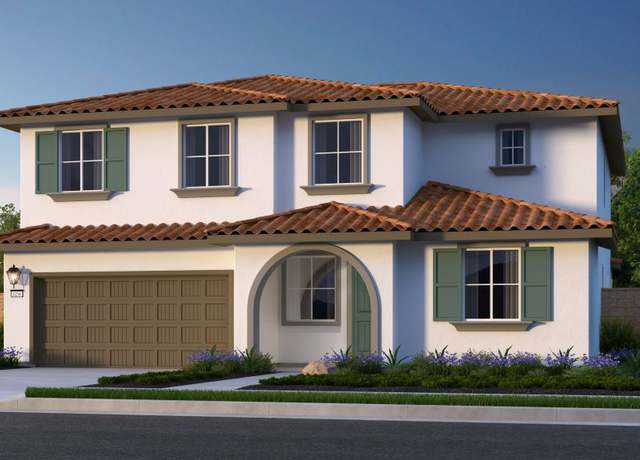
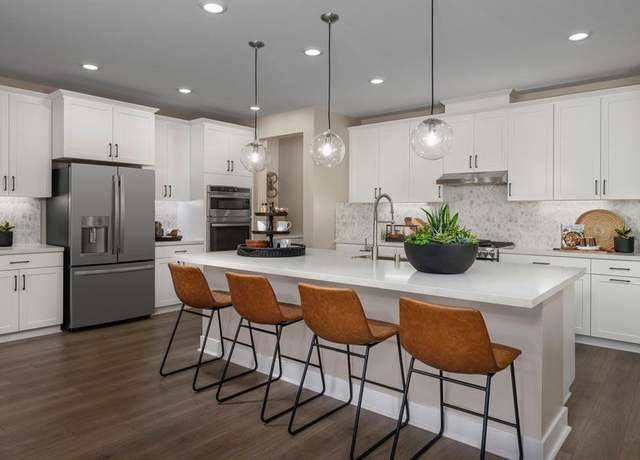
MLS#EV24079986 December Completion - REPRESENTATIVE PHOTOS ADDED. Introducing Azul Plan 1! Step inside to a stunning foyer leading to an open-concept layout, featuring a gourmet kitchen overlooking the dining area and great room. Flex space on the main floor offers versatility for a home office or gym. Upstairs, three bedrooms include a spacious primary suite with a large walk-in closet. Enjoy a grand primary bathroom, upstairs laundry, and tech space. Home amenities include white shaker cabinetry, whole-home air filtration, attached two-car garage, and designer touches throughout. Perfect for families! Design upgrades include: quartz countertops, upgraded flooring and backsplash. Design op
MLS#EV24079946 REPRESENTATIVE PHOTOS ADDED. Welcome to the stunning Azul Plan 2! Step through the front door into a beautiful foyer, inviting you into this exquisite home. On the first floor, discover a flexible room with a closet for added storage. The open-concept layout seamlessly integrates the gourmet kitchen, dining area, and great room, ideal for modern living. Upstairs, three bedrooms offer ample space for families, including a spacious primary suite with an oversized walk-in closet and a luxurious bathroom. Enjoy the convenience of an upstairs laundry room and a bonus loft, perfect for family gatherings and game nights. Revel in elegant features like white shaker cabinetry, granite
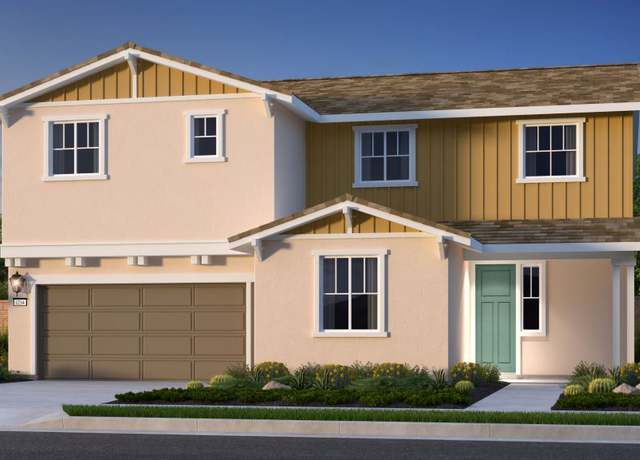
MLS#EV24079888 REPRESENTATIVE PHOTOS ADDED. Step into the expansive Plan 3 at Azul at Siena, greeted by a covered porch. The heart of this home showcases a great room seamlessly connected to the dining area. Discover a chef's dream in the first-floor kitchen, boasting a cozy island and walk-in pantry. A full bathroom and an additional bedroom downstairs offer convenience and versatility. Upstairs, find solace in the spacious primary suite with an oversized walk-in closet and dual vanities. Two more bedrooms, a loft, and a laundry room complete the second floor, ideal for a large family. Enjoy amenities like an attached two-car garage, elegant white shaker cabinetry, granite countertops, and
MLS#EV24079817 REPRESENTATIVE PHOTOS ADDED. Welcome to Azul at Siena Plan 4! Enter through your covered porch into this stunning home. The hallway leads to a great room, dining area, and spacious kitchen with island and walk-in pantry. A quiet tech area on the main floor offers a perfect work-from-home space. There's also a guest bathroom and bedroom downstairs. Upstairs, the primary suite features a large walk-in closet and deluxe bathroom. Two more bedrooms, a loft, and laundry room complete the second floor. With an attached two-car garage, white shaker cabinetry, and whole-home air filtration, this home is designed for comfort and style. Design upgrades include: quartz countertops, upgr
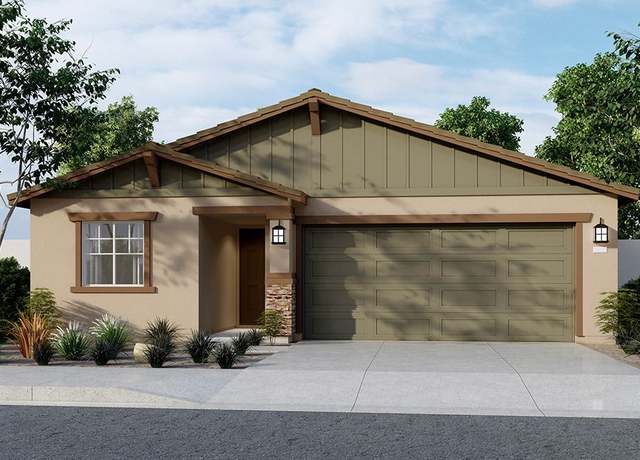
NEW CONSTRUCTION in Winchester – This lovely SINGLE-STORY 1,342-sf 3BR / 2BA California Bungalow façade home has a COVERED PORCH, island kitchen with breakfast bar, New Valle Nevado granite countertops, built-in stainless steel appliances and double-door pantry. The main bedroom has an ensuite bathroom that includes dual vanity sinks, a walk-in shower and wardrobe closet. There are two additional bedrooms and a full bathroom and a conveniently located laundry room. This home comes with White shaker-style cabinetry, lots of included recessed lighting throughout, with Birdbath carpet in bedrooms and closets and Rustic Taupe vinyl in main living areas! A truly modern home, it has
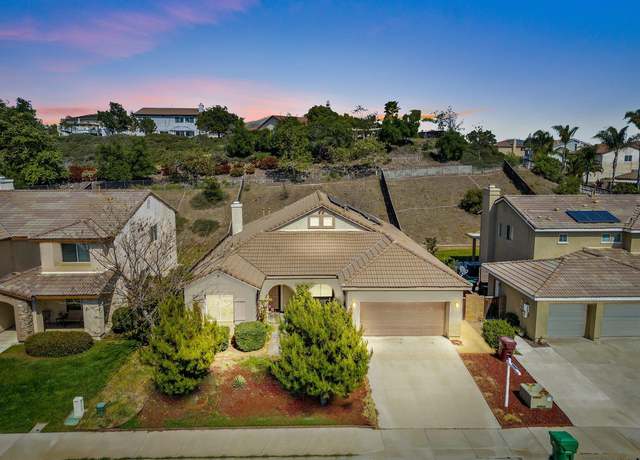
Location!! Location!! Located in one of the most desirable areas of Winchester Valley. From the time you walk in the front door, you will know you have found your forever home. This turn key single story home features many upgrades galore. Home features 4 Bedrooms, 2 Bath, Office, 2089 Square Feet. Upgraded Flooring, Carpeting, Lighting, Recessed Lights, Electrical & Custom Two Tone Paint throughout. Very Spacious Living/Family Room, Dining Area & Kitchen with upgraded cabinets, Backsplash & Quartz Counter tops & Stainless Steel Appliances . Master Suite, with Designer Amenities. Separate Laundry Room, with sink. Beautifully Landscaped, Low Maintenance Front Yard, wi
Welcome to 34572 Burnt Pine! This home shows like a model home and the sellers have spared no expense! Over $140,000 in builder upgrades. Located on a prime end lot with only one neighbor and no one in front of you or behind you, it is located in the highly desirable resort-style community of Spencer's Crossing in Murrieta! This is a beautiful, immaculate OPEN CONCEPT Single Story Home with 4 Bdrm, 2.5 Bath. Before entering the house to the right of the front door there's a porch w/ retractable awning where the sellers sit & relax after a long day to watch the sunset. Upon entering the home through the security screen door you see the high ceilings & custom vinyl plank flooring
Like new gorgeous 5 bed 3 bath plus a loft and 3 car garage home was just built less than 1 year ago. Located in the new Taylor Morrison Siena development, which will have a community pool. $25k in Paid off Solar. Has a fabulous view of the valley from the back of the house. Modern luxury vinyl plank floors throughout the downstairs. Very open flow as the living room opens to the kitchen. The kitchen has a large walk in pantry, quartz counters, white subway tile backsplash and two ovens. Tankless water heater. Garage camera on pinpad and garage opener. Rain gutters. Stucco covered patio off the back door. Buyers paid a $23k lot premium. In the award winning Temecula Valley Unified School Di
MLS#EV24078377 REPRESENTATIVE PHOTOS ADDED. Welcome to the Plan 9! This family friendly home features four bedrooms and three full baths with a spacious bonus loft and 3-car tandem garage. The primary suite includes an oversized walk-in shower, double vanity, enclosed water closet, and a luxurious soaking tub. Two additional bedrooms, a full bath, and laundry room complete the upstairs space. A secondary bedroom and full bath tucked away at the front of the first floor is perfect for family or friends who visit. The chef-inspired kitchen offers everything you need at your fingertips including quartz countertops, a cozy kitchen island and a large walk-in pantry. The expansive great room open
This two year old energy efficient Lennar home is situated within the Reserve Community in French Valley. Save $$ money with a FULLY PAID OFF SOLAR SYSTEM, as well as a NEMA 14-50 50 AMP outlet on a 249 volt for charging your electric car. Step inside to discover upgraded Luxury Vinyl Plank flooring and custom painted accent walls, setting the stage for contemporary elegance. This home is perfect for entertaining with a kitchen is a chef's dream, featuring a walk-in pantry, stainless steel appliances, quartz countertops and a spacious center island that seamlessly flows into the family room. Adjacent to the kitchen, you'll find a convenient laundry room with extra cabinetry and a powder roo
Welcome to your new sanctuary in the heart of Hemet! Nestled on a serene corner lot, this immaculate manufactured home offers a perfect blend of comfort, convenience, and breathtaking views of the mountains. Sprawling over 1344 square feet, this spacious home provides ample room for your lifestyle needs. Enjoy 2 cozy bedrooms and 2 pristine baths, ensuring privacy and relaxation. Entertain with ease in the generous living room, flooded with natural light and designed for comfort. Discover culinary bliss in the open kitchen, equipped with a convenient center island, double ovens, and abundant cabinet space for all your storage needs. Say goodbye to laundry woes with your own individual laund
Winchester - New 2022 family residence situated at the end of a cul-de sac with no homes behind to give ultimate privacy out to the Temecula hot air balloons. The home sits on one of the largest lots in the community, that gives you loads of potential to create the ultimate entertaining space. The home draws you in with its enlarged driveway and eco-friendly landscaping. Upon entering, you are greeted with an open floor plan with loads of light shining in onto the dining, family room and kitchen. The heart of the home lies within these spaces where the kitchen dazzles with its pristine white cabinetry and a spacious island that opens up to the dining area creating functionality and style. T
Welcome to your dream single story pool home nestled in a cul-de-sac! This stunning turnkey home is an entertainer’s dream. The ample size back yard is complete with large covered patio, your own private in-ground pool surrounded by low maintenance turf and palm trees. The interior is very tastefully done and boasts over 2,600 sqft of living space that includes 4 bedrooms, 3 full baths and a large 3 car tandem garage. The heart of the home is the spacious open concept throughout the kitchen, living and dining area, perfect for both intimate family gatherings and entertaining guests. The home features beautiful luxury vinyl plank wood floors, white cabinetry, high ceilings, elegant lig
Enjoy Murrieta living in this well-maintained 3-bedroom, 3-bathroom home. This property boasts a spacious layout, perfect for entertaining or relaxing. Unwind in the private backyard or take a refreshing dip in the community pool on a hot day. The convenient Murrieta location provides easy access to shopping, dining and outdoor adventures. This move-in-ready home is ideal for those seeking comfort, convenience and a touch of SoCal charm. Schedule your private tour today!
Welcome to Agave Drive in the thriving city of Winchester, where the charm of a modern townhome meets the convenience of a prime location. Nestled close to new shopping destinations, including Costco, and a short drive from the Temecula Promenade, this home is ideal for those who appreciate both urban living and the great outdoors. Nearby, you can explore the renowned Temecula wineries or enjoy a day of fishing at the picturesque Lake Skinner. This residence boasts a wealth of upgrades that enhance comfort and style, featuring luxury vinyl flooring and premium carpet and padding that create a cozy and inviting atmosphere. The kitchen is a highlight with its elegant granite countertops and s
Welcome to 35225 Lantern Light Dr. , Winchester, CA - a breathtaking 2016-built Californian gem nestled within Temecula's prestigious school district. This expansive residence sprawls over 3,213 sqft, featuring 5 well-appointed bedrooms and 3 luxurious bathrooms, designed to offer both elegance and functionality in a serene 8,712 sqft lot setting. Upon entering, be greeted by a grand hall that introduces a versatile sitting room/office and a sophisticated formal dining area, leading to the heart of the home where family life unfolds in style. There are significant upgrades throughout the entire home. The rear expanse opens to a spectacular family room adorned with a fireplace, seamlessly co
This stunning home offers 5 bedrooms and 4.5 baths, offering ample space and comfort for families. Step inside to discover an upgraded kitchen, flooring, and a newly installed backyard patio cover, perfect for outdoor entertainment. Dive into luxury with a sparkling pool, added less than 4 years ago. Enjoy the convenience of a water soft system for everyday living. The cherry on top? Solar panels are fully paid off, providing energy efficiency and savings. But that's not all - there's already secured plans approved by the city for the addition of an ADU, providing endless possibilities for customization and expansion. Don't miss out on this incredible opportunity to make this home your own!
POOL/SPA HOME with Solar owned and 3 car garage - 5bed/4bath home (one of the upstairs bedrooms is currently being used as the loft). There is one main floor bedroom and the laundry room is Upstairs. Hooray no lugging laundry up and down the stairs! New LVP flooring on the staircase and upstairs rooms. Front yard is landscaped and backyard is ready for fun! There is an out door built-in cooking area plumbed directly with gas. It has a rotisserie and fridge too! While the cooking and swimming is going on you can kick back and relax by the conversation height fire pit plumbed directly to gas too! This home has it ALL!!!!! All info deemed reliable but not guaranteed. Buyers and their agent
School data is provided by GreatSchools, a nonprofit organization. Redfin recommends buyers and renters use GreatSchools information and ratings as a first step, and conduct their own investigation to determine their desired schools or school districts, including by contacting and visiting the schools themselves.Redfin does not endorse or guarantee this information. School service boundaries are intended to be used as a reference only; they may change and are not guaranteed to be accurate. To verify school enrollment eligibility, contact the school district directly.
Winchester, California, is a semi-rural area where car transportation is the primary means of commuting. The traffic levels in Winchester are typically lighter than in more densely populated areas, making driving relatively stress-free. Unfortunately, Winchester does not have a public transportation system, so residents rely heavily on cars for their daily commute. The region is conveniently located near major highways, with easy access to Interstate 215 and State Route 79, facilitating travel to nearby cities.
What types of properties are available in Winchester?
Winchester, California offers a variety of single-family home types, including ranch-style homes, contemporary homes, and modern homes, each with their own unique architectural styles and designs. These homes can be found throughout Winchester, California, in neighborhoods such as Winchester Hills, Meadowview, and French Valley, among others. Most properties in Winchester, California feature three to five bedrooms and were built within the last decade. To explore different property types for sale in Winchester, California, use the 'Home type' filter located above the active listings. Customize your search by selecting options like single-family homes, condos, townhomes, and more.
What is life like in Winchester?
Winchester, California offers a serene and picturesque living experience with its beautiful landscape. The region boasts a variety of natural features, including rolling hills, expansive fields, and charming rural areas. The weather in Winchester is characterized by mild winters and warm summers, creating an enjoyable climate for outdoor activities. The region provides a range of job opportunities across various industries, ensuring residents have access to diverse career options. In terms of entertainment, Winchester offers a plethora of recreational activities, including hiking, biking, and exploring the scenic countryside.
What are the schools and amenities like in Winchester?
Winchester, California offers a variety of public amenities to its residents. There are several restaurants available for dining, offering a diverse range of cuisines. For outdoor lovers, the region boasts a number of parks, perfect for leisure and relaxation. Grocery stores are also available, ensuring convenient access to daily necessities. Additionally, Winchester provides other amenities such as schools, libraries, and healthcare facilities, enhancing the quality of life for its residents.
In the past month, 69 homes have been sold in Winchester. In addition to houses in Winchester, there were also 7 condos, 7 townhouses, and 1 multi-family unit for sale in Winchester last month. Find your dream home in Winchester using the tools above. Use filters to narrow your search by price, square feet, beds, and baths to find homes that fit your criteria. Our top-rated real estate agents in Winchester are local experts and are ready to answer your questions about properties, neighborhoods, schools, and the newest listings for sale in Winchester. Our Winchester real estate stats and trends will give you more information about home buying and selling trends in Winchester. If you're looking to sell your home in the Winchester area, our listing agents can help you get the best price. Redfin is redefining real estate and the home buying process in Winchester with industry-leading technology, full-service agents, and lower fees that provide a better value for Redfin buyers and sellers.


 REDFIN IS COMMITTED TO AND ABIDES BY THE FAIR HOUSING ACT AND EQUAL OPPORTUNITY ACT. READ REDFIN'S FAIR HOUSING POLICY AND THE NEW YORK STATE FAIR HOUSING NOTICE.
 United States
 Canada