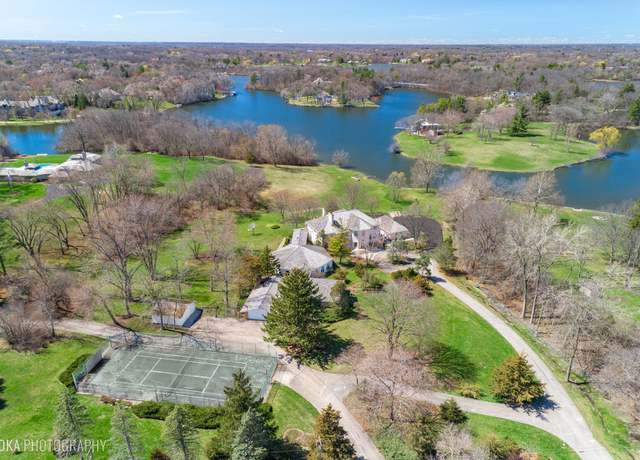
Welcome to lakeside luxury living at its finest! Nestled along the tranquil shores of breathtaking Keene Lake, unveil the potential of this enchanting home and let your design dreams unfold in this private, idyllic setting. The interior of the home has been virtually staged to reflect the possibilities that exist within. Indulge in resort style amenities right at home with an incredible attached indoor pool house featuring cedar walls and ceilings, a 20x40 ft inground pool with hot tub plus a soothing sauna room. From the moment you arrive, you'll be captivated by the stunning architectural details and serene lake views that envelope this remarkable property. Step inside to discover a world
Experience the epitome of luxury living in this exquisite Barrington Hills estate, nestled on 5.11 acres of breathtaking scenery. This distinguished property boasts a spectacular 5-bedroom, 5-bathroom residence complemented by a backyard sanctuary that caters to both discerning homeowners and their beloved horses or favored hobbies. Step into a world of indulgence with a 20 x 40 saltwater pool accompanied by a rejuvenating hot tub, meticulously landscaped gardens, and a serene koi pond complete with a cascading waterfall. Entertain in style on expansive decks and patios, equipped with an outdoor kitchen, fireplace, and firepit, ideal for alfresco dining and gatherings under the stars. For t
Set amidst ANCIENT OAK TREES and LUSH ORCHARDS, this exquisite ESTATE exudes OPULENCE and TRANQUILITY. Feel the serene embrace as you step onto the grounds, surrounded by the WHISPERS of the MATURE FOREST. Beyond its NATURAL BEAUTY, this residence offers tailored amenities. Picture leisurely mornings in the CEDAR VEGETABLE GARDEN or collecting FRESH EGGS from the HENHOUSE. Equestrian enthusiasts will appreciate the well-appointed STABLE for two horses and the ample space in the GOLF CART GARAGE/SHED. Rest assured with a FULL HOUSE POWER GENERATOR for uninterrupted comfort. Inside, LUXURY awaits with the CHEF'S DREAM KITCHEN, separate DINING area, and BREAKFAST NOOK. Five spacious BEDROOMS,
Radiating a sense of warmth, charm, and sophisticated elegance, this exquisite home epitomizes luxury living at its finest. Situated on a tranquil and private 5.6-acre property in the heart of Barrington Hills, this French Country estate, crafted by renowned builder Robert Parker Coffin, boasts a delightful mix of original architectural details and modern updates and exudes a sense of timeless beauty. From detailed millwork and beamed ceilings to beautiful hardwood floors and cozy fireplaces, every corner of this residence showcases impeccable craftsmanship and design. The highlight of the property is the spectacular indoor pool with a private deck and his & her full baths, offering a
Located in the heart of Barrington Hills / Spacious 2 story home situated on 5.2 acres of land. Breathtaking views from your patio and balconies, plenty of outdoor space perfect for entertaining, including in ground pool and poolhouse. This property has 7 bedrooms, 6.3 bathrooms and over 10,000 sq ft of living space, gorgeous Master Suite with cathedral ceilings 9 ft in height, full basement and 6 car garage. Please see agent remarks for Offer Submission Instructions.
A rare opportunity to create your dream estate on a prime 40+ acre parcel in the heart of Barrington Hills! Offering the ultimate in privacy and a prestigious Brinker Road address, this acreage is ideal for equestrians, nature lovers and hobbyists. Steeped in history, this incredible property has been treasured by the same family for over 50 years and was created from a combination of historic estates from the 17th and 18th centuries and, in 1922, was transformed into the main house of the Dorville Dairy. Graciously tucked away, the serene, bucolic setting will steal your heart with towering trees, sweeping lawns, manicured grounds and magnificent views of nature. A true treasure, this dist
Barrington Hills brings a new flex to the equestrian community with a traditional exterior design and a charming front porch leading the way to a transformed modern flare! The expansive two-story foyer showcases an artistic yet elegant black staircase with an open concept to a sprawling living room with plantation shutters and gorgeous views of the paddocks. On the opposing side of the foyer is an elegant dining room with oversized windows and a brilliant butler's pantry conveniently located off the fully remodeled kitchen. The kitchen offers a chic fashion designed cabinet with a leather like finish, quartz counters, stainless steel appliances including two separate refrigerators, three ov
Artistic contemporary, impressive estate in affluent Barrington Hills, showcasing the pinnacle of modern design, exquisite craftsmanship, and luxurious living. Seamlessly blending architectural innovation with the natural beauty of 22 acres of pristine grounds, it offers a sanctuary of elegance and tranquility. Tucked at the end of a private cul-de-sac, the expansive setting includes a four acre pond with water features, (perfect for paddleboarding), extensive lawns, patios, and paths for hiking, horses, mountain biking and snow shoeing. Excellence and luxury redefined, this estate takes the definition of world class to a whole new level. PA private tree-lined winding drive leads to this st
Steeped in history and set on a prime 25+ acre site, this quintessential Barrington Hills home was 17 years in the making! This residence boasts custom architectural details reserved for masterpiece builds including rich walnut trim and doors, plaster crown moldings, herringbone hardwood flooring and 5 fireplaces. Incredible living and entertaining space are found throughout including a grand two-story entry with dual staircases, living room with soaring ceilings, dining room with adjacent butler's pantry and a magnificent study! Chef's will delight in the striking kitchen and breakfast room where you can enjoy panoramic views of the rear yard. Entertaining is a breeze with the large family
Quintessential Barrington Hills Estate in the private enclave of Oak Brae. Set on 8.7 Acres with a pond (stocked), the current owners have enjoyed the charm of an old fashioned setting where their 5700 plus square foot colonial rests. It holds many large rooms that are big on style, built-ins, and character. The 3 car garage, potting shed and Walden Pond with it's hand-built cabin overlooking it are irreplaceable. 100 year old wood was harvested from the family farm to use for the cabin. Much of the interior has been freshly painted. Each bedroom is unique and appealing. The Primary Bedroom on the first floor, (currently used as a library) offers an ensuite bathroom. There is a Primary Bedr
Just completed new construction! Welcome to 27 Abbey Woods Drive combining modern design with old world craftsmanship. Lavish custom home with high end finishes throughout. Grand foyer and staircase combine with dining room and office. Office and double as a 5TH Bedroom and is attached to a luxury bathroom with curbless shower. The heart of this home is the gourmet chef's kitchen featuring Thermador stainless appliances, massive center island with prep sink, pendant lighting, butler pantry, walk-in pantry and tons of custom cabinets. Kitchen combines with breakfast room and family room to create on open space perfect for togetherness and entertaining. Main level laundry and mudroom with dog
Completely remodeled move in ready Brick and cedar Ranch on arguably the best 5 acre lot in all of Barrington Hills. Professionally landscaped. Completely fenced in on hilltop tucked away near end of quiet road. 12 zones of irrigation with your own walking paths through perennial gardens . Two-tier bluestone patio with shade Pergola, bluestone fire pit, fruit trees, herb and vegetable garden and a newer 24 foot x 34 foot accessory building that can be used as extra garage or easily converted to a Barn. Home also has been completely remodeled inside and out. Water heater, ejector pump, plumbing drinking lines new to copper, update electrical 2016 and 2019. New Pella windows, attic and crawl
Presenting 4 Marbury Lane, Barrington Hills : : A meticulously crafted custom home that leaves no detail untouched and truly redefines luxury living in a most wonderful location! Step inside to discover the impressive 2-story foyer adorned with extensive moldings and trim, gleaming hardwood floors and a seamless open floor plan. Designed with both style and functionality in mind, this updated kitchen is a chef's dream! Features include beautiful Quartz countertops & backsplash, Wolf 4-burner gas cooktop & downdraft venting, Kohler Artifacts faucet & stainless steel sink, trending brass hardware & fixtures. Other notable finishes include two Kitchen Aid wall ovens, Su
A rare opportunity to own an absolutely breathtaking French Provincial chateaux set on 5 serene acres majestically overlooking the 246-acre Hill 'n Dale Preserve. Timeless luxury is found throughout with elegant appointments, meticulous architectural details and incredible craftsmanship representing the ultimate in beauty and lifestyle. This stately home is ideal for large scale entertaining (as featured in Luxe magazine) as well as relaxed family fun. Featuring grand sized formal rooms, including a spectacular 2-story great room and living room both with grand fireplaces, an award-winning chef's kitchen, a handsome library with attached study and wrapping room, and a magnificent first floo
Welcome to 541 Merri Oaks Road, fully renovated stunning grand estate- situated on 25 acres of pristine forest in the heart of Barrington Hills and horse country! With almost 12,000 square feet, this home features an indoor basketball court, an Amdega Conservatory imported from England, and an in-law apartment. The property also boasts a Guest House with outdoor pool, full size tennis court, and access to a gazebo overlooking a creek. Truly your own resort! Inside, take in the gorgeous historic millwork in this 1940s home. Enjoy a bright eat-in Kitchen featuring an Aga oven, a first floor Primary Suite, a handsome library, 5 bedrooms throughout, and more. Entertain friends, family, and oth
Barrington Hills meets So Cal in this incredible contemporary resort style home set on a serene 5-acre site! Offering the ultimate in luxury, design, and cutting-edge technology, this light filled home radiates elegance and energy! Soaring ceilings, oversized windows, floating staircases and incredible views welcome you to this show stopping home! The open floor plan is built for entertaining and family fun including a spectacular outdoor area with inground saltwater pool with spa hot tub, huge patio and sunroom that transforms into an outdoor oasis with accordion doors, kitchen area with grilling station and gas fireplace. Breathtaking views, coffered two-story ceilings and a striking cust
This remarkable remodeled masterpiece in Barrington Hills is set on 5+ waterfront acres The setting is unmatched by any standard and features a private beach with stocked lake, lakeside firepit, inground pool, 2 sided outdoor fireplace with pergola, outdoor riding arena and fenced pastures with a run-in shed. This is your at-home vacation retreat- to enjoy every day, for a weekend or Summer compound! A grand Great Room is stunning in design and grandeur and is the focal point of the 10,000 + square feet of living space with an opulent elevator giving easy access to each level. The Primary Bedroom Suite is conveniently located on the first floor encompassing it's own wing of the home. A m
Welcome to the chance of a lifetime! This sprawling 10.679 acre estate on the only peninsula in Keene lake will be yours after decades of being loved by its current owners! You can build the most extravagant home in all of Barrington, because this lot will match your wildest dreams! 71 Hawthorne road is the epitome of opulence. As you enter the secluded driveway, you are greeted by Keene lake to your left, shimmering in all of its beauty. Once you come upon the property, you are left speechless with 270 degree panoramic water views sprinkled with homes valued in excess of $15,000,000! This land has the most gentile slope, the most beautiful mature trees placed just perfectly to accentuate t
Meadow Hill, the ultimate address with a mature tree lined street leading to the unveiling of an exemplified Frank Lloyd Wright inspired design. The brilliant mind of Wright believed in creating harmony with the environment, a philosophy known as "organic architecture. " Wright was the pioneer of bringing the outside in and this concept was perfected in this design. A long winding drive through 5 magnificent acres brings guests to a roundabout where they are introduced to a masterful work of art. The front entry is lined with windows from floor to ceiling giving the effect of a gallery while unfolding to a stunning living room with tranquil views of the yard in a panoramic fashion
Prime location, convenient to I-90, Lake Cook Rd and Barrington High School and Metra. Over an acre of sheltered Private land, only two homes on this private drive. 4 Spacious bedrooms on the 2nd floor, Master suite offers two walk-in closets in tandem. Staircase leading to Full, unfinished, English basement available to be finished for your future needs. First floor 5th bedroom with adjacent full bathroom. 4 Full bathrooms total. High Ceiling family room (20ft) with fireplace. Separate dining room features tray ceiling and spacious formal living room. Two story foyer with grand, open staircase. Huge, sun-filled windows to let in all the natural light. "U" shaped kitchen with cent
Fabulous French Provincial home is privately tucked away in a prime Barrington Hills setting offers nearly 12,000 sq ft of living space on all levels. A stately gated entry and circular brick paver drive with motor court welcomes you to this impressive and elegant home boasting a new cedar shake roof. Rich architectural details, custom Mahogany woodwork, arched Marvin windows and doors, state-of-the-art technology and exceptional quality and design are found throughout. The incredible floor plan allows flexibility for your lifestyle featuring a main floor primary suite, and a Jack and Jill bedroom with adjoining bathroom allowing for true one-level living. An expansive second floor and walk
Architectural elements of Medieval to modern day castle blend in creating an experience that lets your imagination run wild. 6 acres of royalty surround this palace with a wrought iron gate leading to a winding drive and an alluring entry. Arcading outlines the foyer wrapped in stone while defining the separation of living room with herringbone wood floors returned to its natural state, tin ceilings, majestic fireplace and a sprawling window overlooking the indoor pool. On the opposing side of the foyer is an inner ward overlooking the 2-story staircase, sliders to pool and access to the dining room through 8' solid pocket doors. The dining area is centrally located with access to a wet bar
This exquisite five acre estate on Mirror Lake is in the in the heart of Barrington Hills, tucked away in privacy, yet so close to town, shopping and schools. Offering a captivating fusion of Old World charm and modern elegance, this sanctuary provides a tranquil retreat, worthy of a five-star Mediterranean resort. Perched on a private cul-de-sac, an impressive circular driveway leads to the stunning home, pool house, and awe-inspiring expansive and elegant courtyard - a personal haven for relaxation and entertaining. A pristine sparkling pool invites you to take a refreshing dip, and the adjacent luxurious spa beckons, promising soothing moments of indulgence and rejuvenation. Unwind in st
Stunning and timeless French Country home set in a prime 16+ acre Barrington Hills location where landscape, luxury and lifestyle marry together to create harmony and balance. Perfect for equestrians, hobbyists and nature lovers, this home has been refined to a new level of sophistication with incredible attention to detail and a thoughtful floor plan perfect for large scale entertaining blended with intimate gathering spaces. Soaring glass windows and volume ceilings fill the space with natural light creating a seamless transition from inside to out. Main floor highlights include a chef's dream kitchen, stunning great room, luxurious living and dining rooms as well as two offices. First fl
The seller is prepared to reduce the interest rate for fortunate buyers by 2% below the current rate during the first year, and by 1% below the current rate during the second year, provided the mortgage is secured through our preferred lender (Also known as the Two-One Buy Down). Astounding Estate built with uncompromising quality and constructed with the highest attention to detail. This all brick and stone masterpiece offers over 10,000 square feet of lavish luxury and situated on over 5 acres of lush green landscape. Exquisite finishes, superior craftsmanship and impeccable millwork throughout. The custom made iron gate opens up to a stunning grand entry. The real "WOW" factor
Orren Pickell has truly outdone itself once again with this awe-inspiring home that is nothing short of a show-stopper. As you step into the glorious two-story foyer, you'll be captivated by the elegant curved custom staircase, setting the tone for the grandeur that lies ahead. The open-concept floor plan exudes timeless sophistication, with the Living Room boasting double-height ceilings, an impressive soaring fireplace, and exquisite custom built-ins that add both functionality and charm. The gourmet kitchen is a chef's dream, adorned with bespoke features that elevate the culinary experience to new heights. The Family Room is a haven of natural light, courtesy of its floor-to-ceiling win
Simply spectacular! This major estate has rolling greens that spill out to a private lake! Interior is the ultimate retreat. Amazing 20,000+ square foot home on 10 sprawling acres in lovely Barrington Hills. Home features 10+ bedrooms, 6 fireplaces, a 1,300 bottle wine cellar, professional sauna, a stunning two-story indoor pool and hot tub, and much more. This majestic property has absolutely everything you could dream of and more. Extremely secluded with lush landscaping and a unique blend of modern and historic architecture. The grounds are magnificent, bordering Hawley Lake, one of the largest private lakes in Illinois. Less than 1 hour from the city and less than 30 minutes from O'Hare
This breathtaking estate boasts over 15,000 square feet of unparalleled quality construction and exquisite finishings. The craftsmanship is evident throughout, and the state-of-the-art design is truly remarkable. Set on a sprawling 37-acre lot with horse trails, this home is the epitome of luxury living. With 21 thoughtfully designed rooms spread over 4 levels all serviced by an elevator. They include 7 spacious bedrooms, 12 luxurious bathrooms, and 6 cozy fireplaces. This home offers the ultimate in spaciousness and comfort. Each room features high-end materials and finishes, showcasing the attention to detail that went into its design. The audio and security systems are top-of-the-line, w
* * * LOCATION, LOCATION!!! PRIME LOT 5 ACRES IN THE HEART OF BARRINGTON HILLS, LOCATED ON PRIVATE CIRCLE VARIETY OF MATURE TREES. ADJACENT TO RIDING CENTER TRAILS AND POLO FIELDS. BUILD YOUR DREAM HOME * * *
Chicagolands most sought after location. Over 60 acres of prestigious untouched Barrington Hills land. This picturesque land offers a pond, hardwood trees, and ideal spots for your luxurious dream home or compound. Make sure you watch the aerial video of this property. Highly sought after Barrington Hills School District #220, hard to come by privacy, and blissful nature are just a few of the advantages of this land. Topography survey is available at your request. NO restrictive easements. Bring your builder!
Beautiful lot backing to wooded tree line and 5acre private parcel. Located in desirable Hidden Lakes. Maintenance-free, gated community featuring waterfalls, guard house, a 2 mile private nature trail, tennis court & park. The lot faces south-southeast, adjacent to a tranquil conservancy for your dream home. HOA maintains private roads, lawn and snow care on individual homes, gate, waterfalls, common area maintenance.
Gorgeous and huge 1.72 Acre home site featuring matured trees with southern exposure and wonderful water views with fountains in the prestigious city of Barrington hills. This home site is a perfect lot and wonderful opportunity to build your dream home with a walkout basement in the established Abbey Woods subdivision. Neighborhood home ranges from $1.7m+ (approx) This fabulous lot has direct connection to city water and sewer! Located on a quiet and picturesque cul-de-sac. Great southern exposure allows for a sun-filled home that you can build per your own design & specifications. Bring your own architect and builder to build your dream home or we can arrange to build asper your re
Looking for the perfect site to plan and design your new estate? This 7.5 acre sloping wooded lot is perfect for a home w/ a walk-out lower level. The winding lane is a beautiful approach to this private, serene & wooded oasis. The location is just minutes to school, metra & downtown, a most desirable location within Barrington Hills! There is plenty of land to spread out and enjoy your own piece of paradise! This site is fabulous & rare to find so close to village. The land extends on both sides of Oakdene West & the owners had envisioned a pond with fountain on the right side of the property. (Right side of Oakdene West). 2 pin numbers - Survey & soil tests
Great location on a quiet lane in the heart of Barrington Hills just off of Donlea Road. Super opportunity to build your dream home with convenient location & Cook County taxes too! Partially wooded property has a slight roll and building site with full west our southwest views out the back. Spring Creek Valley Forest Preserve and trails nearby. Plat of Survey provided in additional information. Gross lot area = 5.07 acres
$549,000
— beds— baths5.07 acres (lot)
20 Barrington Hills Rd, Barrington Hills, IL 60010
Come build your dream home on this beautiful wooded 7-acre lot available in Barrington. Surrounded by gorgeous homes and Spring Lake Forest Preserve with stunning trees and nature. Just a short distance to West Dundee, easy access to 90, and just a 7min drive to The Arboretum of South Barrington. Bring your vision to life!
GORGEOUS PRIVATE PROPERTY!!! Build your dream home on this VACANT 8.55 acre completely private, wooded and ready-to-build parcel in prestigious Barrington Hills. Long private drive, heavily wooded, natural pond; Barrington #220 schools, near train & Village. No power lines, wetlands or traffic issues. Horses welcome. Prior home removed; many site options! Immediately available. A rare find! $500 annual Assoc fee. Showings by apt. for pre-qualified buyers.
Come Imagine Your Future on 5 Acres of Serene Property Down a Private Gated Driveway. Located in the Sought After Village of Barrington Hills Within School District 220. This Parcel is Available Without Subdivision Covenants or Restrictions. Your Own Private Pond With Seasonal Streams Provide a Relaxing Setting to Enjoy Year Round. Parcel Is Completely Fenced, Existing Well, Septic, Electric and Gas to Site. All Utilities Offered AS-IS. Survey and Additional Information Available Upon Request. Showings By Appointment Only.
This 6.79 acre lot is located on Illinois Route 25 also known as Elgin Rd in Barrington Hills, Illinois. Its 325 foot frontage and 910.39 foot depth give it many possibilities. Located adjacent to the north of the new Longmeadow Parkway right of way. Longmeadow Parkway when completed will have great access over the Fox River and will continue west past Randall Road saving time and traffic through the town of Algonquin. The property to the north and east of this lot is now owned by The Bridge Church of Algonquin which has had a special use granted by the Village Of Barrington Hills to build a Church on their 46 acres. To the south of this property is 5.89 acres in Barrington Hills that has a
$569,000
— beds— baths7.08 acres (lot)
1811 IL Rte 25 (elgin) Rd, Barrington Hills, IL 60010
Beautiful property with mature trees located west of Rte. 59. Property being sold As-Is. Utilities to property, NO ACCESS TO TEAR DOWN HOUSE AND OTHER BUILDINGS -- DO NOT ENTER THEM, UNSAFE.
Based on information submitted to the MLS GRID as of Thu Apr 25 2024. All data is obtained from various sources and may not have been verified by broker or MLS GRID. Supplied Open House Information is subject to change without notice. All information should be independently reviewed and verified for accuracy. Properties may or may not be listed by the office/agent presenting the information.
School data is provided by GreatSchools, a nonprofit organization. Redfin recommends buyers and renters use GreatSchools information and ratings as a first step, and conduct their own investigation to determine their desired schools or school districts, including by contacting and visiting the schools themselves.Redfin does not endorse or guarantee this information. School service boundaries are intended to be used as a reference only; they may change and are not guaranteed to be accurate. To verify school enrollment eligibility, contact the school district directly.
Barrington Hills, Illinois, is known for its well-maintained road network, making car transportation smooth and efficient. The traffic levels in this region are generally moderate, allowing for a stress-free driving experience. While the town does not have its own public transportation system, it is conveniently located near several major highways and freeways. This strategic location provides residents with easy access to surrounding areas and cities.
What types of properties are available in Barrington Hills?
Barrington Hills, Illinois offers a variety of single-family home types, including ranch-style homes, contemporary homes, and custom-built homes with modern designs and architectural features. These homes can be found throughout the area, nestled in the peaceful and scenic surroundings of Barrington Hills. Most properties in Barrington Hills feature three to five bedrooms and were built in various years. To explore different property types for sale in Barrington Hills, Illinois, use the 'Home type' filter located above the active listings. Customize your search by selecting options like single-family homes, condos, townhomes, and more.
What is life like in Barrington Hills?
Barrington Hills, Illinois offers a serene and picturesque setting, with rolling hills and lush greenery that create a tranquil and peaceful atmosphere. The region experiences all four seasons, with warm summers and cold winters, providing a diverse climate for outdoor enthusiasts. The area boasts a range of job opportunities across various industries, including finance, healthcare, and technology, ensuring a dynamic and thriving economy. Residents can enjoy a plethora of recreational activities, such as hiking, horseback riding, and golfing, taking advantage of the region's natural beauty and well-maintained facilities. Additionally, the community hosts a variety of events and festivals throughout the year, providing ample opportunities for socialization and engagement.
What are the schools and amenities like in Barrington Hills?
Barrington Hills, Illinois offers a variety of public amenities to enhance the quality of life for its residents. The village boasts an array of dining options, with several restaurants catering to a range of tastes. For outdoor enthusiasts, there are numerous parks providing serene spaces for relaxation and recreation. Essential shopping needs are met by grocery stores located within the community. Additionally, more amenities such as schools, libraries, and fitness centers are available, making Barrington Hills a well-equipped residential area.
In the past month, 5 homes have been sold in Barrington Hills. Find your dream home in Barrington Hills using the tools above. Use filters to narrow your search by price, square feet, beds, and baths to find homes that fit your criteria. Our top-rated real estate agents in Barrington Hills are local experts and are ready to answer your questions about properties, neighborhoods, schools, and the newest listings for sale in Barrington Hills. Our Barrington Hills real estate stats and trends will give you more information about home buying and selling trends in Barrington Hills. If you're looking to sell your home in the Barrington Hills area, our listing agents can help you get the best price. Redfin is redefining real estate and the home buying process in Barrington Hills with industry-leading technology, full-service agents, and lower fees that provide a better value for Redfin buyers and sellers.


 REDFIN IS COMMITTED TO AND ABIDES BY THE FAIR HOUSING ACT AND EQUAL OPPORTUNITY ACT. READ REDFIN'S FAIR HOUSING POLICY AND THE NEW YORK STATE FAIR HOUSING NOTICE.
 United States
 Canada