Live the dream in Daly City's tranquil Garden Valley! This delightful 3-bedroom, 2-bathroom house offers a perfect blend of comfort and functionality. Entertain with ease in the kitchen that flows seamlessly into the dining room - ideal for hosting memorable gatherings. The home showcases beautiful parquet floors, picture window, and a fireplace in the living room. Unwind on the spacious upper deck overlooking the backyard, which is accessible from two bedrooms, creating an easy transition from indoor living to outdoor enjoyment. The lower level features a third bedroom and a screened-in porch leading directly to the backyard. The partially covered backyard is a perfect space for enjoying a
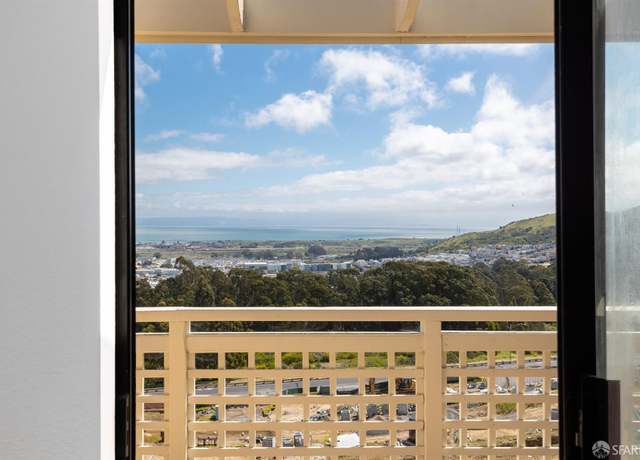
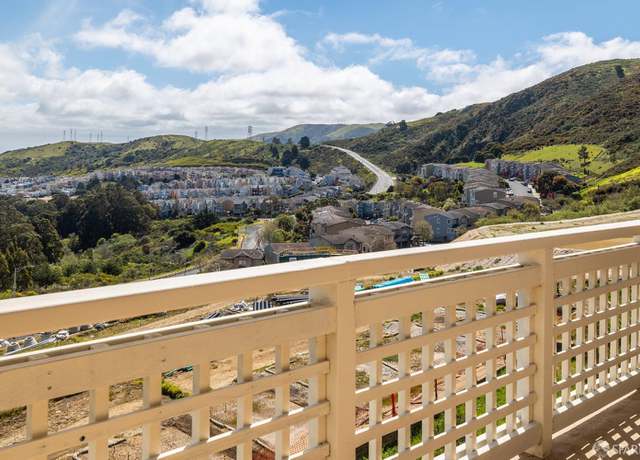
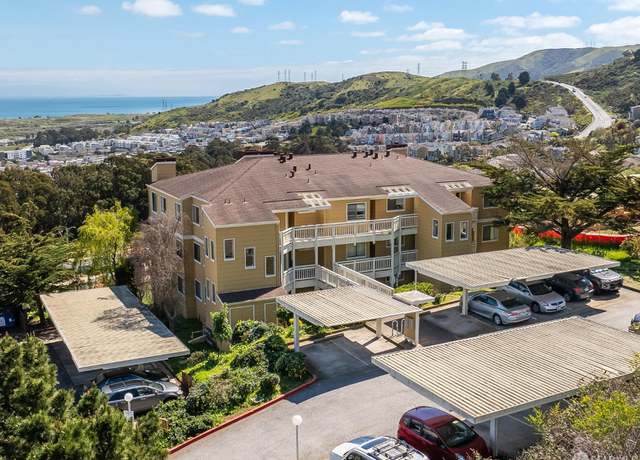
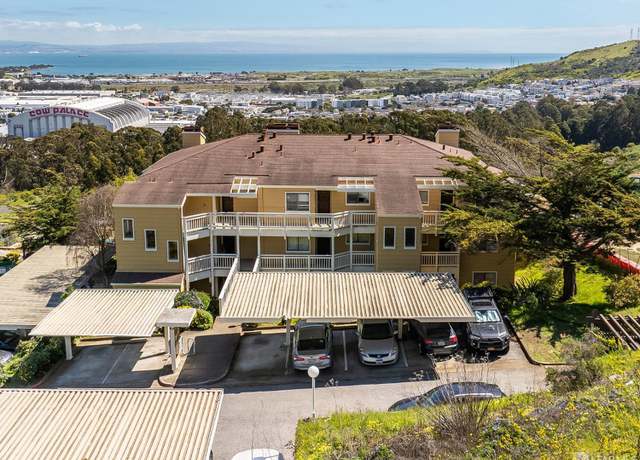
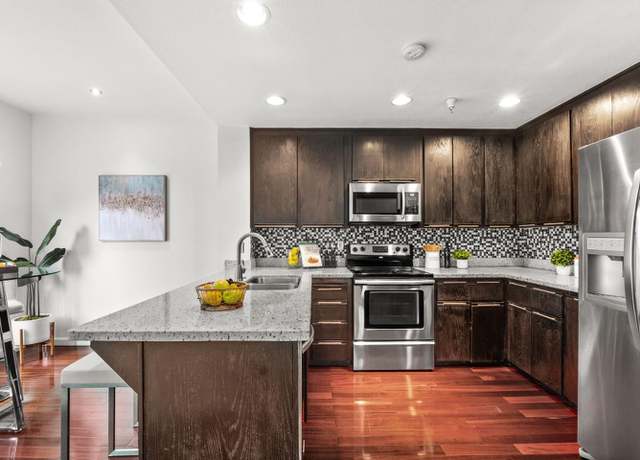
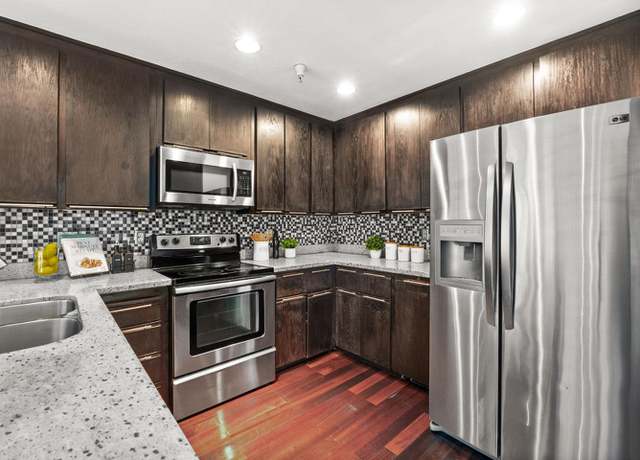
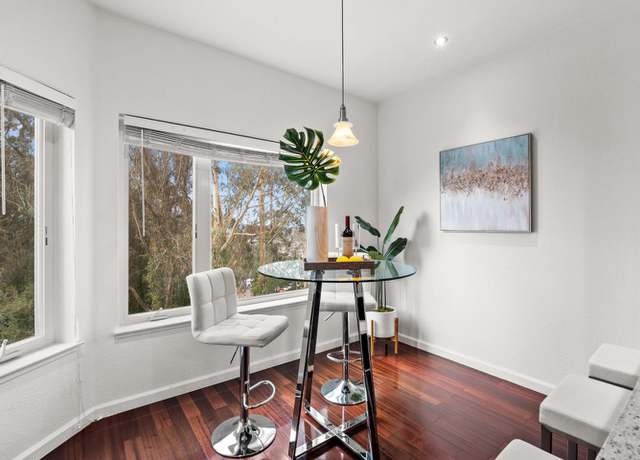
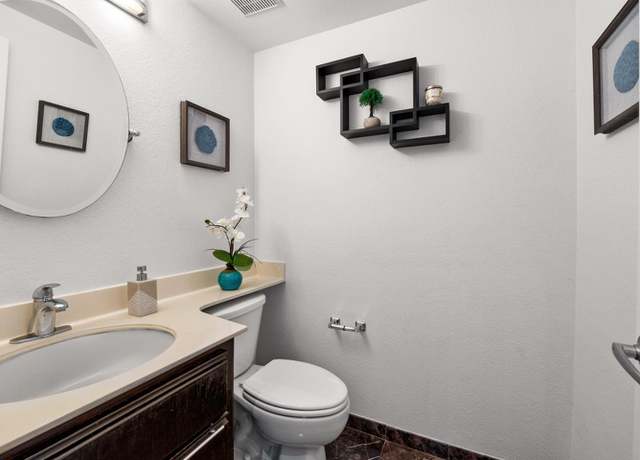
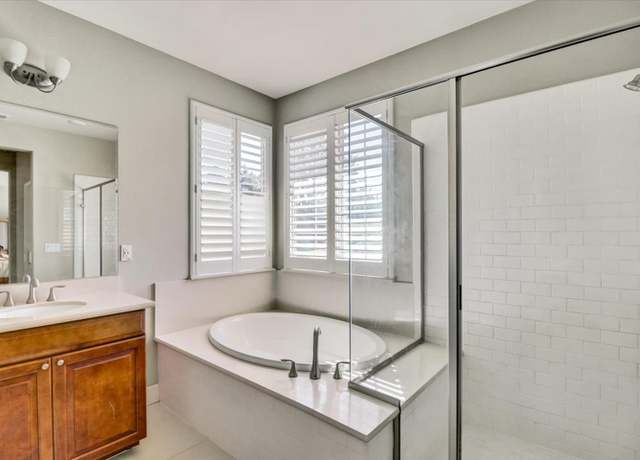
Welcome to Pointe Pacific condominiums in Original Daly City! This stunning two-bedroom, two-bathroom home features a spacious living room with a fireplace and a balcony showcasing breathtaking westward views. The dining room can fit a six-person table for dinner parties. The kitchen has been updated with additional cabinets, drawers, a built-in microwave, a wine cooler, a dishwasher, and space for another dining table. You'll find a free-standing washer and dryer in the hallway closet with room for additional storage. The primary bedroom comfortably accommodates a king-size bed and offers ample closet space. The ensuite bathroom features a large soaking tub and a dual vanity. There is a p
Welcome to this meticulously maintained home 5 bedroom and 2 bath residence nestled in the hills of Daly City. Upon entering, you'll be greeted by a spacious living area adorned with large windows that flood the space with natural light. The open floor plan seamlessly connects the living room to the dining area and kitchen, creating an inviting atmosphere perfect for entertaining guests or enjoying cozy nights in. Additional highlights of this home include a versatile layout that can be used as a home office, ADU, or playroom, as well as a two-car garage. Located in a desirable neighborhood close to parks, schools, shopping, dining, and transportation options, this home offers the perfect b
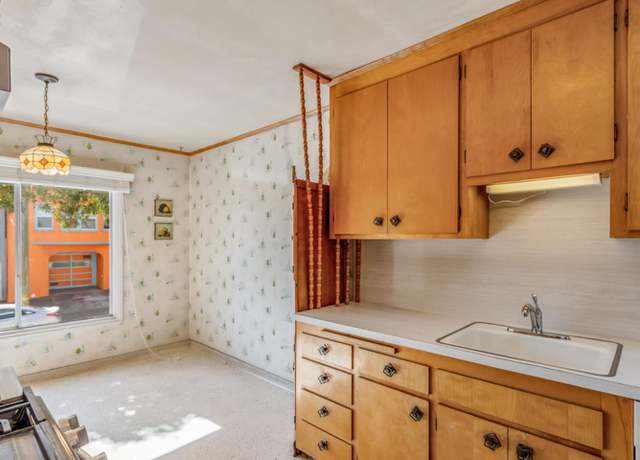
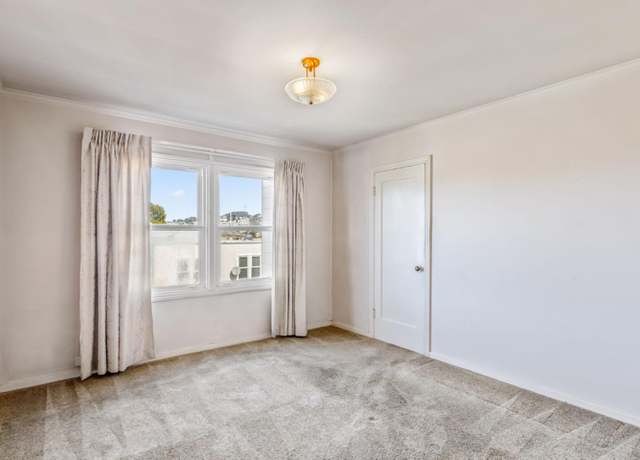
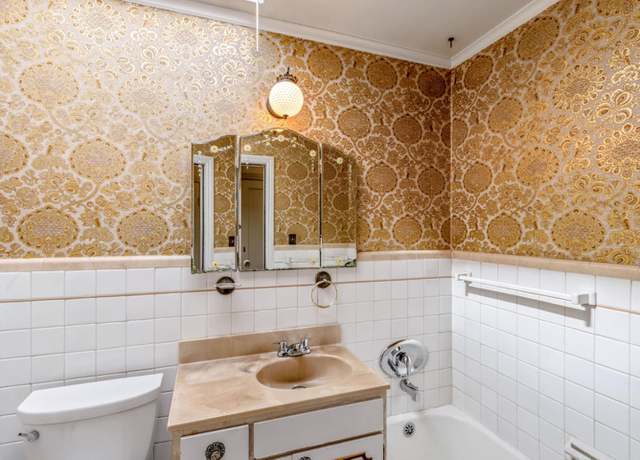
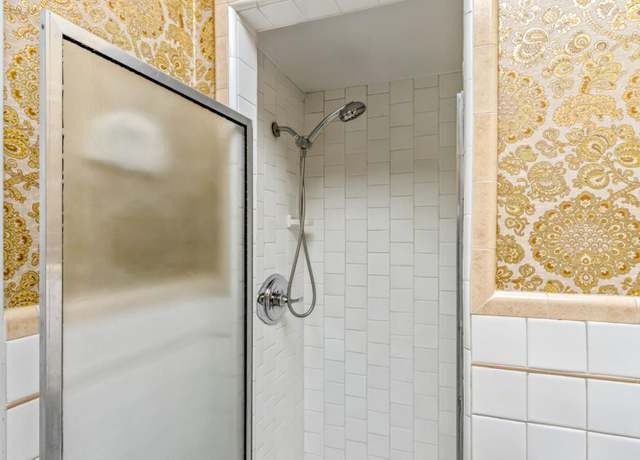
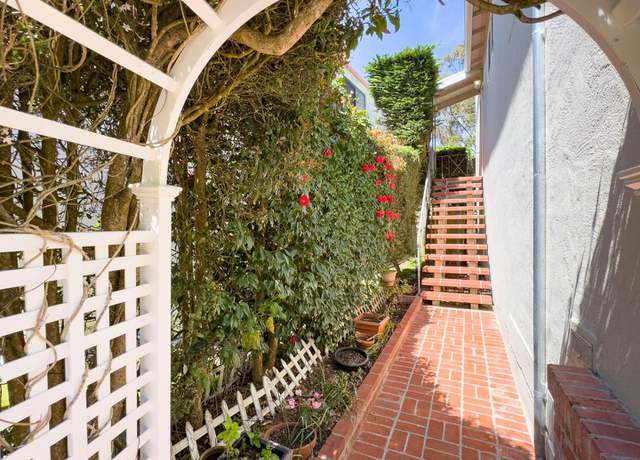
This property presents an opportunity for the buyer, or investor, to do their own design improvements. The current original owner family has loved this home for over 70 years. When you enter the front gate, you find a charming courtyard entry that leads to the front door. The warm and inviting floor plan includes a living room with an old-world style faux fireplace and a charming kitchen with modern appliances and a convenient dining area. The 3 bedrooms and bonus room in the garage offer maximum possibilities for home office space or shared living arrangements. The back yard garden also has endless options for new designs or to enjoy the current plants and trees. There is also a spacious,
Welcome to this 2380 sq. ft, 3bd /3ba multi-generational home located across March bank Baseball Park in Daly City. Perfect investment property or for a growing family. Location is perfect, it's has a lot of room for flexibility . .. long term or short term, the possibility is endless!!!! As you walk thru the main entry, you will notice the Tuscan color scheme is used throughout the home, it's nice and inviting. The main living area is on the 2nd floor and here you will find a cozy living room with a fireplace to warm your space during those cold winter evenings. The Kitchen has a nice functional layout that offers plenty of counter space, cabinets and adjacent to the dining area where y
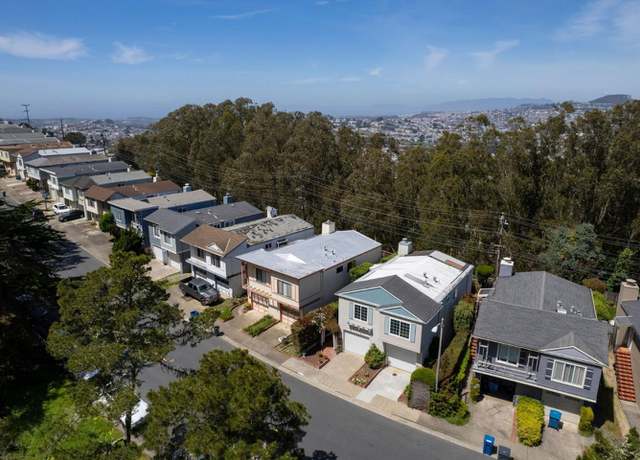
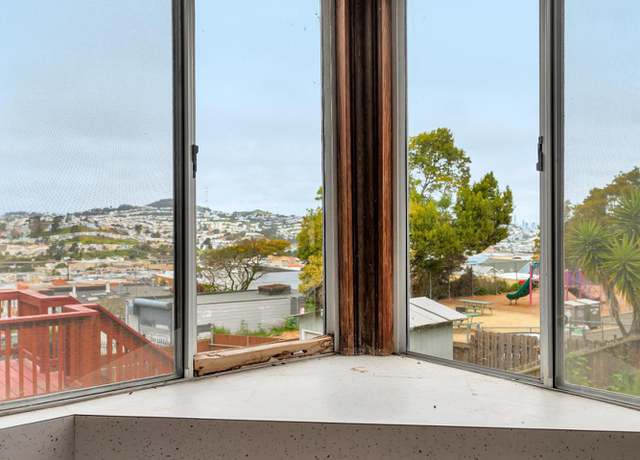
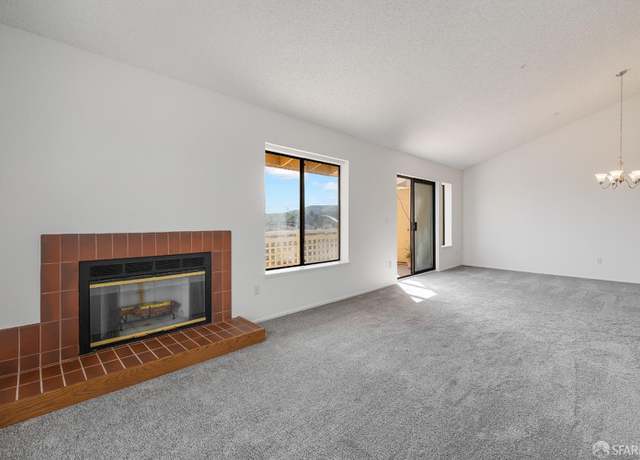
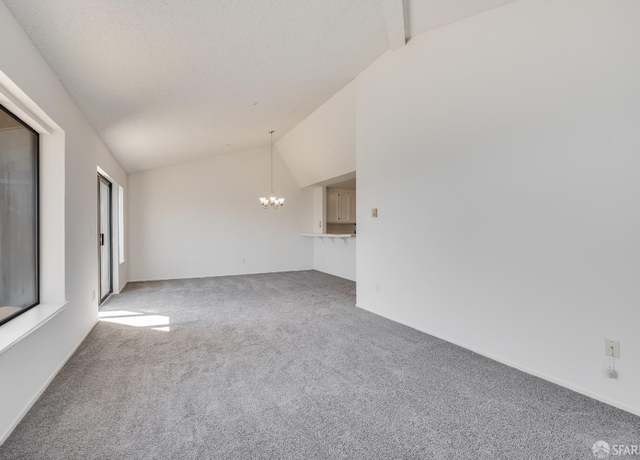
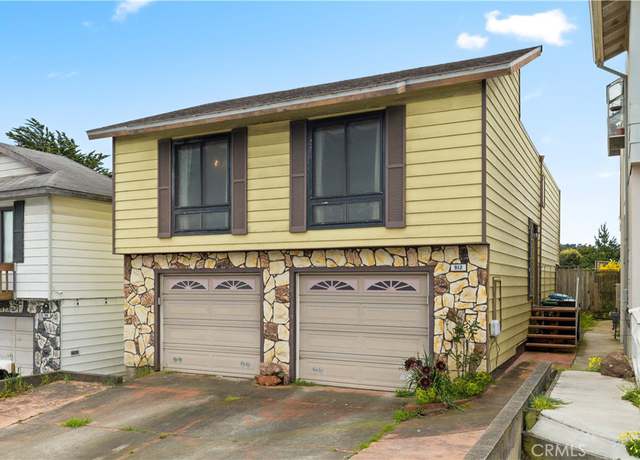
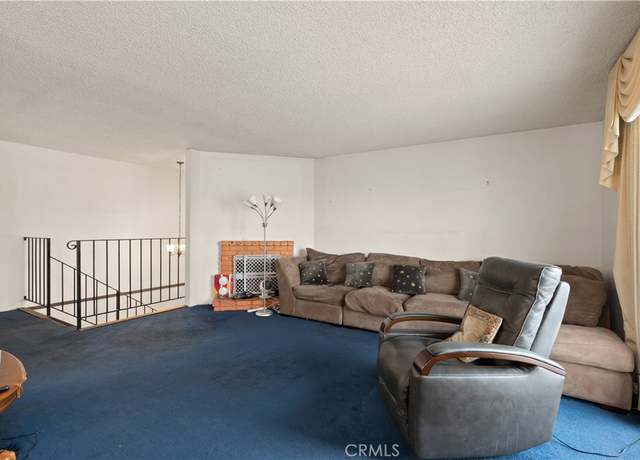
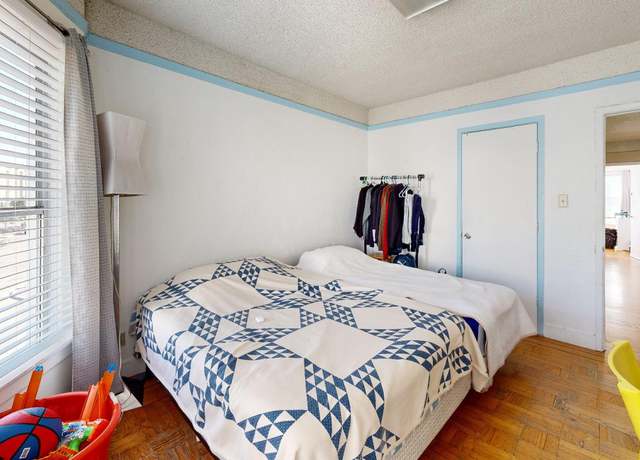
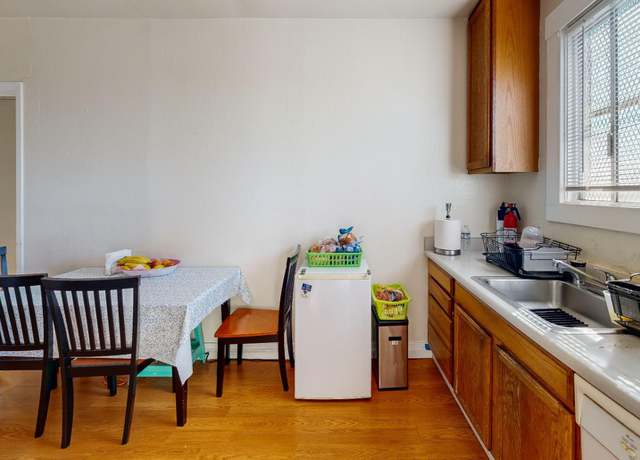
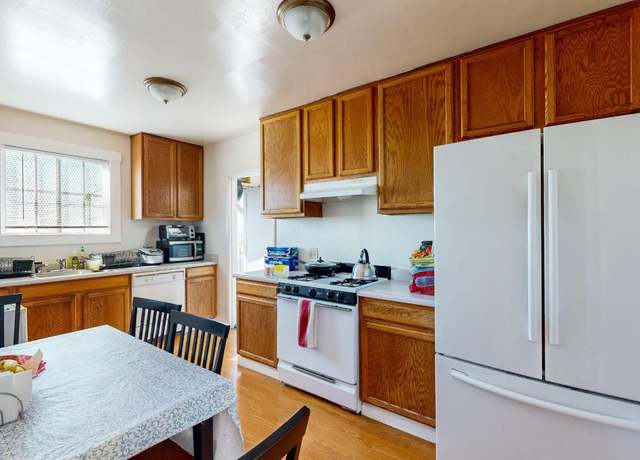
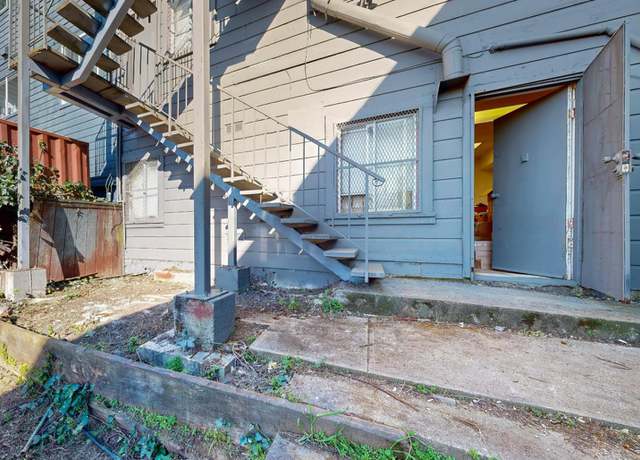
Built to last 65 years ago by the esteemed developer Henry Doelger. The robust old growth redwood frame is still stout today and another 65+ years look not to be a problem. The foundation is solid evident from upstairs level wood floors and functioning windows. The oak floors are remarkably well preserved by wall to wall carpet. The modest open midcentury layout has a timeless functionality, more roomy in the living spaces and cozy in the 3 bedrooms. Aside from the tandem garage there are two bonus rooms in the basement and a 3rd bathroom though nonconforming. There have been no recent cosmetic updates to the interior but the roof and hot water heater are just three years old and the furnac
Welcome to your new oasis in sought-after Westlake Terrace! This fully detached two-story home offers a large lot, comfort, versatility, and stunning ocean views. As you step inside, you'll notice new waterproof luxury vinyl flooring and fresh paint throughout, creating a modern and inviting atmosphere. The main level boasts three bedrooms, an updated bathroom, and a fully renovated kitchen with new appliances, countertops, and cabinets. The living room features a beautiful wood burning fireplace, adding warmth and charm to the space. Downstairs, two additional bedrooms await with plush new carpeting, along with an updated bathroom and a living room leading to the spacious backyard with a s
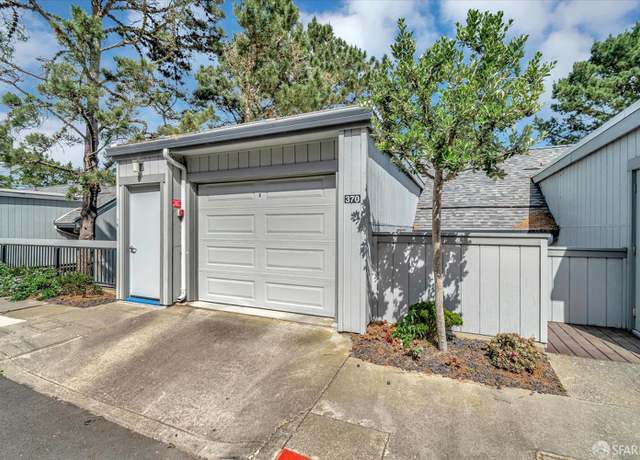
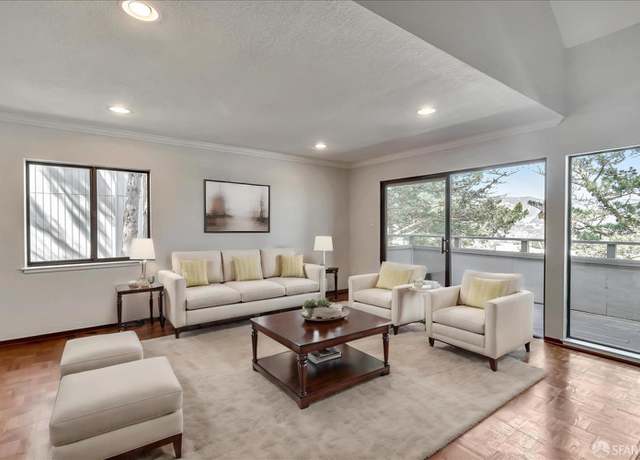
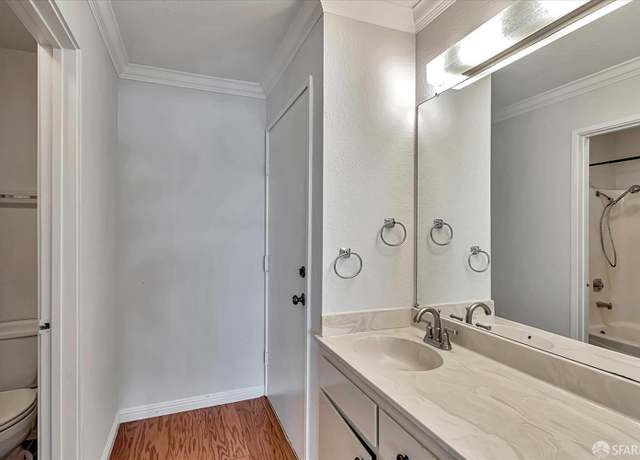
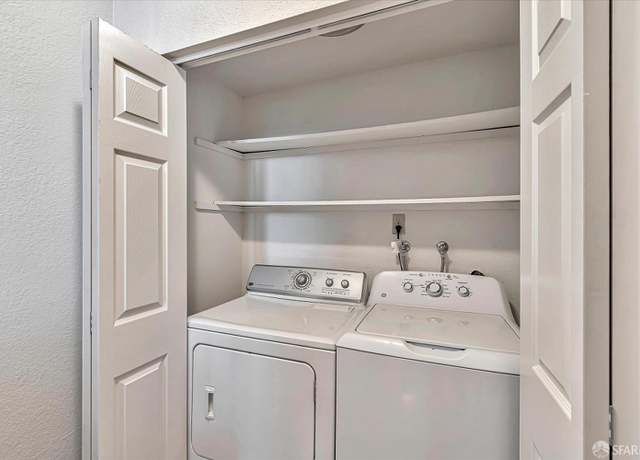
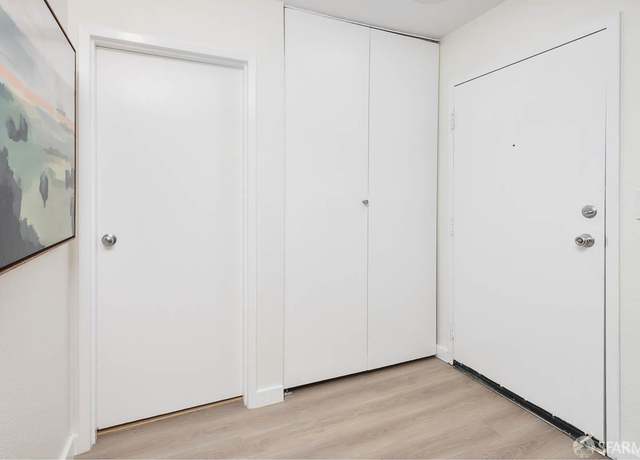
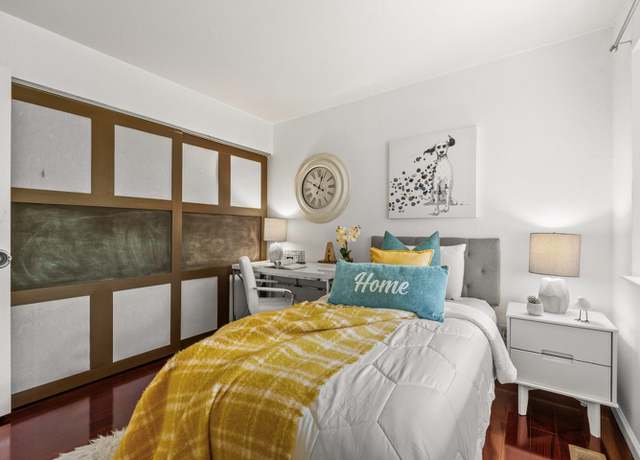
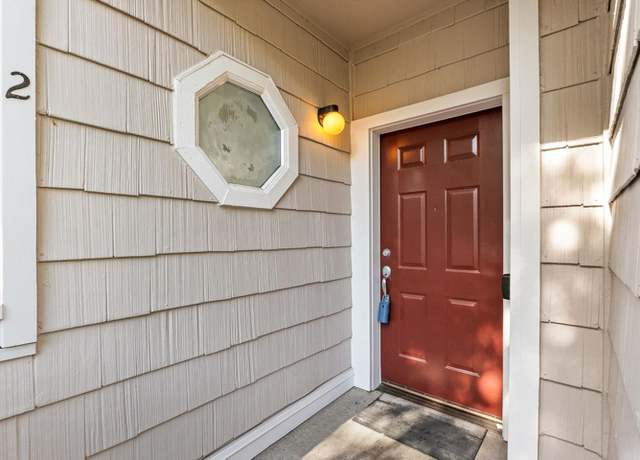
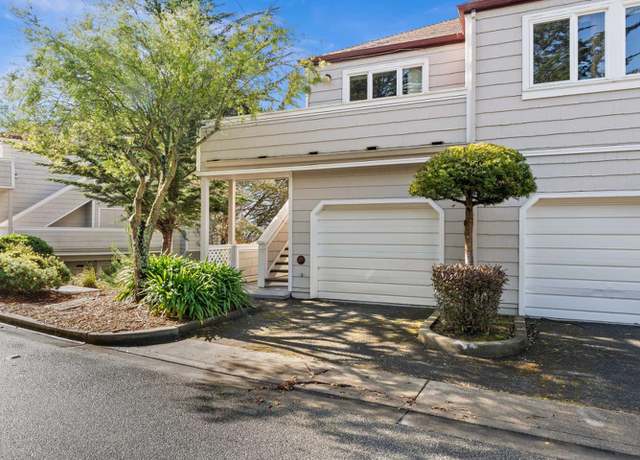
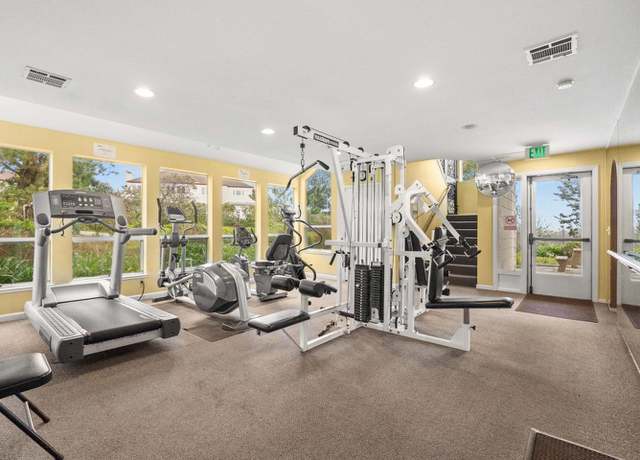
Semi-detached tri-level Cypress Point townhouse. The main level features a large living room opening up to a deck facing San Bruno Mountain. A fireplace gives the living room a nice refined feel. Both bedrooms are spacious and bright. This townhouse features in-unit laundry, an attached garage, and an extra uncovered parking space. The complex is gated and has a tennis court. If you are looking for a practical move-in ready home near shopping, transportation and easy freeway access, look no further than 370 Innisfree Drive!
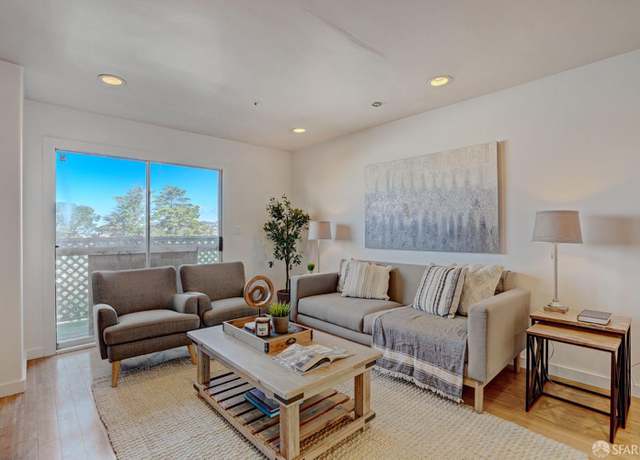
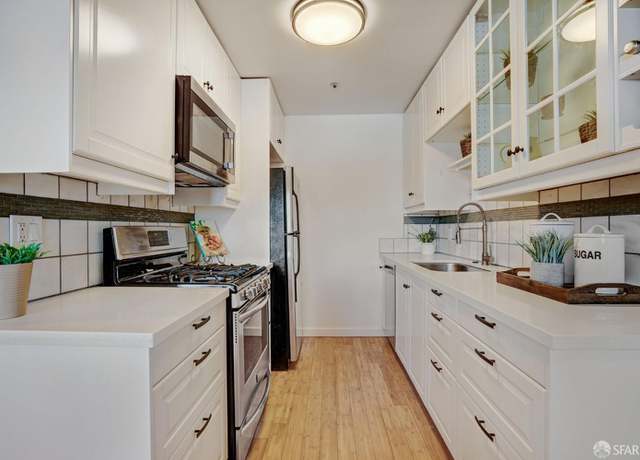
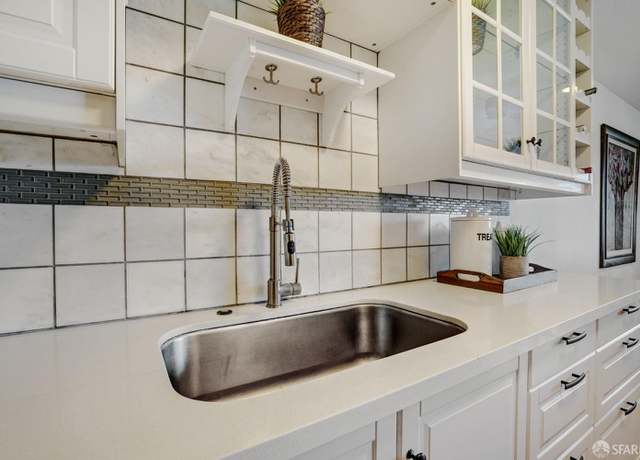
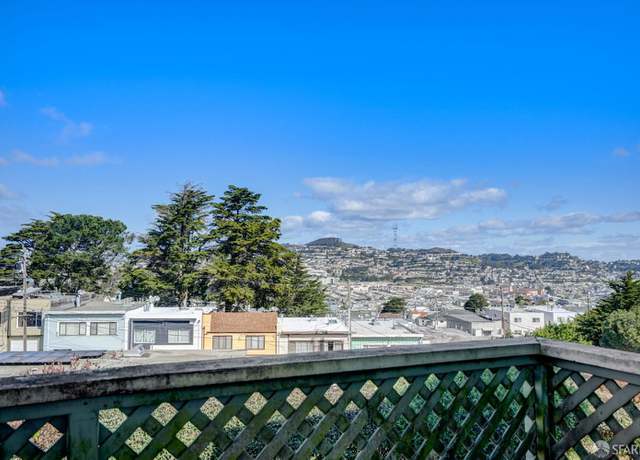
Discover this stunning condo situated in a convenient commuter location on the border of Daly City and San Francisco. It features 2 bedrooms, 2 bathrooms, and 2 assigned parking spaces. The property is perfect for first-time homeowners or investors, offering Mediterranean architectural curb appeal with modern finishes. Built in 2005, it has been lovingly maintained by its first owners. It features recessed lighting, newly installed windows, higher ceilings, freshly painted walls, bamboo flooring, and tons of natural light. The kitchen has granite countertops, maple cabinetry, stainless steel appliances, a gas stove, a gas fireplace with natural stone surround, and an in-unit laundry area. G
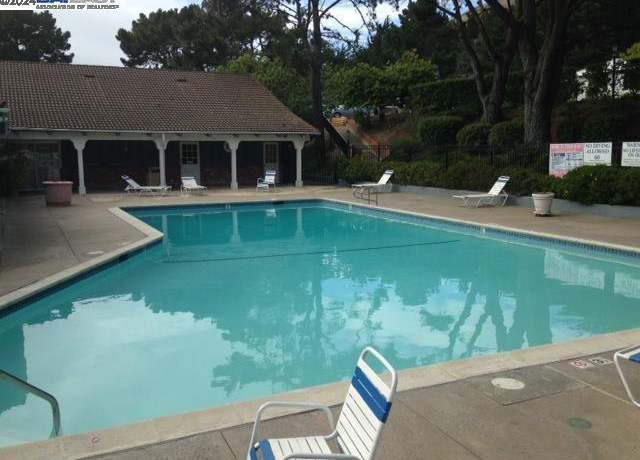
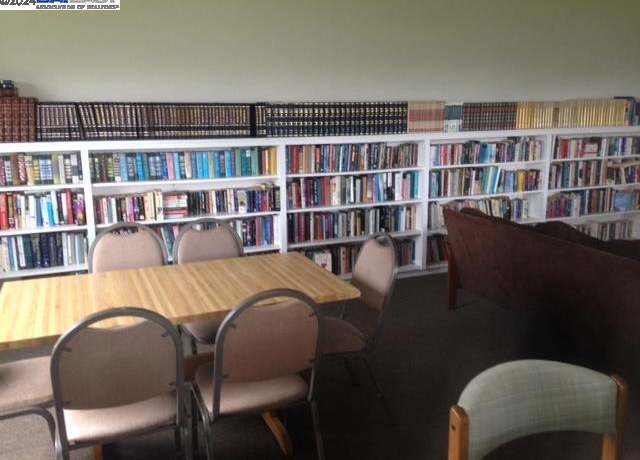
Welcome to the Crown Jewel of Crown Colony. This bright and refreshed 2BD, 2BA welcomes you into a gracious open floor plan with foyer, dining room, living room and kitchen all in one inviting great room. Anchoring the living space is a large private balcony surrounded by tall trees for privacy and greenery. Two Bedrooms on opposite sides of the living room, each with en suite baths is ideal for roommates, kids, guests, parents or a home office. Loads of updates: freshly painted interior, new light fixtures plus new LVT flooring in living areas and new carpet in bedrooms. One car garage plus storage. Crown Colony features an indoor/outdoor pool, sauna, fitness center, clubhouse, tennis and
Welcome to your coastal retreat at 93 Seacliff Ave in the highly desirable Westlake neighborhood of Daly City! This stunning residence offers breathtaking ocean views, providing a serene backdrop to everyday life. Located close to a playground, it's perfect for families seeking outdoor fun. Step inside to discover a bright and airy interior illuminated by natural light, complemented by luxurious appliances and Italian Stove in the kitchen. The bonus room on the first floor adds versatility, ideal for a playroom, home office, entertainment space or In-law unit. Outside, the low-maintenance yard beckons for relaxation, BBQ or alfresco dining. With a new roof and newly painted interior and ext
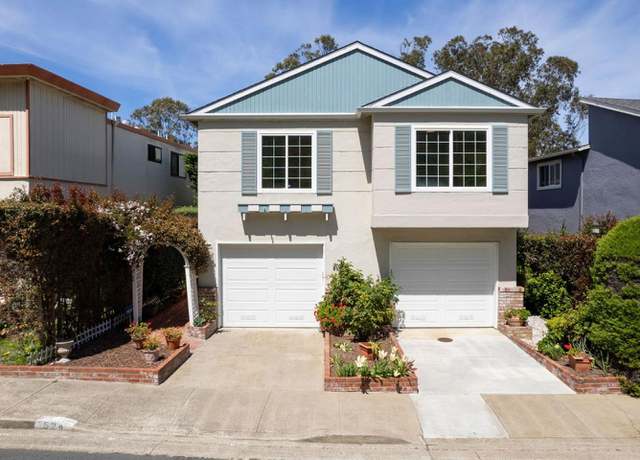
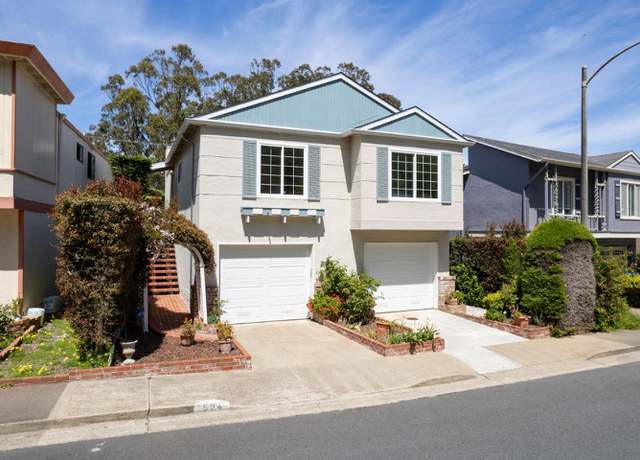
Do you need A LOT OF ROOM? Do you need a THREE CAR GARAGE? Look no further! This 2210 sq. ft. home features 4 bedrooms, 3 bathrooms plus 2 bonus rooms. One of the bonus rooms is very large, as it was set up with a miniature train village. (Just think of the possibilities!) The second bonus room situated off the living room, could be used as an office or art/yoga studio, plus it has a closet. The garage is single wide but long enough for 3 cars. The owners stored a boat and two cars in it! There is additional space for two cars in the driveway. This home features a gas log fireplace plus central heat and double pane windows. Nice upgraded laminate flooring. The backyard is full of many inter
Immaculate, two-story, fully detached, single family residence located in the Southern Hills District of Daly City. The upper level features a custom remodeled kitchen with cherry wood cabinets, granite counters, hardwood floors and stainless steel appliances. There are three bedrooms, one fully remodeled bathroom with ceramic tile wainscoting, a living room with gas starter fireplace and hardwood floors throughout. The lower level has a family room with wet bar, wall to wall carpeting, half bathroom, and a two-car tandem garage. Extras include double pane windows, new garage door, refinished hardwood floors, freshly painted interior, and a private, serene rear yard.
This charming corner-lot single family home, located in a desirable neighborhood, offers an exciting opportunity for those seeking a canvas to unleash their creative vision & restore this home to its former glory. The main level offers a functional layout w/ a spacious living room; leading into the dining area/kitchen & 2 beds & 1 full bath. Enjoy amazing city views w/ access to the backyard through the kitchen; an ideal situation for your indoor/outdoor entertaining. The spacious backyard provides ample room for gardening, outdoor activities, or creating your own tranquil retreat. The lower level features bonus space (currently w/ 3 rooms, 1 full bath & kitchenette/
Broadmoor is a peaceful, family-friendly neighborhood in Daly City, known for its clean, quiet streets. The community appreciates its easy freeway access and the sense of safety it provides, making it a beloved place to call home. It is priced to sell and we have motivated sellers who has kept the house squeaky clean. The house is a well kept 2 bedroom and 1 bath, plus a 3rd bedroom and bath(unwarranted) at the basement. The 3rd bedroom at the basement has its own entrance to give some privacy and additional income possibilities. Beautiful views with a wooden deck attached at back of the house ideal for get togethers and BBQ. .. Notice also the upgraded kitchen and some newer appliances a
Uplifting Daly City Condo with Spectacular Bay Views! Welcome to 207 Oak Court, nestled on the edge of Daly City. This immaculate top-floor condo, situated in the admired Saddleback community, offers a blend of modern comfort and scenic vistas. Boasting 3 bedrooms, 2 bathrooms, and assigned parking space, this residence spans a generous 1,254 square feet, providing ample space for relaxation and entertainment. Upon entry, you'll be greeted by a refreshed interior, featuring new carpeting and fresh paint throughout. The kitchen, adorned with new appliances, sets the stage for culinary excellence, while the adjacent living area offers a cozy fireplace and breathtaking views of the San Fran
Open houses, Sat & Sun, 4/20 & 4/21, 1 to 4pm. Please stop by! Elevate your lifestyle with this charming home nestled in Daly City, the Gateway to the Peninsula. Bright and airy, as you step inside this loving home, you'll be greeted by an open layout, freshly painted throughout, the living room is inviting with wood burning fireplace, gleaming hardwood floor, dining room next to open kitchen, excellent for entertaining or family gather, generous-sized bedroom with ample closet space, elegantly refinished bath with tile wall. Step outside to the landscaped backyard, an oasis of greenery offering a private escape for peaceful moments or hosting memorable outdoor celebrations with
Gorgeous and pristine move-in Early 20th Century Home. Lots of original features retained! Beautiful inlaid hardwood floors thru-out (liv/din rooms, halls & stair case). Original built-in Hutch in Dining Rm other special original features include Crown Molding, Baseboard, Window Frames, Door trims, High ceilings and more. Walking into the home from the Cozy Front Porch draws you into a formal entry and ultimately a super bright and sunny space! Tons of original charm yet updated to be a home with all the modern amenities - Updated Kitchen Granite, SS Appliances Included (Fridge, Dish Wshr, Gas Stove), Updated Bath with Double Sink/Vanity, Shower over tub, Laundry/utility room off kitc
Welcome to your serene oasis in the gated community of Crown Colony. This freshly painted studio condo, lives like a junior 1 bedroom, and offers a perfect blend of comfort, convenience, and style. Step inside to discover luxury vinyl plank flooring throughout, providing both durability and elegance. The living area is bathed in natural light, thanks to new double-paned windows and glass sliding doors that lead to a large private deck overlooking the tranquil interior courtyard or enjoy cozy evenings by the fireplace. The kitchen includes ample cabinets, and a bar overlooking the living space. The sleeping alcove features a large walk-in closet, providing ample storage space, while the upda
Nestled on a quiet street, this charming house exudes character and potential. Upon entering, you immediately feel the warmth of the well-proportioned rooms. Windows facing the street have sweeping views of the city, mountains and water. At the back you are greeted by an expansive backyard which has ample room for entertaining or your gardening endeavors. Though already very welcoming, this home presents a prime opportunity for upgrades to suit your personal style and preferences.
This description offers a captivating glimpse into a highly desirable property nestled within the Landmark community in Brisbane, one of Brisbane's most sought-after areas. Rare opportunity to reside in Brisbane's coveted Landmark community, with stunning mountain vistas. This refined 4 bed, 2.5 bath home features lavish upgrades, white carpet through the home, double-pane windows and amazing views. Lower level hosts four bedrooms, including a luxurious primary suite with spacious walk-in closets and an indulgent bathroom with shower and tub. Chef's kitchen on the upper level boasts a spacious island, premium appliances, and ample storage. Backyard oasis with trees and two-car garage. Enjoy
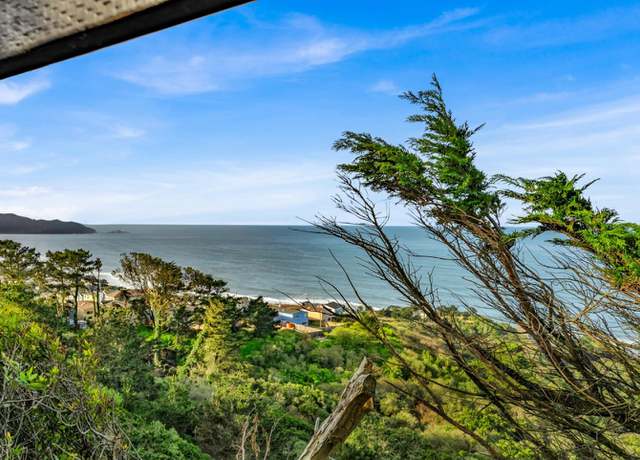
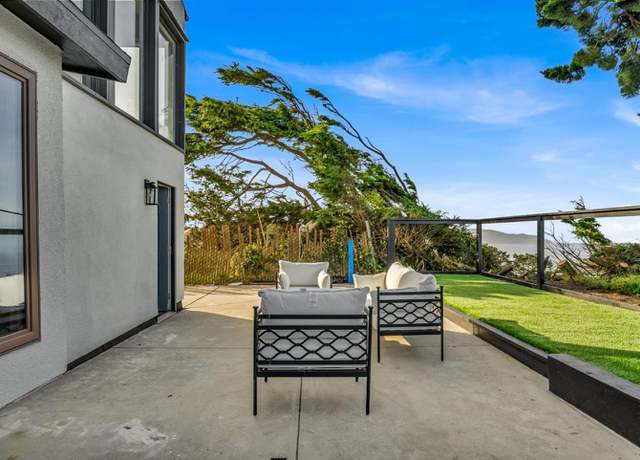
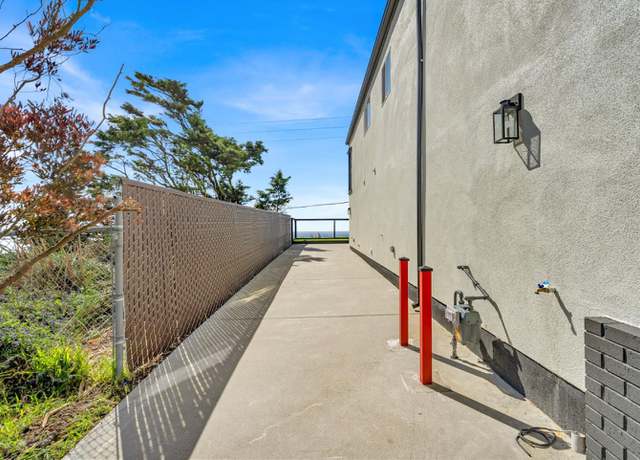
Welcome to your coastal sanctuary nestled atop the bluffs, offering unparalleled vistas of Mussel Rock Park and beyond. This oceanfront abode boasts a breathtaking panorama stretching from Half Moon Bay to the majestic Golden Gate Bridge. Discover tranquility in this three-bedroom haven, where each room offers seamless access to the backyard through sliding glass doors. Two of the bedrooms boast captivating ocean and garden views, inviting the serene beauty of nature indoors. Step into the backyard oasis and find inspiration in the dedicated Art Studio overlooking the Pacifica space designed to nurture creativity and appreciation for the coastal landscape. The cleverly partitioned tandem 2
Great starter home close to shopping and transportation. This home features 3 bedrooms and 2 full bathrooms, living room with fireplace, hardwood floors, update bathrooms, and a large back yard with storage shed.
Experience modern living at its finest in this 1-bedroom condo nestled in the heart of Mission Hills. Enjoy stunning views of Sutro Tower and the San Francisco skyline from the comfort of your dining and living space. The kitchen offers upgraded cabinets, stainless steel appliances, and quartzite countertops, while bamboo flooring adds a coastal touch throughout. With in-unit laundry, two deeded parking spaces, a storage unit, and various amenities, convenience is at your fingertips. Don't miss out on this great opportunity!
Price Reduced by $100,000! Introducing a stunning three-level home that is clean, bright and cheerful - ready for you to move in today! You'll love the breathtaking views of the city lights and ocean from the living room and bedrooms. With three bedrooms and a full bath on the upper level (one of which is currently repurposed as a family center room), this home is perfect for families of all sizes. The main level boasts a large, bright living room with city lights and ocean views, a bedroom, kitchen, and full bath. Step out onto the full private rear deck and enjoy the fresh air and sunshine. The beautiful wood floors and attached two-car garage are just a few of the many features you'll lo
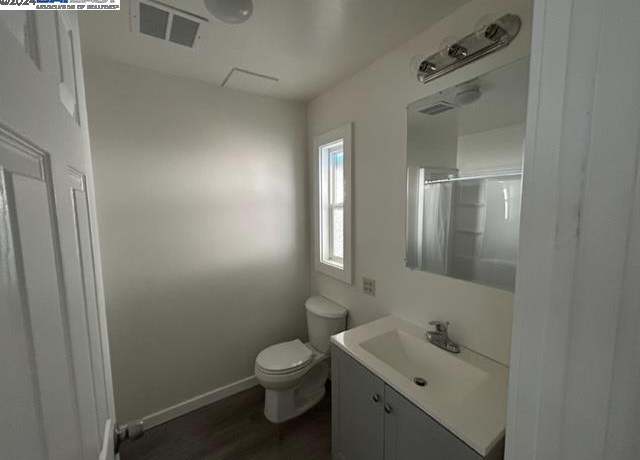
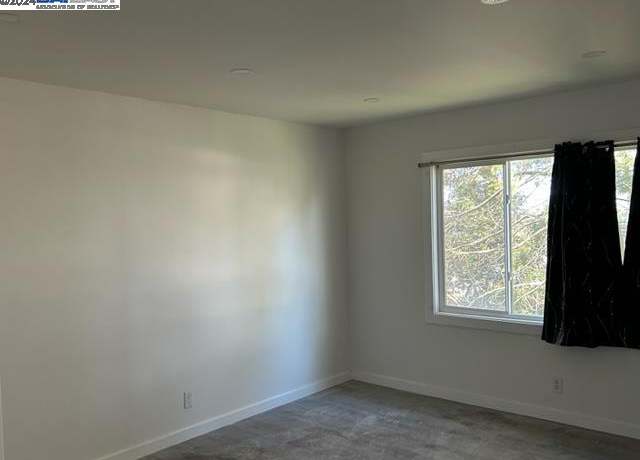
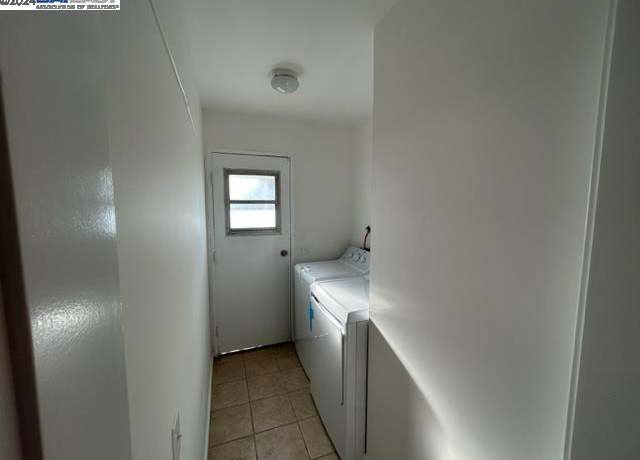
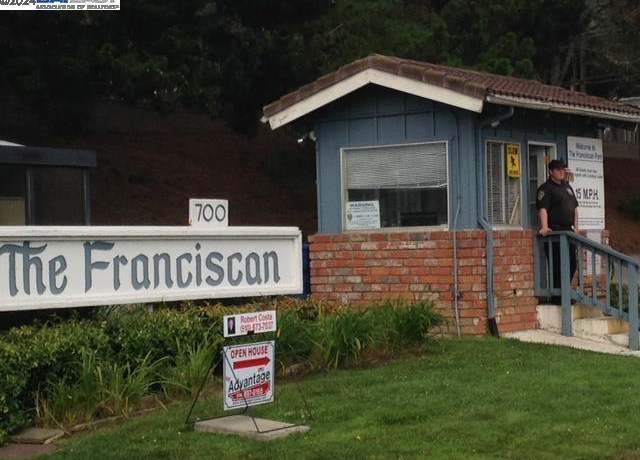
Mobile home in Daly City's The Franciscan has: 3 bedrooms at opposite ends of the home; 2 full baths; large open living/dining/family room areas; updated granite kitchen counter tops; vinyl flooring throughout; spacious deck; ideal side by side parking; dual pane windows; enclosed porch area; some upgrades in home; storage shed; ready for move in!
This a perfect home for large families or possible room rentals. This home has 4 bedrooms, 2 with a master bathroom plus a full main bathroom with tub and a large bonus room with a walk out to the back yard. This home has been in the same family for 50 years. It has incredible VIEWS of the Bay, San Mateo Bridge and San Francisco International Airport, this property offers an unparalleled and convenient living experience. This home is uniquely situated with a very private green belt behind the home ensuring privacy and a serene backyard to relax. This home is not just about the views; it's also designed for convenience and comfort. The dual-pane windows ensure energy efficiency and peace and
Perched along the hillside of Bayshore, this darling 2-bedroom home awaits you. While being a bit economical size, this home well makes up for in other features. Just imagine a coffee on your own front deck looking at the bay. There is full basement on the lower level for other improvement ideas. Being detached on one side, lots of natural light fills the interior. There is also a nice backyard with mature trees. Protected by the San Bruno Mountain, Bayshore has the sunshine. School, rec. center, library, and Muni bus line are all nearby. Bayshore school is elemamentry and middle school. Call and schedule your preview today.
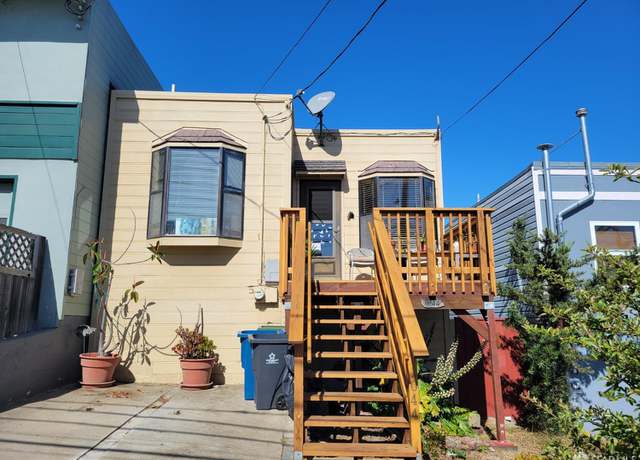
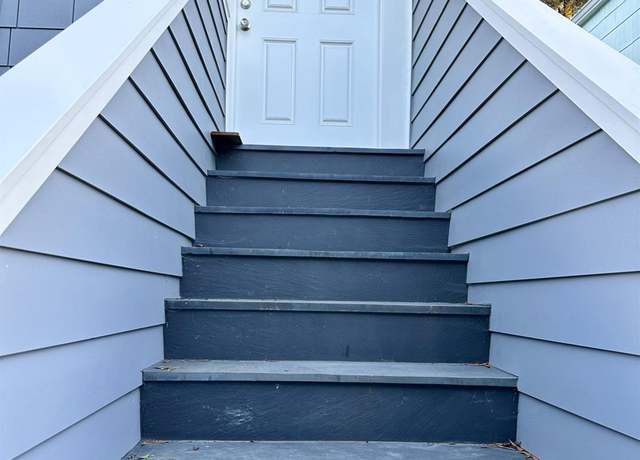
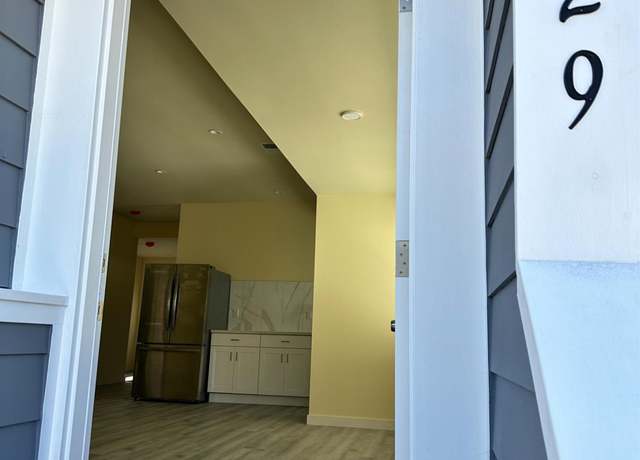
Price drops on a great home! This two levels gem have been completely remodeled both upstair and downstair. Both levels are vacant! Each level consists of 2 bedrooms and 2 bathrooms as well as a bonus area at rear which can be use as a den or bonus room. Rarely available chance to own a SFR in San Francisco with such a large (5,000 sqft) flat lot which is possible for additional potential ADU (buyer to verify) or ready for your extensive landscaping/gardening. The Lower level with a separate entrance has two newly added bedrooms and two bathrooms as prescribed by permits. Seller is selling it "As-Is" condition with no warranty. Easy access to I-280 and Downtown tech hubs, as well
Nestled in a prime location close to BART, dining, theaters, the freeway, and Marchbank Park, this mid-century home is a rare find. Upstairs, discover two cozy bedrooms and a bathroom, alongside a spacious living room boasting a charming fireplace. But the true highlight lies downstairs: a fully permitted second unit awaits, featuring two bedrooms, a full bathroom, and a combined kitchen and living area. With its separate entrance, this unit offers versatile options such as an in-law suite or rental income opportunity. Adding to the appeal, the kitchen upstairs showcases elegant granite countertops. Complete with a tandem 2-car garage, this property presents an unmissable chance to own a ve
The coastal breeze is a whisper you can almost taste. A panoramic canvas unfolds as the setting sun paints the sky with hues of coral and indigo. This idyllic scene is not a vacation fantasy its everyday life at 910 Skyline Dr. This property has been fully remodeled, ensuring that you can enjoy your new home without any concerns. Every aspect of the renovation has been meticulously completed, complying with the stringent guidelines of Daly City. The home features a new sewer lateral, sheer walls added for stability, and includes completely new plumbing and much of which is unseen, adds to the safety and value of your home. This home is equipped with LED lights, electrical sub-panels per flo
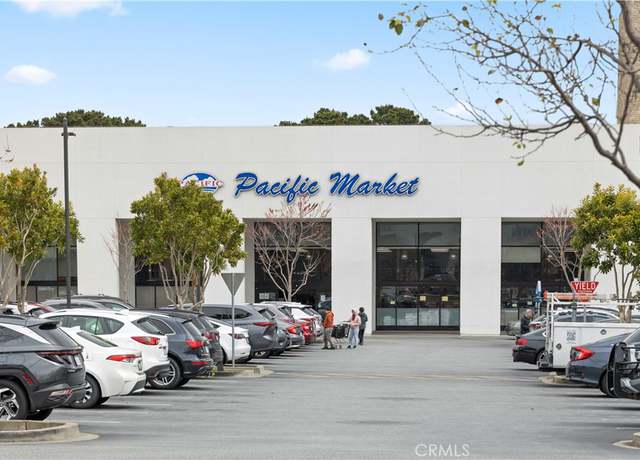
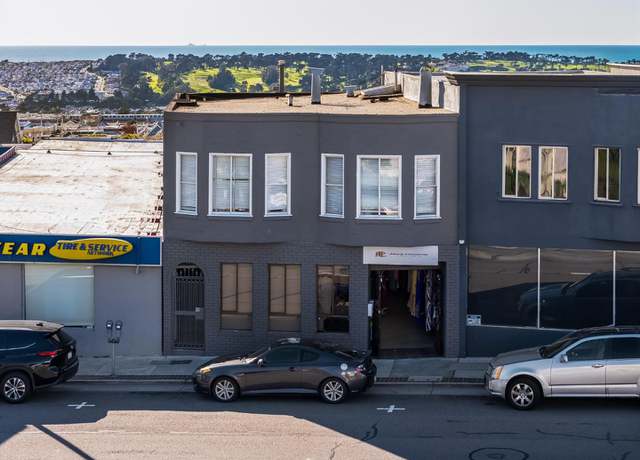
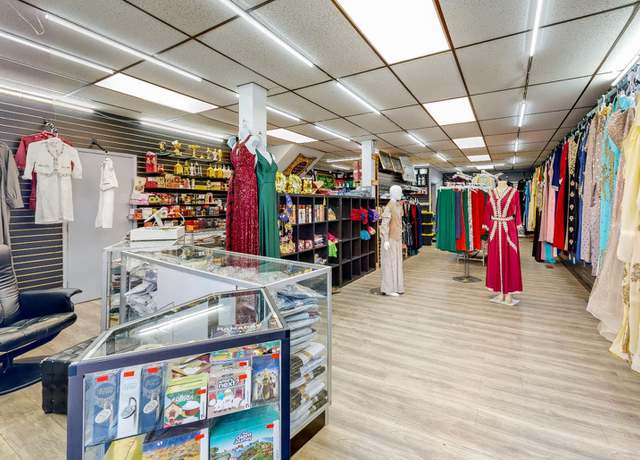
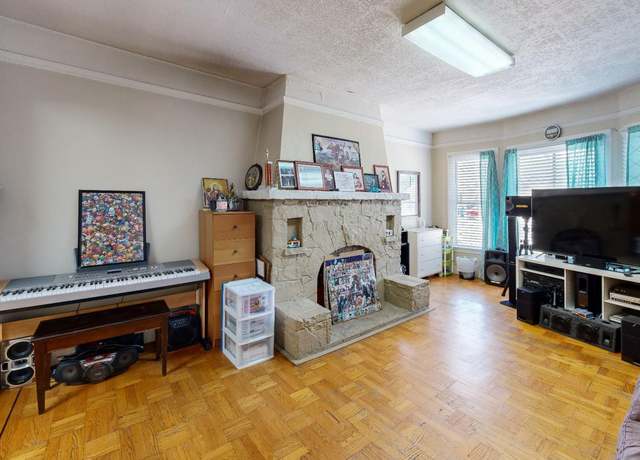
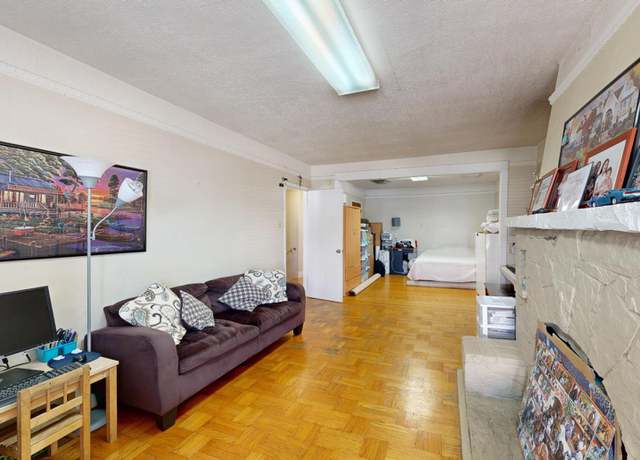
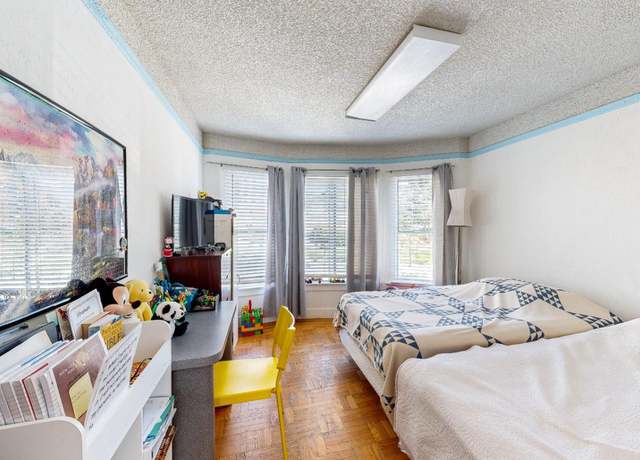
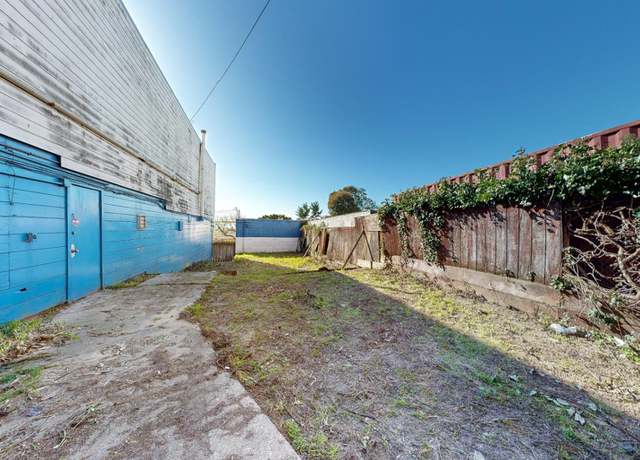
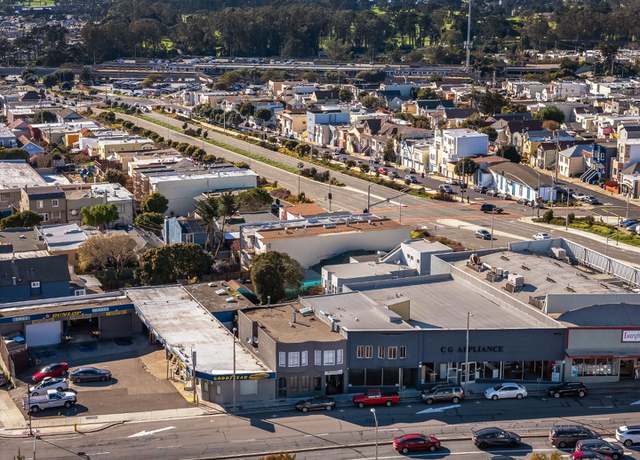
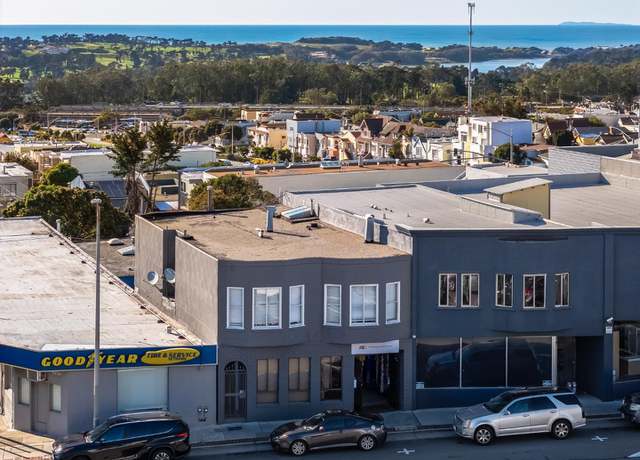
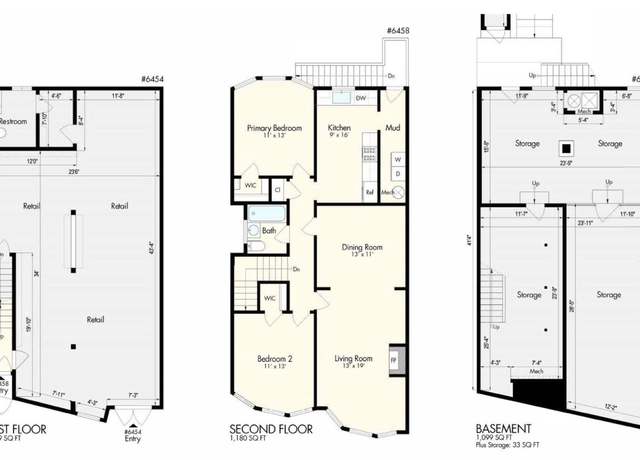
Mixed-use property located on the main commercial corridor in the heart of Daly City. Ground floor retail unit (1,089 SqFt on the ground level and 1,099 SqFt basement) and a large 1,180 SqFt 2-bedroom/1-bathroom flat on the 2nd floor. The property features a large, unused backyard which can serve as an excellent amenity for the residential or commercial unit. Well suited for an owner-occupant or an investor. The ground floor commercial unit consists of more than 50% of the property area, therefore, an owner-occupant may qualify for an Small Business Administration (SBA) financed loan to acquire the property with a down payment as low as 10% of the purchase price. The commercial ground floor
Welcome to this well-maintained fully detached corner house located in the original Daly City. Updated gorgeous kitchen with glass tiles , new cabinetry and stainless steel appliances, natural hardwood floors thru out , double paned windows and recessed lighting . Living room with unique fireplace . One car garage and laundry area , .Walking distance to shops and school. Close to public transportation.
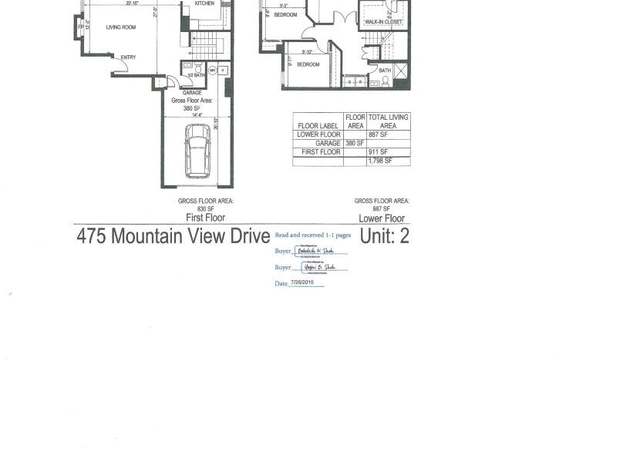
Introducing a stunning 3-bedroom, 2.5-bathroom condo in Daly City, boasting 1,798 sqft of luxurious living space. Step inside to find cherry hardwood flooring throughout, complemented by granite countertops and LED lighting for a modern touch. The living room features a cozy fireplace, perfect for chilly evenings. The kitchen is a chef's dream with a pre-plumbed bar and plenty of counter space. The condo is equipped with built-in closet organizers and is pre-wired for surround sound speakers, ideal for entertainment enthusiasts. Enjoy plenty of natural lighting and partial views from the comfort of your home. The community clubhouse offers a kitchen, gym, sauna, and outdoor picnic spaces fo
Welcome to 33 Rice St! This spacious 4-bedroom, 3-bathroom home boasts 1,988 square feet of well-designed living space, including the newly added 763 sq ft addition on a new foundation. On the main level you will be greeted by an open-concept layout, featuring a bright living room, stunning kitchen complete with a waterfall island and Thermador appliances as well as 2 bedrooms, 2 bathrooms and a deck that leads to the low maintenance backyard. On the lower level you will find a cozy family room complete with a wet bar and floating shelves, 2 additional bedrooms, a full bathroom and access to the 1-car garage with storage space. Highlights of this property include new electrical, new plumbin
Welcome to this exceptional property nestled in Brisbane's vibrant heart, where luxury and functionality converge to create an unparalleled living experience. Step into a meticulously designed layout that effortlessly balances comfort and style. On the ground floor, you'll find a luxurious suite featuring a full bathroom and a spacious walk-in closet, providing a serene retreat for relaxation. The two-car garage offers ample storage space, supplemented by additional storage areas cleverly tucked beneath the stairs. Ascending to the second floor reveals a haven of tranquility. Well-appointed bedrooms, including a master suite with a spa-like bathroom and balcony overlooking the landscaped ba
This exceptional investment opportunity is in the heart of Daly City. This charming duplex offers the perfect blend of comfortable living and potential rental income. Whether you're an investor or looking for a property with an additional rental unit, this duplex has a lot to offer. Each unit features 1 bedroom and 1 bathroom, providing ample space and privacy for tenants. The property boasts, well laid out floor plans with spacious living areas, well laid out kitchens and private yard for tenants. Conveniently located near highway 280, BART, shopping, the movie theater and many dining opportunities. The duplex offers easy access to everything Daly City has to offer. With its income-generat
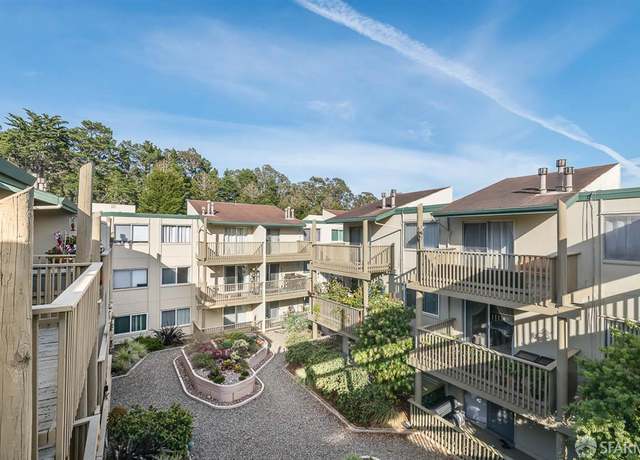
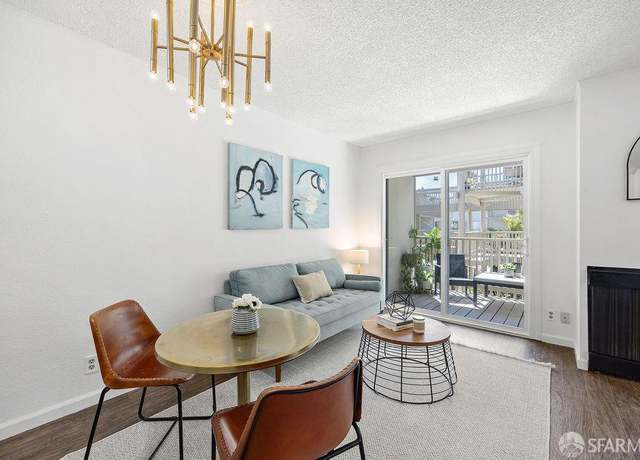
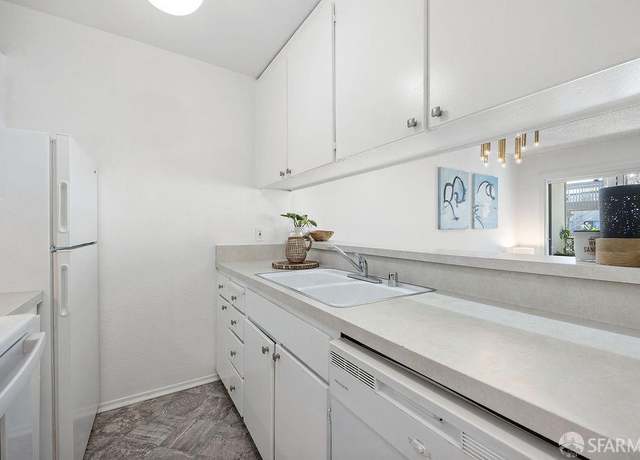
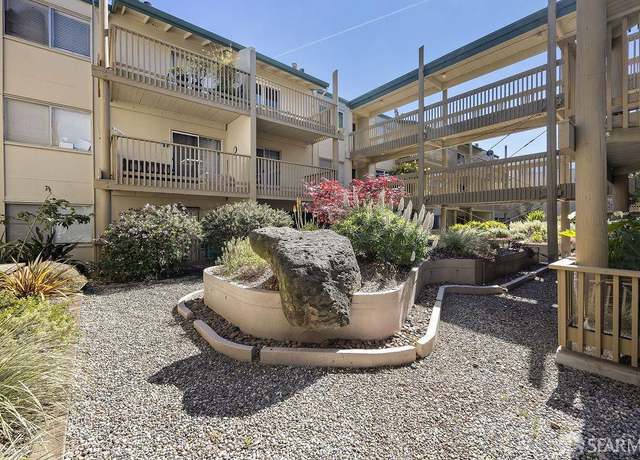
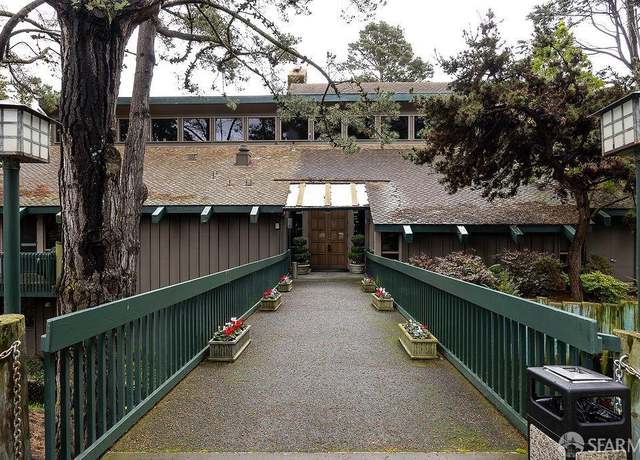
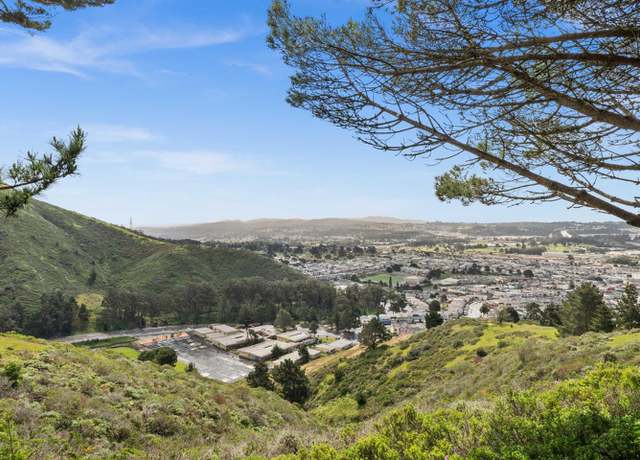
Views Views Views! You have found your oasis of serenity and beauty, nestled high above the activity of city life below, a sanctuary like home overlooking a variety of green landscape, a eucalyptus grove, mountain views, and enchanting wildlife. One of Daly Citys most sought after addresses, the gated community of Pointe Pacific is located in the western most part of San Bruno Mountain and designated as part of the Mission Blue Butterfly Habitat. The community all share the benefits of being part of this spectacular private mountain top location. Just a short drive to Daly City and Colma BART stations, this unit provides convenience in a natural setting. The condo has many thoughtful upgra
Welcome to this Gorgeous 5 Bedroom 4 Bath Home in sought-after Crestview Estates. Build in 2015 this home features hardwood floors, cozy fireplace, upgraded kitchen w/ island, granite countertops, 1 bedroom and 1 bath downstairs and 4 Bedrooms and 3 baths upstairs. 2 of the upstairs bedrooms have attached bath too. Home is perfectly located close to Serramonte Plaza, SamTrans/ Bart/ Colma Stations with easy commute to HWY 101,280 and 35. This home has a beautiful backyard with Flower Trees & Fruit trees like Peach, Cherry, Avacado, Fig, Orange & Pomegranate. It also has a walking trail that HOA maintains for home owners. Come and see to believe.
This area's enrollment policy is not based solely on geography. Please check the school district website for more information.
Elementary schools
Middle schools
High schools
GreatSchools Summary Rating
8/10
Marjorie H. Tobias Elementary School
Public, K-5
6/10
Los Cerritos Elementary School
Public, K-5
6/10
Junipero Serra Elementary School
Public, K-5
6/10
Buri Buri Elementary School
Public, K-5
6/10
Skyline Elementary School
Public, K-5
Only showing 5 of
25 elementary schools.
School data is provided by GreatSchools, a nonprofit organization. Redfin recommends buyers and renters use GreatSchools information and ratings as a first step, and conduct their own investigation to determine their desired schools or school districts, including by contacting and visiting the schools themselves.Redfin does not endorse or guarantee this information. School service boundaries are intended to be used as a reference only; they may change and are not guaranteed to be accurate. To verify school enrollment eligibility, contact the school district directly.
Homes for sale in Daly City have a median listing price of $1.1M. Some of these homes are Hot Homes, meaning they're likely to sell quickly.
What are some of the most popular neighborhoods in Daly City?
Popular neighborhoods include Original Daly City, Crocker Amazon, Outer Mission, Southwest San Francisco, Downtown South San Francisco, Westborough, Crown Colony, Oceanview, Hillside, and Serramonte.
Daly City, California, offers a variety of transportation options, making it convenient for residents to commute. The city experiences moderate traffic levels, making driving by car a viable option for many. Public transportation is readily available, with BART (Bay Area Rapid Transit) and SamTrans providing bus and train services throughout the city. Additionally, Daly City is conveniently located near several major highways and freeways, including the I-280 and US-101, facilitating easy access to surrounding areas. Learn more on our Daly City city guide.
What types of properties are available in Daly City?
Daly City, California offers a variety of single-family home types, including ranch-style homes, split-level homes, and contemporary homes, among others, each with their own unique architectural features and designs; these homes can be found throughout the city, in neighborhoods such as Westlake, Serramonte, and St. Francis Heights, providing residents with a range of options to suit their preferences and needs; most properties in Daly City feature multiple bedrooms and were built in various years, ensuring a diverse selection for potential buyers; to explore different property types for sale in Daly City, California, use the 'Home type' filter located above the active listings, customizing your search by selecting options like single-family homes, condos, townhomes, and more.
What is life like in Daly City?
Living in Daly City, California offers a unique experience with its diverse range of neighborhoods and housing options. The landscape is characterized by rolling hills and breathtaking ocean views, providing a serene backdrop for residents. The weather is mild throughout the year, with cool summers and mild winters. Job opportunities are abundant, with a thriving economy that includes a mix of industries such as technology, healthcare, and retail. There are numerous recreational activities to enjoy, including parks, hiking trails, and community events.
What are the schools and amenities like in Daly City?
Daly City, California, offers a variety of public amenities to cater to the diverse needs of its residents. The city is home to numerous restaurants, serving a wide range of cuisines to satisfy all taste buds. For those who enjoy outdoor activities, there are several parks throughout the city. Grocery stores are also abundant in Daly City, providing convenient access to daily essentials. Additionally, the city offers other amenities such as libraries, fitness centers, and community centers, making it a vibrant place to live.
In the past month, 29 homes have been sold in Daly City. In addition to houses in Daly City, there were also 20 condos, 2 townhouses, and 6 multi-family units for sale in Daly City last month. Daly City is a moderately walkable city in San Mateo County with a Walk Score of 66. Daly City is home to approximately 97,135 people and 18,491 jobs. Find your dream home in Daly City using the tools above. Use filters to narrow your search by price, square feet, beds, and baths to find homes that fit your criteria. Our top-rated real estate agents in Daly City are local experts and are ready to answer your questions about properties, neighborhoods, schools, and the newest listings for sale in Daly City. Our Daly City real estate stats and trends will give you more information about home buying and selling trends in Daly City. If you're looking to sell your home in the Daly City area, our listing agents can help you get the best price. Redfin is redefining real estate and the home buying process in Daly City with industry-leading technology, full-service agents, and lower fees that provide a better value for Redfin buyers and sellers.


 REDFIN IS COMMITTED TO AND ABIDES BY THE FAIR HOUSING ACT AND EQUAL OPPORTUNITY ACT. READ REDFIN'S FAIR HOUSING POLICY AND THE NEW YORK STATE FAIR HOUSING NOTICE.
 United States
 Canada