Experience breathtaking wide water views from every room in this exceptional residence! Nestled within the prestigious Sand Harbor South community in Foster City, this rare gem offers a tasteful opportunity that simply cannot be missed. Stepping inside, expansive living room, kitchen, and dining area seamlessly integrated to create an inviting atmosphere. Enhanced by a plethora of windows framing panoramic water vistas, each space exudes a sense of tranquility and relaxation. The dining area offers a strategic vantage point to enjoy the picturesque ocean views, accented by swaying palm trees reminiscent of a tropical getaway. This unparalleled feature of waterfront living is a rarity on the
NEW CONSTRUCTION! Brand NEW home by Award Winning builder SummerHill Homes! Laguna Vista is a community of 70 new townhomes located in the Pilgrim Triton Master Plan in Foster City. This home features 4 bedrooms and 3.5 bathrooms, 2,081 sq ft, with a beautiful open concept floorplan. This plan 3 home includes over $78K in designer upgrades and smart home features. Upgraded hardwood flooring, quartz counter-tops, Shaker White cabinets with Dark Grey Kitchen Island, Nest doorbell, Bosch appliances including refrigerator, undercabinet beverage center, gas cooktop, dishwasher, microwave. The community offers a great commute location close to HWY 101 & 92, excellent schools, and close to d
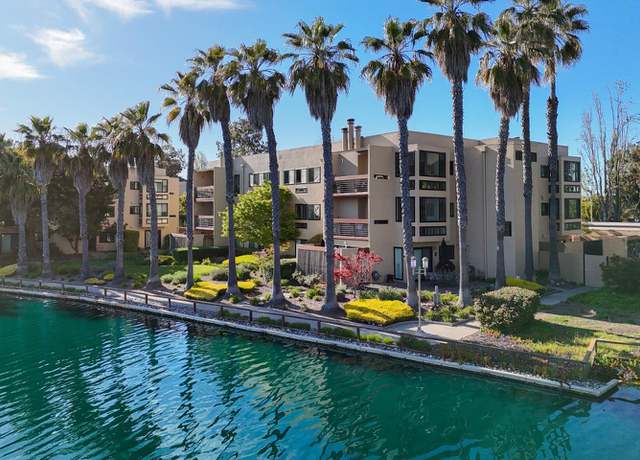
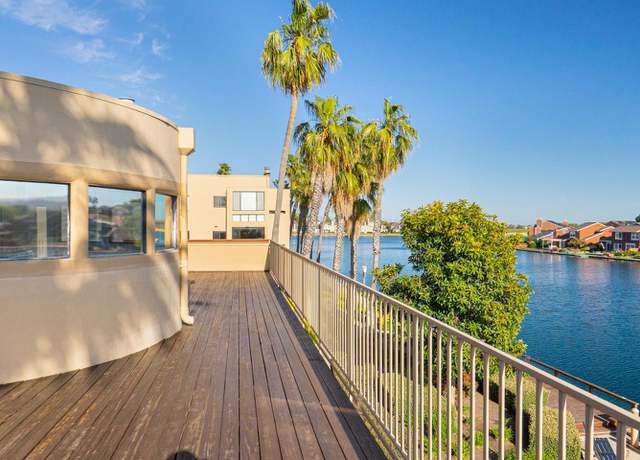
Absolutely amazing when experiencing the wide waterfront resort style living year-round in the center of San Francisco Bay Area. Launch from your private dock to relax in the lagoon, dine al fresco while celebrating 4th of July fireworks, or experience the finest shops and restaurants. This gorgeous home can satisfy your imagination of the dream house. Located on the quiet side of Foster City, away from highway noise or airplane noise. Sought-after floor plan with two large suites (one on each floor) and an office converted 3rd bedroom on the second floor. Vaulted high ceilings in the living room provide the potential to add another suite upstairs. Luxurious living space with upgraded wood
Welcome to this inviting corner unit home located in the desirable Edgewater community of Foster City. This north east facing residence features 2 bedrooms plus a den, 1.5 bathrooms, and boasts 1320 square feet of living space along with a 2-car attached garage. Enjoy the spacious patio for outdoor relaxation. Inside, upgrades abound including fresh paint throughout, a beautifully upgraded kitchen with new appliances, central A/C and heating, and stylishly upgraded bathrooms. Located conveniently near grocery stores, restaurants, and shopping, this home is also within the sought-after Great Foster City Schools district. The Edgewater community offers amenities such as a pool and basketball
Highly sought-after luxurious living at Meridian Bay Community. Conveniently located on the mid-peninsula in a safe, quiet, desirable neighborhood and city. Close to major highways and excellent schools. Outdoor activities, Shopping, and restaurants within walking/biking distance. Spacious, Top floor unit, High, Airy Ceiling filled with natural lights. 3 Bedrooms, and 2 Baths 1,606 sq with Balcony showing pool view. Updated gourmet Kitchen, All new appliances. New refrigerator, New Appliances, New Flooring, painting, New washer and dryer in-Unit. Secure Gated Community, 2 car assigned parking lots directed from the elevator. Ample guest parking spots, a Clubhouse with Kitchen, Gym, Spa/Saun
NEW CONSTRUCTION! Brand NEW home by Award Winning builder SummerHill Homes! Laguna Vista is a community of 70 new townhomes located in the Pilgrim Triton Master Plan in Foster City. Featured Home! This home features 4 bedrooms and 3.5 bathrooms, 2,081 sq ft, with a beautiful open concept floorplan. This plan 3 home includes over $80K in designer upgrades and smart home features. Upgraded hardwood flooring, quartz counter-tops, Shaker White cabinets, Nest doorbell, Bosch appliances including refrigerator, undercabinet beverage center, gas cooktop, dishwasher, microwave, and this home includes Hunter Douglas window coverings! The community offers a great commute location close to HWY 101 &am
First time on the market for sale in over 30 years! Great Harborside large 3 bedroom property with fresh paint and new carpets. No property directly behind this unit. Gate access to garden from back area. Eat-in Kitchen, formal dining area and large living room. 2 car garage plus seperate laundry area.
Immerse yourself in the captivating allure of this waterfront haven nestled within the prestigious Bayport community of Foster City. This residence offers 3 beds, 2 baths, and a versatile loft, ensuring a comfortable & inviting living experience. The warm & welcoming living room features lofty ceilings & a cozy gas fireplace, setting the stage for cozy gatherings. Boasting over 2,100 SQFT, the main floor provides accessibility with the primary suite & two additional bedrooms, ensuring comfort for all. Don't overlook the built-in bar in the dining room, a perfect spot for entertaining guests. The versatile loft space steals the show, offering endless possibilities as
Welcome to resort-style living in this luxurious community! This 2-bed, 2-bath home boasts in-unit laundry, large windows, and glass doors flooding the space with natural light. The master bedroom features a sitting area, nice walk-in closet. Enjoy double sinks in the master bath, ample storage in both bedrooms, and underground parking. Steps away, explore walking trails along the wide water. HOA amenities include a clubhouse, swimming pools, tennis courts, and RV/boat parking. Conveniently located within walking distance to multiple stunning waterfront parks, a community center, library, shops, and restaurants. Enjoy kayaking on the Foster City Lagoon or picnicking at Leo J Ryan Park. Acce
Experience waterfront living at its finest in this beautifully updated home. Enjoy the sought-after western sun exposure on the lanai, offering tranquil views. From the professionally landscaped front yard featuring drought-resistant plants and lawn, to the custom pavers in the driveway and recently painted exterior, every detail exudes curb appeal. Step inside to discover a spacious living room boasting vaulted ceilings and a cozy wood-burning fireplace, perfect for gathering with loved ones. Entertain effortlessly in the formal dining room that seamlessly flows into the kitchen/family great room, complete with custom cherrywood cabinetry, quartz countertops, and a stylish tile backsplash.
Conveniently located near Oracle, Visa and Gilead's Headquarters. This coveted 3bed/2.5 bath home is walking distance to the Waterfront, Parks and Beach Park Elementary School. A perfect home for the Jetsetter, growing family, or a Pied--Terre for the commuter. Bathed in natural light, the dine-in kitchen boasts with ample storage and beautiful granite. Enjoy al fresco dining, entertaining, & relaxing in the fenced front courtyard or secluded rear yard. The natural hardwood flooring throughout the home provides warmth while also offering low maintenance for those on the go. In the Winston Square Community, the lowest HOA in the area priced at $250/monthly fee covers common area mainten
$1,488,000
3 beds2.5 baths1,380 sq ft1,416 sq ft (lot)
991 Marquette Ln, Foster City, CA 94404
Nick Sadek Sotheby's International Realty, Nick Sadek Sotheby's International Realty
First time on the market for sale in almost 50 years. Tri-level convenience at your new home. Large living room, extended dining room & seperate family room. Did I mention an eat-in kitchen? Great for all of those looking for great features in your new home. Landscaped front and back yard all on an over-sized lot. Deck off dining with a retractable awning. Wow! Too much to mention. Get over here quick. This is the home you are looking for.
Bayporte community gem steps to Catamaran Park & lagoons for all the Foster City water sports. This single-family home, with one common wall, was recently remodeled and updated under the guidance of a leading interior designer, and has spacious wraparound gardens and patios on three sides including private rear gardens and flagstone patio. Freshly painted, new high-end 7.5 " Monarch Plank hardwood floors, recently remodeled bathroom with Carrara marble style tiles, towering ceilings, and amazing natural light. Spacious living and dining room combo, all-white kitchen and family room, plus main-level primary suite and adjacent bedroom and bath perfect for a nursery or office. Two u
Discover the dream of waterfront living in this private updated condo, perfectly situated on wide waters in the vibrant heart of Foster City. This exquisite corner unit is a sanctuary of luxury and serenity featuring unmatched expansive wide water views, and its very own private deck. The kitchen is a masterpiece of design, adorned with sleek countertops, stainless steel appliances, and beautifully updated cabinets. The dining and living areas are framed by sweeping panoramic views of the vast waterway, creating an idyllic backdrop for any occasion. Each of the two bedrooms is a haven of comfort, complete with spacious closets and elegantly updated bathrooms creating space to unwind. Key fe
Enjoy quiet serenity in this alluring entertainers dream! This inviting, leisurely 4 bed/2.5 bath home is located in the heart of beautiful Foster City in the quiet, well-maintained Bayporte Community. Ample Space with 2760 SqFt. With soaring ceilings, the open floor plan optimizes the abundant Natural Light. Remodeled from ceiling to floor with hardwood flooring, marble in the entry way, modern style bathrooms, fully finished two car garage with three cabinets, and a gourmet kitchen which includes gorgeous counter tops & cabinets, a breakfast bar, and high-end appliances. Designed with a focus on both comfortable daily life and timeless stunning looks. Large family/media room opens t
Step into this cozy home with a tasteful 2-bed, 2-bath condo which is near a multitude of stores and restaurants for enjoyment and convenience. Be welcomed in by the spacious bedrooms and plenty of natural daylight, especially in the kitchen which contains a large window overlooking the palm trees and the water. The condo structure contains an elevator for your comfort. Take in a spectacular view of the Central Lake and palm trees located nearby, from the living room windows. Relax by the pool and enjoy access to the clubhouse that opens up into the lake area. An abundance of storage space is provided on the same floor as the unit. Don't miss this opportunity to own this home within this be
If you've been looking for pristine waterfront living in one of the best locations on all of the peninsula. .. welcome to Promontory Point! This amazing condominium with 2224 sqft offers a kitchen fit for a master chef plus the entire home is soaked in light along with incredible views, which overlook the water from the kitchen, living room, and primary suite! Soaring ceilings, a spacious balcony, plus a separate office/den will allow you to be the architect of your amazing life! This is a secured building with an open air courtyard, elevators, 2 designated parking spaces in gated garage and more! Located on the amazing network of walking paths throughout Foster City and the Bayfront with
$1,585,000
2 beds2.5 baths2,224 sq ft
720 Promontory Point Ln #2305, Foster City, CA 94404
Brand NEW home by award-winning homebuilder SummerHill Homes! LAGUNA VISTA is a community of 70 new townhomes locted in th Pilgrim Tuiton Master Plan in Foster City. Spacious North facing home featuring 4 bedrooms and 3 1/2 bathrooms, 2194 Sq ft, with side-by-side 2-car attached garage! Includes large balcony and front porch, a gourmet kitchen with large kitchen island, and beautiful open concept floorplan. The high ceilings and large windows let in so much natural light! This Plan 3 home includes over $91k in designer upgrades and smart-home features! Upgraded hardwood flooring, quartz countertops, Nest thermostats/doorbell, and Bosch appliances, including gas cooktop, refrigerator, unde
This is it! Welcome to your dream home in Foster City! This 2020-built gem by SummerHill Homes is part of the Waverly Cove collection within the Pilgrim Triton Master Plan. This 3 bed/3.5 bath, open plan features three outdoor decks, GE Cafe stainless steel appliances, European Oak floors, and approximately $70K in upgrades. The home is light, bright and airy. Owner improvements include a new motorized garage door, custom drapery, bidets, walk-in closets all with custom built-ins, and an architect-designed garage storage system. Commuter-friendly, top-rated schools, Leo J Ryan park nearby, and a new walking path around the water is accessible from the house. Enjoy water activities such as k
Brand NEW home by award-winning homebuilder SummerHill Homes! LAGUNA VISTA is a community of 70 new townhomes located in the Pilgrim Triton Master Plan in Foster City. Spacious south facing home featuring 4 bedrooms and 3 1/2 bathrooms, 2081 sq ft, with side -by-side 2-car attached garage! Includes large balcony and front porch, a gourmet kitchen with large kitchen island, and beautiful open concept floorplan. the high ceilings and large windows let in so much natural light! This Plan 3 home includes over $89k in designer upgrades and smart-home features! Upgraded hardwood flooring, quartz countertops, Nest thermostats/doorbell, and Bosch appliances, including gas cooktop, refrigerator, und
Rarely available 1br/1ba loft style condo in sought-after Spinnaker Cove facing Foster City's iconic lagoon. With high ceilings and plenty of natural light, the spacious living room is the perfect place to escape the ordinary. Kitchen with granite counter tops and new stainless steel appliances. Spacious master bedroom could be used as a den. Pantry/laundry with washer/dryer and A/C/gas stove. One parking space in covered/secure garage. Due to the unique location in the building, neighbors are on one side only (no neighbors above, below or on the other side). Resort style living with clubhouse, pool, spa, tennis and basketball courts, and quiet trails along the lagoon. Walking distance to s
Stunning modern luxury 2-story corner home in like new 55+ community. One of the best units in the complex, facing center courtyard, with great open views from all rooms, and a private courtyard entrance. Extreme sunny & bright unit with large south and west facing windows. Secure building with exclusive elevator access to your front doors on both levels and rarely available attached 2-car garage. Largest multifunctional Avery-C model with contemporary open floor plan and high ceilings, 4BR, 3.5BA, 2413sqft. Gigantic suite downstairs with full bathroom perfect for adult children, extended family, or guests. Luxuriously remodeled with high end finishes throughout. Beautiful kitchen wit
School data is provided by GreatSchools, a nonprofit organization. Redfin recommends buyers and renters use GreatSchools information and ratings as a first step, and conduct their own investigation to determine their desired schools or school districts, including by contacting and visiting the schools themselves.Redfin does not endorse or guarantee this information. School service boundaries are intended to be used as a reference only; they may change and are not guaranteed to be accurate. To verify school enrollment eligibility, contact the school district directly.
Homes for sale in Foster City have a median listing price of $1.83M. Some of these homes are Hot Homes, meaning they're likely to sell quickly.
What are some of the most popular neighborhoods in Foster City?
Popular neighborhoods include Isle Cove, East San Mateo, San Mateo Village, Hillsdale, Westport, Redwood Shores, Los Prados, Shoreview, South San Mateo, and Mariners Isle.
Foster City, California boasts a well-developed transportation system, with several options for residents to navigate the city and beyond. While driving a car is a common choice, traffic levels can be high during peak commuting hours. Public transportation is available, with bus services providing connectivity within the city and to other parts of the San Mateo County. For those looking to travel further, Foster City is conveniently located near major highways, including the US 101 and Interstate 280, offering easy access to the broader Bay Area. Learn more on our Foster City city guide.
What types of properties are available in Foster City?
Foster City, California offers a variety of single-family home types, including ranch-style, contemporary, and modern designs, all built between the 1960s and present day; these homes typically feature 3-5 bedrooms. To explore different property types for sale in Foster City, California, use the 'Home type' filter located above the active listings. Customize your search by selecting options like single-family homes, condos, townhomes, and more.
What is life like in Foster City?
Foster City, California offers a vibrant and dynamic living experience. The city boasts a beautiful and picturesque landscape, with a combination of stunning waterways and scenic parks. The weather in Foster City is characterized by mild winters and comfortable summers, creating an ideal environment for outdoor activities. The city provides a range of job opportunities across various industries, making it an attractive destination for professionals. Residents can enjoy a plethora of recreational activities, including water sports, hiking, and biking, ensuring there is always something exciting to do.
What are the schools and amenities like in Foster City?
Foster City, California, provides a wealth of public amenities to enhance the quality of life for its residents. The city boasts a variety of restaurants, offering a wide range of cuisines to satisfy diverse gastronomic preferences. Numerous parks dot the cityscape, providing ample green spaces for relaxation and recreation. Grocery stores are conveniently located throughout the city, ensuring easy access to daily necessities. Additional amenities include fitness centers, libraries, and community centers, all contributing to a well-rounded lifestyle in Foster City.
In the past month, 12 homes have been sold in Foster City. In addition to houses in Foster City, there were also 16 condos, 4 townhouses, and 0 multi-family units for sale in Foster City last month. Foster City is a moderately walkable city in San Mateo County with a Walk Score of 50. Foster City is home to approximately 30,160 people and 19,535 jobs. Find your dream home in Foster City using the tools above. Use filters to narrow your search by price, square feet, beds, and baths to find homes that fit your criteria. Our top-rated real estate agents in Foster City are local experts and are ready to answer your questions about properties, neighborhoods, schools, and the newest listings for sale in Foster City. Our Foster City real estate stats and trends will give you more information about home buying and selling trends in Foster City. If you're looking to sell your home in the Foster City area, our listing agents can help you get the best price. Redfin is redefining real estate and the home buying process in Foster City with industry-leading technology, full-service agents, and lower fees that provide a better value for Redfin buyers and sellers.


 REDFIN IS COMMITTED TO AND ABIDES BY THE FAIR HOUSING ACT AND EQUAL OPPORTUNITY ACT. READ REDFIN'S FAIR HOUSING POLICY AND THE NEW YORK STATE FAIR HOUSING NOTICE.
 United States
 Canada