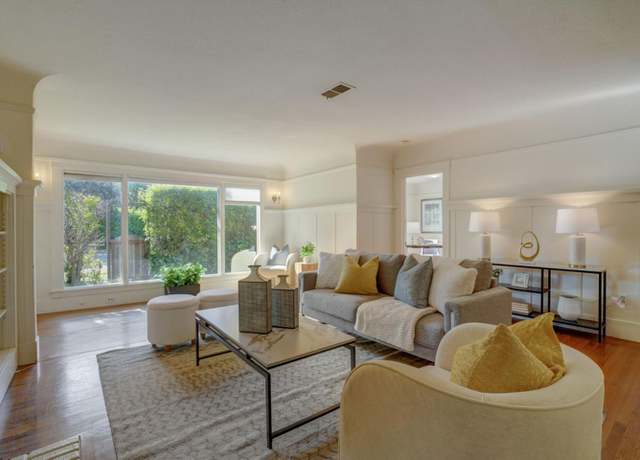
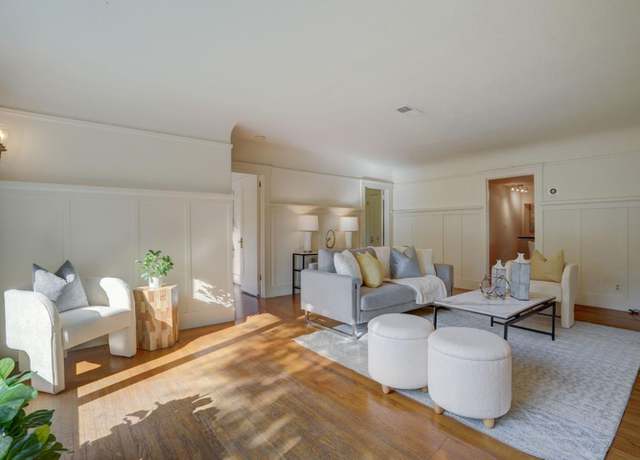
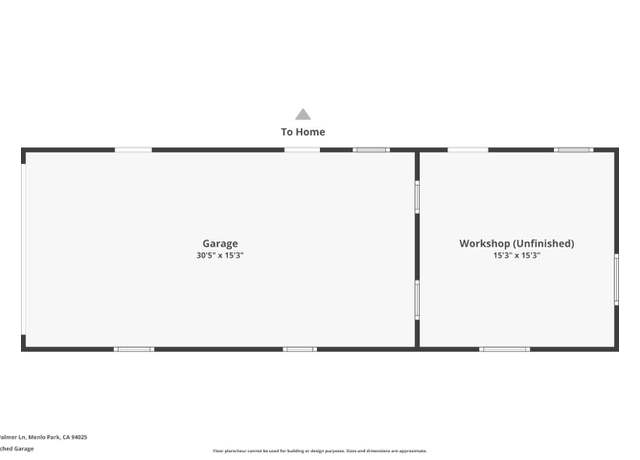
Opportunity meets charm at 541 Palmer Ave, nestled in Menlo Park's North Fair Oaks neighborhood. This property offers the chance to build your dream home or remodel/expand the existing four-bedroom, three-bathroom residence, complemented by a detached garage with bonus space. Situated on a flat, rectangular 12,000 square foot lot, the potential is endless. Palmer Lane boasts several newer and larger homes, offering a unique canvas to customize your next home. Step inside to discover a privately fenced sanctuary featuring large windows that flood the interior with natural light. Hardwood floors add warmth and character to the flexible floorplan, which includes a formal dining room ideal for
Move in and enjoy this newly renovated home nestled in the beautiful Westside neighborhood of Menlo Park near Stanford University. Three large bedrooms plus a huge enclosed office. Beautiful full house remodel in 2024. Meticulously improved with elegant designer touches. Gleaming engineered wood floors. Stunning chef's kitchen with recessed lighting, dual ovens and quartz countertops. Spacious living room with high ceilings. Gorgeous bathrooms. Double pane windows and sliding doors. Dream primary suite with walk-in closet and a fantastic ensuite bathroom. Inside laundry. Large, peaceful and private backyard with huge deck for fantastic outdoor entertaining and daily living. Inspiring views
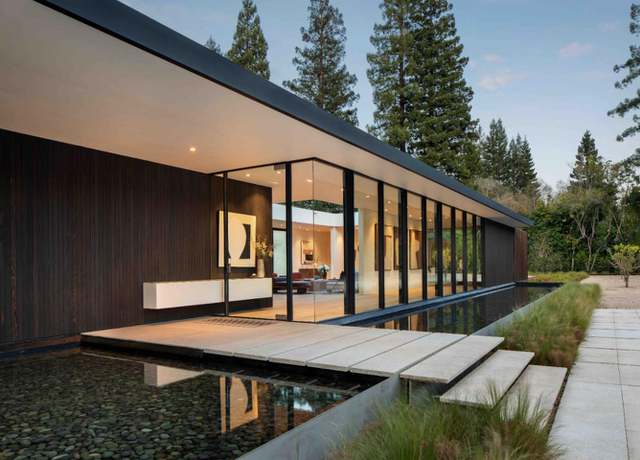
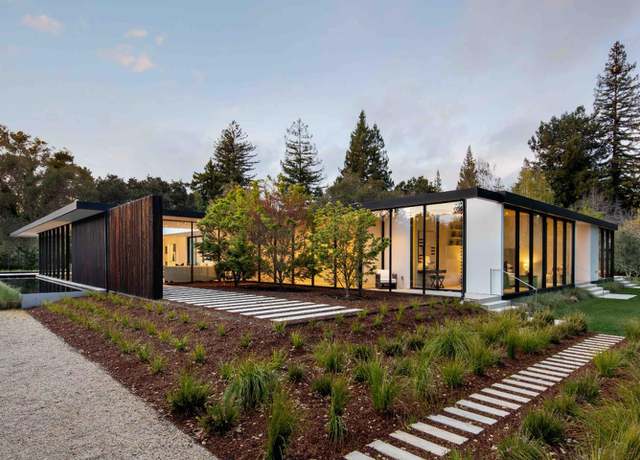
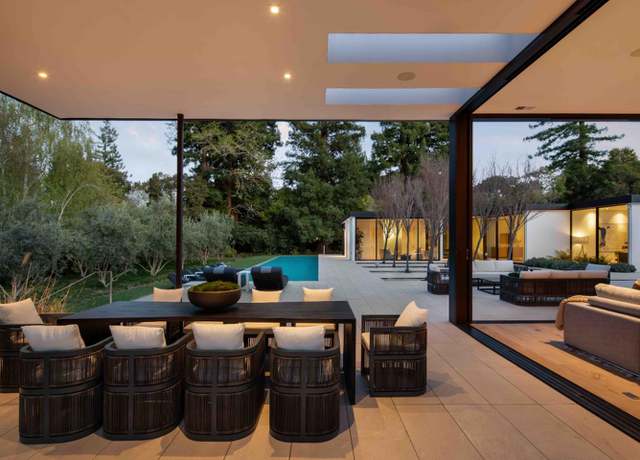
Flawlessly integrated form and function are epitomized in this home, an engineering marvel and a masterful expression of modernism. Precision craftsmanship showcases the design of award-winning architect Curt Cline of Modern House, creating a clear aesthetic vision that is both bold and graceful. His design principles, Blur the boundaries between the natural world outside and the created world inside, have been artfully achieved at this home. Cline further states, and has incorporated here, Maximize the connectivity of the interior living space and the exterior space, both visually and actually. The entire design revolves around the use of glass with entire walls that fully retract and the
Architecturally envisioned by renowned architects Young and Borlik and adorned by designer Lucile Glessner, this Atherton home stands apart from the rest, with its 20-foot glass front door and floating staircase spanning all 3 stories. Natural light brightens resort style spaces, designed to offer endless entertainment options for residents and guests. A layout for function, comfort and luxury; soft warm organic modern textures and hues create a haven for respite while epitomizing chicness. Every bedroom is huge, ensuite, features a walk-in closet, and feels like a primary bedroom. Lavish even by Atherton standards, the floor plan was designed to provide privacy and retreat. A departure fro
Magnificent estate nestled on 1+ AC prestigious West Atherton. Past the gated motor court awaits a 6-bedroom residence that has been meticulously upgraded and remodeled with top-of-the-line craftsmanship and materials, with nearly 7,400 total sf of space. Multi-level floorplan radiates style and convenience while offering expansive formal rooms, a chef-worthy kitchen, a full bar in the family room, an office, rec room, and wine cellar. Each bedroom is en suite, with the primary suite providing a fireplace and spa-inspired bathroom. The grounds offer a 5-star resort experience, complete with an outdoor kitchen, pool, and more, complemented by a pool house featuring a bathroom and kitchen. Tu
Exquisite two bedroom, two and a half bathroom townhome w/ two-car garage provides a serene sanctuary amidst towering redwood trees. Spanning three levels, this home captivates with its grand living room featuring soaring two-story ceilings and expansive floor-to-ceiling windows framing nature's beauty. A wood-burning fireplace adds warmth, setting the stage for intimate evenings or lively gatherings. The dining room overlooks the striking living room offering an elegant backdrop for memorable meals with family and friends. The open-style kitchen and family room extends to a balcony for alfresco dining or yoga practice. Upstairs, two inviting primary bedroom suites await, each with its own
A rare opportunity to own a brand-new Organic Modern home that lives like a private resort. Approximately 11,175 sf w/ sleek lines and a soft, warm palette, abundant light, open-beam vaulted ceilings, timeless fixtures and finishes from around the world. Indoor/outdoor living spaces, Spectacular kitchen w/ eat-in solarium, formal and informal living and dining areas, 2 offices, flex room, spectacular lower level rec room w/ movie theater, gym, wellness center with a steam room and sauna, wine wall, kitchen and ensuite bedroom. Attached Jr ADU with a separate entrance. Plus a pool house/ ADU opening to the pool and spa with a separate changing area/shower/wc. Gas fire pit, mature perimeter
OUTSTANDING, just completed CUSTOM REMODEL in fantastic Menlo Park location! Spacious and light, this stunning contemporary home has been meticulously remodeled with no expense spared! The striking modern interior features an open floorplan with soaring ceilings and well proportioned rooms complemented by fine finishes such as wide plank European Oak floors, custom cabinetry, marble slab countertops, custom lighting and quality fixtures & fittings throughout. * Dramatic Living Room with modern gas fireplace & a wall of sliding glass doors opens out to the spacious rear deck * Gorgeous new gourmet Kitchen features a large island with counter seating, custom cabinetry, marble sla
Nestled on one of the most coveted streets in Atherton, this custom-built estate epitomizes refined living with its impeccable design & superior craftsmanship. Upon entry through the contemporary steel & glass doors, guests are greeted by grand living & dining rooms. The chef's kitchen is a culinary masterpiece, featuring top appliances, center island & walk-in pantry. The kitchen seamlessly flows into the inviting great room, where the soaring ceiling, cozy fireplace & stacking doors lead to the outdoor terrace, blurring the lines between indoor & outdoor living. The backyard oasis, complete with pool, spa, outdoor loggia with fireplace, firepit &
In the prestigious Menlo Circus Club area, this architectural masterpiece stands as a beacon of luxury, embodying the essence of a modern Italian villa. Every aspect of the property has been meticulously curated w/ unparalleled materials from across the globe, including bespoke wall coverings & lighting specifically made for this estate. The home radiates an exceptional level of craftsmanship, featuring an array of exquisite marbles, onyx, and hand-selected mosaics & tiles, all harmoniously paired w/ timeless travertines & terra cottas. Designed to accommodate both lavish events & private moments, the main residence extends its luxury to a pool-side cabana complete w
Ultra-modern gated luxury enclave in Atherton! Rebuild from the studs with soundproofing materials by enveloping the home in ultra-thick studio-grade quiet sheetrock, Milgard soundproof windows w/ extra thick glass, & open cell foam insulation into walls, attic, crawl space, & underfloor areas, with an additional smooth finish acrylic stucco layer not only for the modern look but also providing extra massing for enhanced quietness. Beyond the 8 ft tall metal gate & 8 ft high solid wood fence towards the street, the home boasts ample outdoor leisure spaces w/ complete privacy, including a half-basketball court & a lush backyard. The interior features 14 ft vaulted ceili
Transitional home (5019sf) plus ADU(489sg) plus wine room plus large garage/attic with DELIGHTFUL use of Color to bring the interior to a fusion of contemporary styling! OPEN Center Floor Plan, SPACIOUS FEELING w/ MULTIPLE DOORS to magical & beautifully landscaped grounds:majestic pines, Japanese Maples, Fruit-bearing Trees; walkways around entire property, special ZEN ROSE GARDEN for yoga/meditation. TIMELESS!! Located in one of ATHERTON'S MOST SOUGHT AFTER Areas. Privacy yet minutes to the Menlo, PA, Stanford. Lovely entry iron gate beckons you to the home- Enchanted by surrounds of magical Landscape of plantings, Heritage Oaks & Massive Pines framing the grounds-This is clea
Fenced in Yard! Great Level Buildable Lot , 197.80' x 202.24' May be possible for a lot split under Senate Bill 9, To build a House & ADU on each Lot. Must live there 3 Years? many other requirements, check with Atherton Building/Planning at City Hall 11am - 4pm. Existing old house , selling for the land value only! Shown by Appointment Only!
This extraordinary home, showcasing traditional elegance and charm, is nestled in a peaceful setting of a beautiful garden, with pool and private water well, in the prime location of Lindenwood. This light-filled home, featuring a grand formal floor plan, is perfect for the comfort of living and the pleasure of entertaining.
Beautiful attached single-family home in the Park Forest enclave of Menlo Park. Enjoy direct access to the private community park and pool from the back patio. Well-appointed features of the home include a stunning living room with a dramatic wall of windows, a luxurious primary suite, and a "secret room" hidden behind a bookcase! Conveniently located near Downtown Menlo Park with easy access to Stanford University and Stanford Medical Center, Caltrain, and major commute routes. Outstanding Menlo Park schools (buyer to verify enrollment).
Discover an unparalleled opportunity in Atherton, Silicon Valley's most prestigious neighborhood. Envision your dream estate, spanning a generous 1.24-acre lot amid majestic valley oaks and unique topography. This property promises ultimate privacy and luxury, with plans by the esteemed Young and Borlik Architects, ready for your custom touch. Centrally located, in a highly sought-after area known for its distinguished schools. This not-yet-built modern masterpiece awaits your vision, offering the chance to create an entertainer's paradise with exquisite details throughout. A rare gem in Atherton.
Set within gated grounds spanning more than an acre, this remarkable 5-bedroom estate embodies the Town of Athertons signature blend of exquisite privacy and unparalleled luxury, and boasts over 5,200 total sf of living space. Bright, elegant interiors appointed with gorgeous hardwood floors, fine millwork, and natural stone finishes offer spaces perfect for both entertaining and everyday living. Enjoy expansive formal rooms, the eat-in kitchen with high-end appliances, the family room catered from a wet bar, and deluxe en suite bedrooms highlighted by the primary suite with a private balcony and adjoining office. Experience a true indoor/outdoor lifestyle on spectacular grounds complete wi
New Construction. Immerse yourself in unparalleled luxury at this timeless estate nestled in serene West Atherton. Meticulously crafted for the discerning individual, this residence offers a haven of tranquility. Step inside and be captivated by the abundance of natural light. Oversized windows grace exquisite living spaces adorned with natural materials, creating an atmosphere of sophistication and refinement. Floor-to-ceiling doors seamlessly blend indoor and outdoor living, inviting you to unwind on expansive patios surrounded by meticulously landscaped grounds. Indulge your culinary desires in the gourmet kitchens outfitted with top-of-the-line appliances. The adjacent family room provi
This truly exceptional property is one of Atherton's Finest Estates with an unparalleled combination of grandeur, luxury, and timeless appeal. Set on an expansive 3.17-acre level lot, the estate is enveloped by breathtaking gardens established with specimen plantings at every turn adding a unique and awe-inspiring dimension. The entire property was artfully rebuilt within the main structure in 2001 into a remarkable living experience with discerning taste. Over $22 million, in today's currency, was spent to completely rebuild and upgrade the home. Every detail exudes a sense of elegance and luxury yet is purposely designed to create a welcoming ambiance that avoids feeling overly formal. Gr
Located in prime central Lindenwood this gated stunning home was designed by PPG with acute attention to detail at every turn. Formal living room with wood burning fireplace, adjacent office with fireplace all with garden views. Stunning formal dining room, chef kitchen featuring Wolf range, 2 dishwashers, Sub-Zero refrigerator, warming drawer next to casual dining room with adjoining office. Family room with fireplace and opening to the rear yard. Upstairs features a rare 5 bedrooms total including the primary suite with balcony, bathroom with heated floors, and walk-in closet and 4 additional bedrooms plus an office. In total there are 3 dedicated offices. The lower level consists of a gu
Situated on a fantastic street in the heart of West Atherton, the country's most exclusive ZIP code, this property awaits a vision for the future. The expansive, fully level lot spanning more than one acre also presents an enticing opportunity for new construction in this prestigious location with proximity to many magnificent estate properties. Within the main residence, classic details resonate throughout with, original hardwood and tile floors, and a focal point carved stone fireplace in the grand living room. The kitchen is vintage with its tiled counters metal cabinetry and a sun room opens to the rear grounds. Completing the main level are a den, a generously sized bedroom with an adj
Unique opportunity to unlock the advantages of buying an in-progress home built by Thomas James Homes. When purchasing this home, you will benefit from preferred pricing, designed personalization, and more. Estimated home completion is Winter 2024/Early 2025. This Craftsman-style home makes hosting a breeze with the flex room, expansive dining and great room spaces, plus a gourmet kitchen with a walk-in pantry. The main floor comes complete with an ADU with kitchenette and en suite bathroom. Head upstairs to the second floor, which offers a loft, 3 secondary bedrooms, and 2 full bathrooms. Indulge in the luxuries of the grand suite's spa-inspired bathroom and walk-in closet. Contact TJH to
This hidden jewel situated on 1.55 acres barely discernible from the street & positioned across from the esteemed Menlo Circus Club, is one of Atherton's most exceptional estates. The home has undergone a transformation by its current owners. While the outside symmetry & classic allure endure, it has evolved into a place of chic sophistication, showcasing a soft neutral palette complemented by American cherry & light oak floors. Every room is light & bright w/ exquisite subtle appointments, recessed lighting, extensive custom built-ins, & even moldings designed to hang fine art in lieu of attaching to the wall. A hallmark of this residence is a commitment to med
Discover Eichler's Personal Masterpiece: A Mid-Century Haven in Atherton. Nestled among the mature oaks of Atherton's prestigious Lindenwood neighborhood, this 5 BR, 5.5 BA, 3700 sq ft home, the original residence of renowned builder Joseph Eichler stands as a testament to mid-century modern design and a personal embodiment of his architectural vision. Designed by the iconic architects Anshen & Allen in 1951, this home not only marked the beginning of Eichler's illustrious career but also served as his personal sanctuary until 1965. The Eichler residence is more than just a structure; it's a spatial narrative that unfolds through its V-shaped layout, parallelogram-themed rooms, and a
Gorgeous 4 Bedroom 4 Bathroom Home with Spectacular Views. Formal Entry. Elegant Living Room with Fireplace and Stunning Views of Western Hills. Formal Dining Room. Chef's Eat-in Kitchen Opens to Spacious Family Room with Fireplace, Vaulted Ceilings, and Breathtaking Views. Primary Suite Retreat Features Double Closets, Stall Shower, and Separate Tub. 4 Bedrooms. 4 Bathrooms. Inside Laundry Room. Separate Office with Fireplace. Wrap Around Deck. Lovely Landscaped 15,682 +/- Lot. Award Winning Las Lomitas School District. Breath Taking Views of Western Hills and Sharon Heights Golf Course
THE ESSENCE OF QUIET LUXURY ---This estate captures the essence of Provence blending authentic details with modern luxury. Meticulous craftsmanship with architecture by Young & Borlik and an incredibly private setting on 2 separate parcels totalling 2.33 acres (6 Betty Lane 1.06 acres & 215 Stockbridge 1.27 acres). Carefully curated details on 3 levels with 5 bedroom suites (4 on the upper level each have lofts), exceptional theatre for 12 w/ theater acoustics by Charles Salter renowned for Skywalker Ranch, large fitness center, spa bath with steam & sauna, wine cellar with dining, recreation room, office, library + project rooms. Radiant heat floors in both main residenc
Unique opportunity to unlock the advantages of buying an in-progress home built by Thomas James Homes. When purchasing this home, you will benefit from preferred pricing, design personalization, and more. Estimated home completion is Fall 2024. Situated on a quiet street in North Fair Oaks, this 4-bedroom, 3.5-bathroom residence is designed to delight. This Traditional-style home makes hosting a breeze with an ADU, expansive dining and great room spaces, plus a gourmet kitchen with walk-in pantry, and stainless-steel appliances. The second floor offers a loft, 2 secondary bedrooms, full bathroom, laundry room, and grand suite with a luxurious grand bathroom and walk-in closet. Contact TJH t
Timeless French Country Manor exuding unparalleled elegance and charm. Its classic architecture, characterized by high ceilings, multiple fireplaces, limestone and hardwood floors, captures the essence of refined living. Banks of French doors and windows welcome natural light through all interior spaces, creating warmth and character. A fully equipped gourmet chef's kitchen stands as the heart of the home. Four en-suite bedrooms include a stunning newly remodeled primary suite. Lower level office with fireplace could easily be a 5th bedroom with full bath nearby. Outside, the estate unfolds over a peaceful 1.1+ acre lot of park-like grounds bordered by Oaks and Redwood Trees. A swimmer's po
Nearly an acre plays host to this 5-bed estate in coveted Lindenwood. Idyllic grounds lead to over 5,700 sf of total living space adorned with luxurious features and abundant natural light. Offering generous gathering spaces, a well-appointed kitchen with high-end appliances, an impressive home theater, detached office, multiple bedroom suites, and a spacious one-bedroom guest home separate from the main residence. Stunningly gorgeous grounds invite a true California indoor/outdoor lifestyle with a sparkling pool and water slide, a sprawling lawn and stone terrace, playground, and an enclosed vegetable garden. Though this location offers incredible privacy, you will still be convenient to d
The epitome of Atherton living awaits in this 6-bedroom estate son over an acre of land. Stunning quality and skillful craftsmanship are evident throughout the multi-level floorplan, where high-end materials craft a lavish ambiance and a bold use of glass bathes over 9,100 sf in natural light. Enjoy luxurious gathering areas, the chef's kitchen is with top-tier appliances, multiple flexible-use rooms and a dedicated office, as well as a theater, fitness center, and wine cellar. A five-star resort experience awaits in the rear grounds, which include a magnificent saltwater pool, fireplace terrace, and outdoor kitchen. And though you will feel incredible privacy, this home is within easy reac
Conveniently located near Menlo Park and excellent schools. Remodeled with a beautiful palette of materials, marbles, eucalyptus hardwood floors, modern updated baths. Light and Bright with tremendous soaring ceilings and floor to ceiling glass. Gourmet modern kitchen with marble slab counters, high-end appliances, eat-in counter and large breakfast area. 4 large bedroom suites upstairs and 1 bedroom on main floor, primary suite with large walk-in closet and a resort quality bathroom. Large walnut paneled formal office with a beautiful view of backyard. Expansive formal dining room and a perfect formal living room meant for entertaining and holidays. Family room open to kitchen with French
This classic estate property, on just over 1.5 gated acres, exudes timeless elegance in a beautiful setting with redwood groves, vast stretches of lawn and terraces, plus a pool, spa and sport court. Marble and oak floors, lofty ceilings, and intricate millwork define the main living areas, which include traditional formal venues, a personal chefs kitchen plus the main kitchen, a large open family room, media/play room, and an executive office. Personal accommodations include 5 bedrooms, each with en suite bath. There is a spacious multi-room primary suite as well as a junior suite that is ideal for guests or extended family. The lower level (not included in the 7,663 SF is approximately an
At the end of a cul-de-sac in the premier Circus Club area, this property was built in 2012 w/ inspiration from the villas in Urbino, Italy. The entire property is masterfully finished w/ an array of imported materials from the antique French roof tiles to the lavish exterior stone. Inside & out, an endless succession of design embellishments . .. hand-scraped ceiling beams & walnut floors, rare stone surfaces, & hand-plastered walls & ceilings. Behind the scenes, distributed audio, programmable lighting, & a home automation system. Luxurious amenities highlighted by an extraordinary wine cellar, a home theater, & recreation lounge w/ bar. Spacious terraces
Just under 13,000 square feet all in, no expenses were spared in architectural design and finish for this bespoke custom-built home, available to purchase now prior to completion this Summer. Modern architecture adorned by towering heritage greenery - flanked by soft capacious lawns - frame the unobstructed city light views over the San Francisco Bay, a nearly unheard-of offering in the prestigious community of Atherton. A layered mix of warm, rich woods, hand selected imported Italian stone, and luxurious neutrals complement the bright, airy flow of this beautiful open concept residence - it is beyond compare. Elevated living in energy efficient clean and healthy systems from a hospital gr
Tucked away in privacy on over an acre in West Atherton, this 4-bedroom home boasts 4,350 square feet of living space along with the opportunity to enjoy all that an Atherton lifestyle affords. Fresh, light-filled interiors offer a sophisticated floorplan with highlights that include large gathering areas, refinished hardwood floors, multiple fireplaces, an expansive kitchen, and a convenient office to work from home in comfort. Enjoy the spa-like bathroom in the spectacular primary suite, which also offers a seating area perfect for a variety of needs. Outside, an incredible ipe wood deck provides the perfect venue on which to enjoy a true California indoor/outdoor lifestyle in the home's
This Atherton magnificent estate with resort-like grounds is truly reflective of an enormous European luxurious gem. Built in 2002, the spectacular three-story home has been substantially remodeled. When entering this home, the enchanting roses welcome you along with a private pool, spa and synthetic lawn. There are four bedrooms, each with a walk-in closet and bathroom, plus an office and a flexible-use room at lower level along with a spacious recreation room accommodating the home. Additionally, a detached guest house with Murphy bed, kitchenette, full bath, and heated poolside terrace. The property is just blocks away from downtown Menlo Park, close proximity to exceptional Atherton and
This 4-bedroom home is located in a prime location at the end of the cul-de-sac off Polhemus. The lot size is 43,955 sq. ft lot (1.009 acres) per the subdivision map dated July, 1957 Buyer to confirm. There is a beautiful backyard with expansive grass area and swimming pool. One could either remodel the home and/or build their dream home. It is in the Las Lomitas Schools District.
Newly built in 2019 by Conrado, this luxury home in Lindenwood is flawlessly finished in a warm contemporary style. Set on a corner lot, the home makes a commanding first impression wrapped with streamlined modern fencing. The crisp white walls and white oak floors are further enhanced by dramatic windows and glass doors that fill the home with natural light. Grand scale public rooms flow effortlessly from one to the other as well as to the outdoors where a sparkling pool and spa await the quintessential California lifestyle. Personal accommodations are abundant with 7 bedroom suites arranged over two levels connected by a striking vertebrae staircase outlined in clear glass. Three suites a
An excellent opportunity to build your dream home on a flat lot, in one of Atherton's most desirable and premier central locations. This location is walking distance to the prestigious Menlo Circus Club. Approx 2.55 acres and already subdivided into 1.36 acres and 1.19 acres lots (APN 070-310-140 and 070-310-130). Top private schools- Sacred Heart School and Menlo School are close by ( less than 3 min drive). Stanford Shopping Center is less than 10 min drive.
$30,000,000
— beds— baths2.54 acres (lot)
83 & 93 Camino Por Los Arboles, Atherton, CA 94027
School data is provided by GreatSchools, a nonprofit organization. Redfin recommends buyers and renters use GreatSchools information and ratings as a first step, and conduct their own investigation to determine their desired schools or school districts, including by contacting and visiting the schools themselves.Redfin does not endorse or guarantee this information. School service boundaries are intended to be used as a reference only; they may change and are not guaranteed to be accurate. To verify school enrollment eligibility, contact the school district directly.
Homes for sale in Atherton have a median listing price of $10.35M. Some of these homes are Hot Homes, meaning they're likely to sell quickly.
What are some of the most popular neighborhoods in Atherton?
Popular neighborhoods include West Atherton, Gulf Beach, Lindenwood, Redwood Oaks, Atherton Oaks, Sharon Heights / Stanford Hills, Sharon Height, Central Menlo, Downtown Menlo Park, and Allied Arts.
In Atherton, California, transportation primarily revolves around car usage, as the town is predominantly residential. Traffic levels for driving are generally low, contributing to a smooth and seamless driving experience. Despite its suburban nature, Atherton does not have a public transportation system. However, it is conveniently located near major highways and freeways, such as the I-280, providing easy access to surrounding areas.
What types of properties are available in Atherton?
Atherton, California offers a variety of single-family home types, including ranch-style, contemporary, and modern architectural designs, all located in this affluent community. These homes typically feature 3-6 bedrooms and were built between the 1950s and present day. To explore different property types for sale in Atherton, California, use the 'Home type' filter located above the active listings. Customize your search by selecting options like single-family homes, condos, townhomes, and more.
What is life like in Atherton?
Living in Atherton, California offers a serene and picturesque environment with stunning landscapes. The region experiences a pleasant climate throughout the year, with mild winters and warm summers. The area provides a range of job opportunities across various industries, attracting professionals from diverse backgrounds. Residents can indulge in a variety of recreational activities, including outdoor sports, exploring nature trails, and engaging in community events. Atherton also offers a vibrant cultural scene, with art galleries, music festivals, and local theater productions to enjoy.
What are the schools and amenities like in Atherton?
Atherton, California provides its residents with a variety of public amenities to enhance their living experience. The town boasts a well-maintained park for leisure and recreational activities. Unfortunately, Atherton does not house any grocery stores or restaurants within its borders, necessitating a short trip to neighboring areas for such needs. However, the town does offer a public library, providing a wealth of knowledge and resources for residents. Additionally, Atherton is home to a community center, which hosts a range of events and activities for residents to enjoy.
In the past month, 3 homes have been sold in Atherton. Find your dream home in Atherton using the tools above. Use filters to narrow your search by price, square feet, beds, and baths to find homes that fit your criteria. Our top-rated real estate agents in Atherton are local experts and are ready to answer your questions about properties, neighborhoods, schools, and the newest listings for sale in Atherton. Our Atherton real estate stats and trends will give you more information about home buying and selling trends in Atherton. If you're looking to sell your home in the Atherton area, our listing agents can help you get the best price. Redfin is redefining real estate and the home buying process in Atherton with industry-leading technology, full-service agents, and lower fees that provide a better value for Redfin buyers and sellers.


 REDFIN IS COMMITTED TO AND ABIDES BY THE FAIR HOUSING ACT AND EQUAL OPPORTUNITY ACT. READ REDFIN'S FAIR HOUSING POLICY AND THE NEW YORK STATE FAIR HOUSING NOTICE.
 United States
 Canada