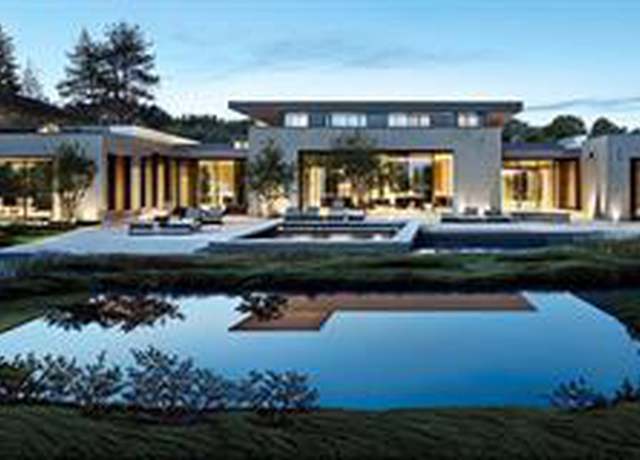
This modern masterpiece, built in 2018 embraces mid-century aesthetics and design principles in Lower Hillsborough on a secluded half-acre. Designed by Nancy Sheinholtz Associates, the home is surrounded by redwoods and features a modern facade of stainless steel and stone. Inside, polished concrete floors and glass walls underscore the modern vibe. The layout promotes indoor/outdoor living with retractable glass doors connecting the spacious great room to the outdoor pool area. The kitchen is a modern culinary space with top-tier appliances. There are 5 bedrooms, each with its own bath, plus an office. Main-level bedroom suite, upstairs primary suite and two additional suites, plus a priva
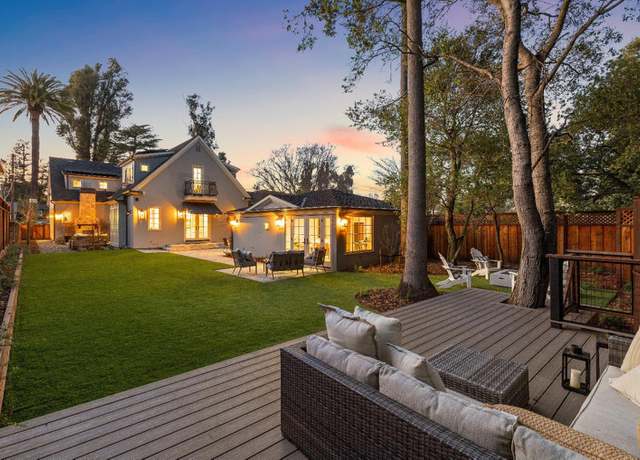
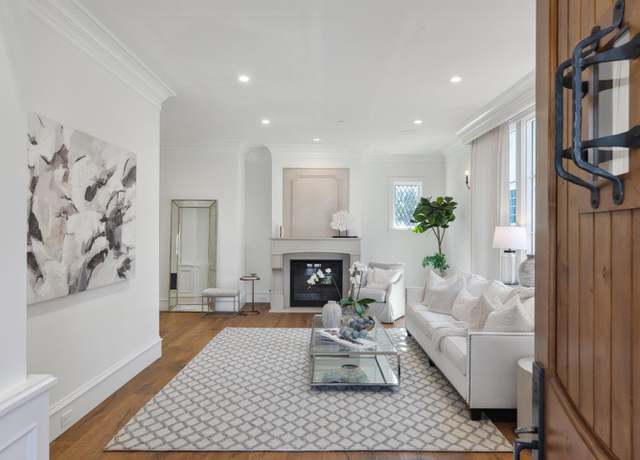
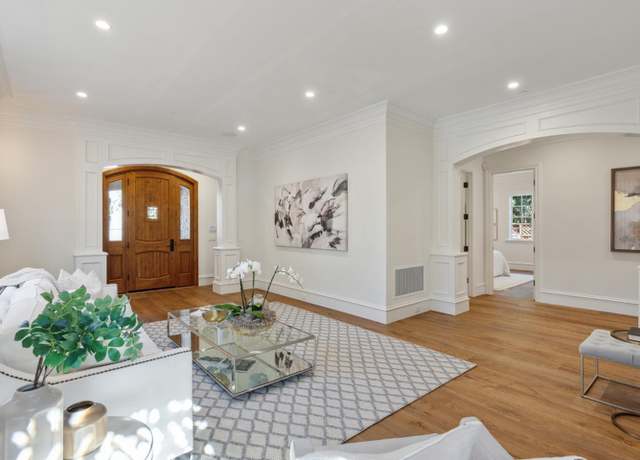
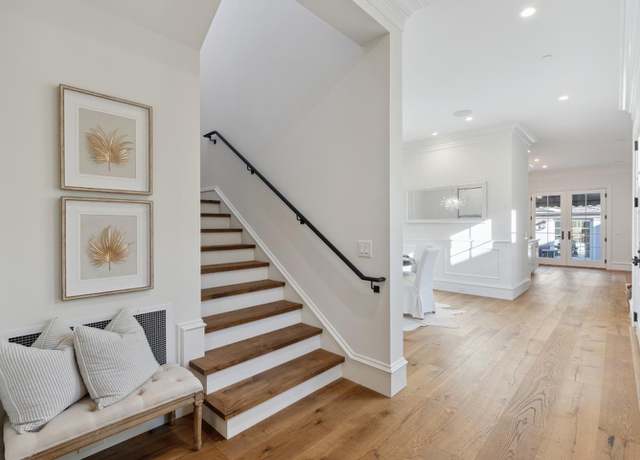
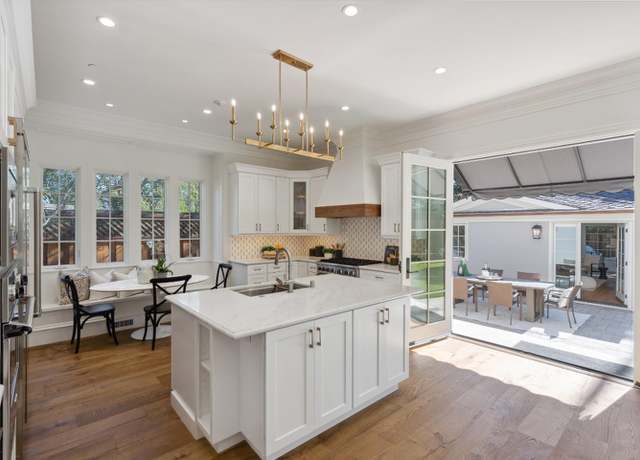
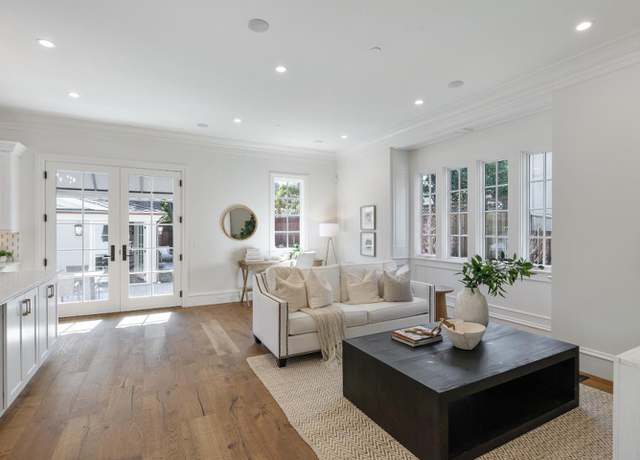
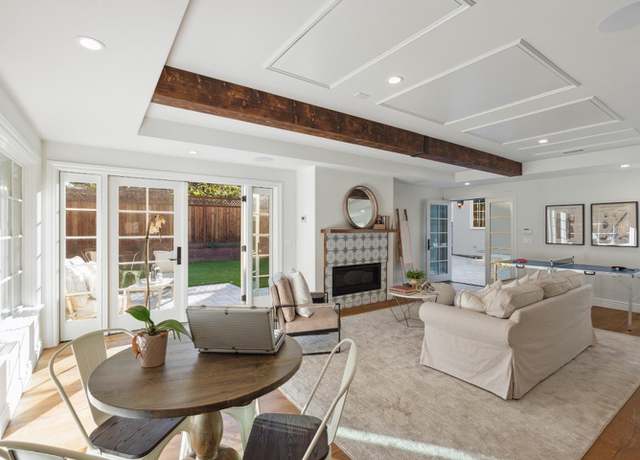
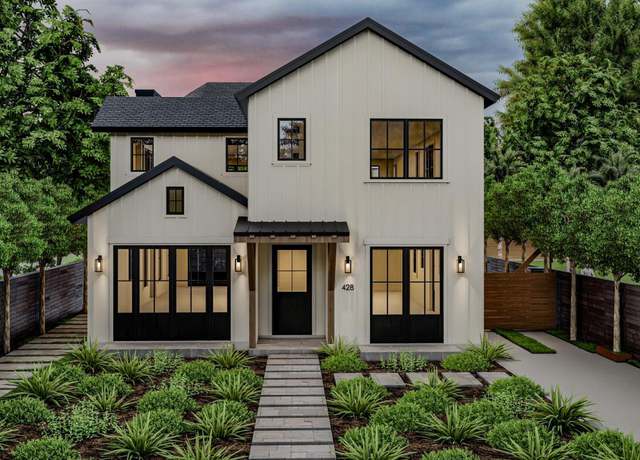
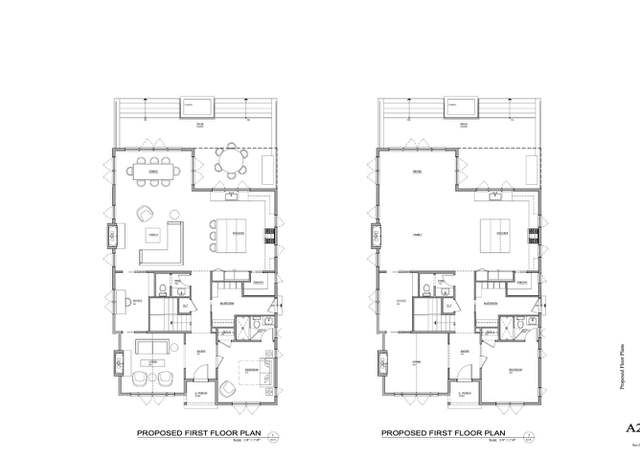
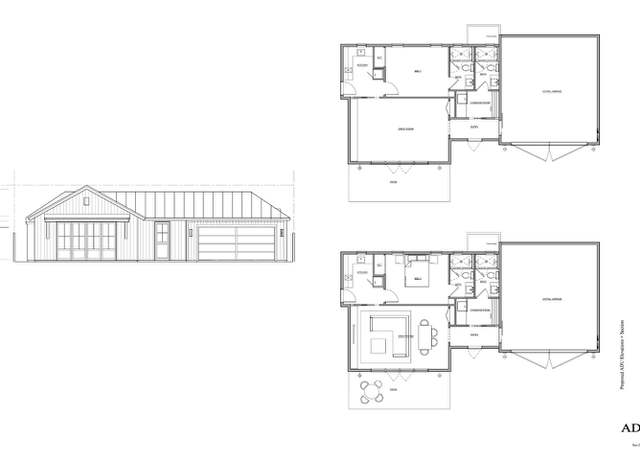
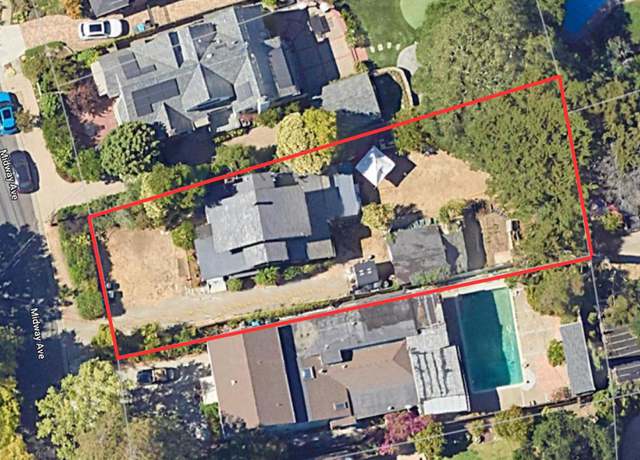
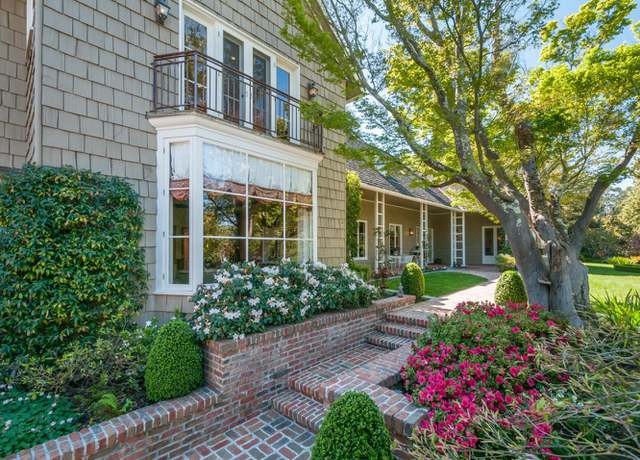
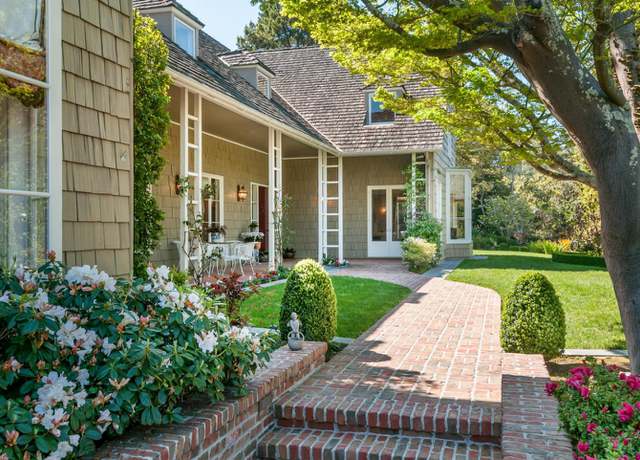
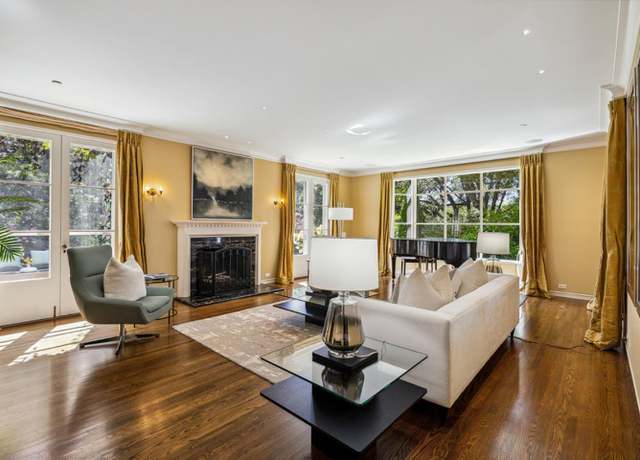
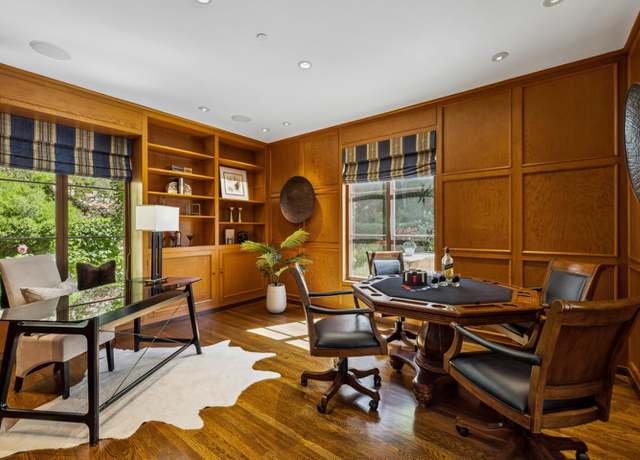
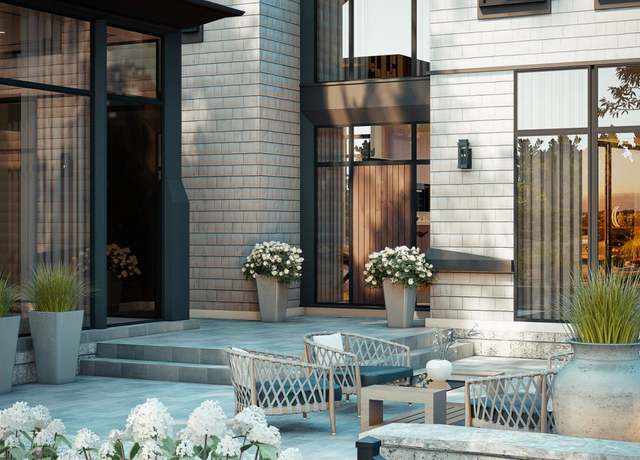
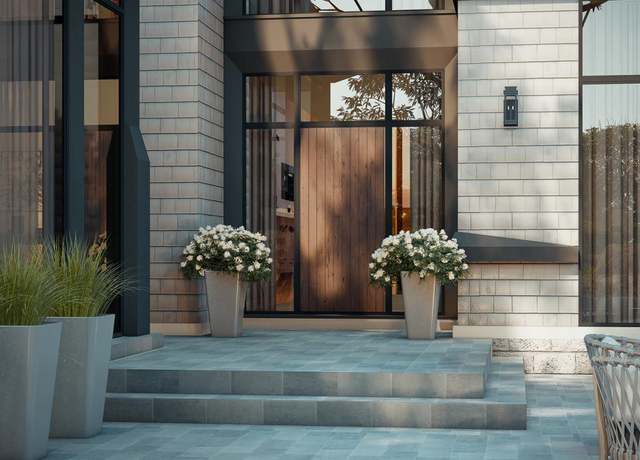
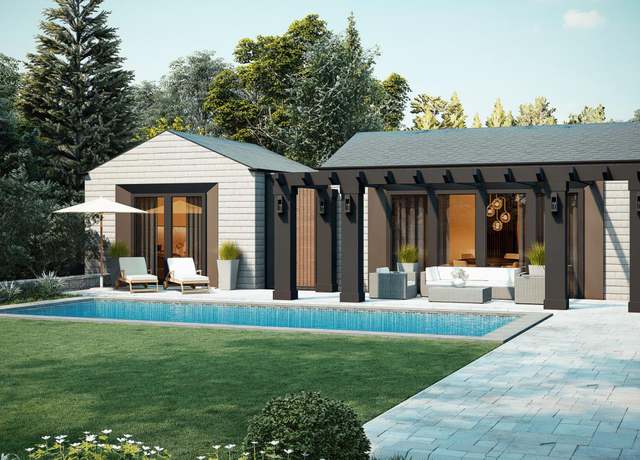
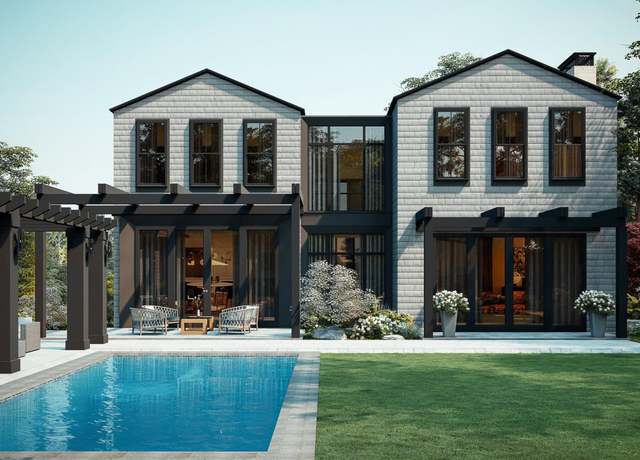
Discover modern luxury in this newly completed home with an ADU in Lower North Hillsborough. Boasting a modern interpretation of the classic Colonial style on landscaped grounds of more than one-half acre at the end of a cul de sac. The two-level home features designer hardwood floors, custom colors, exquisite lighting, and high-end finishes. The layout includes formal living and dining areas plus a spacious great room with top-tier stunning kitchen. 5 bedrooms, each with en suite bath, one on main level also ideal for an office. The ADU has 2 additional bedroom suites and a full kitchen. Pool, spa, fire pit, barbecue center, bluestone patios, and vast lawn perfect for relaxation and entert
Nestled in the serene neighborhood of Hillsborough, 575 Darrell Road is a testament to modern luxury living. This meticulously crafted residence boasts 2918 square feet of exquisite living space, featuring 4 bedrooms and 3.5 bathrooms, perfectly tailored to accommodate the needs of a discerning homeowner. Notably, this home underwent extensive remodeling in 2016, including a thoughtful addition to the square footage, ensuring it seamlessly blends contemporary amenities with timeless charm. Every detail, from the upgraded fixtures to the modern conveniences, reflects the utmost attention to quality and craftsmanship, but the allure of 575 Darrell Road extends beyond its interiors. Step outsi
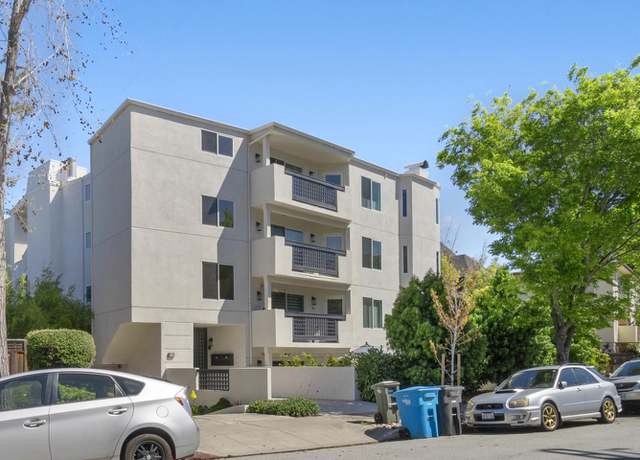
Discover the allure of this exceptional condo in the heart of downtown Burlingame. Enjoy the convenience of having an elevator next to your unit. Boasting an impressive walkability score and unparalleled convenience, this residence offers a spacious living room adorned with a cozy fireplace, a generous dining area, and a well-appointed eat-in kitchen with a breakfast bar. Step outside to the balcony, accessible from both the kitchen and the second bedroom, creating a seamless indoor-outdoor living experience. The primary suite is a luxurious retreat, featuring a spa-like tub with jets and a separate stall shower, while the second bedroom offers ample closet space and direct access to the ba
Classic ranch-style home with spacious lower level ready to move in and enjoy or excellent opportunity to further transform or potentially build new. Located at the end of a cul de sac on approx. 1.2 acres with partially level grounds with pool and vast space for entertaining and play. Freshly painted and beautiful hardwood floors. Classic and timeless style includes crown and chair rail moldings, wainscot, floors in herringbone pattern, and two fireplaces. Formal living and dining rooms, kitchen-family room combo with large deck and lower-level rec room opening out to the pool. 4 bedrooms and 3 full baths include main-level primary suite and lower-level guest suite plus there is a bonus ro
Modern Contemporary 2021 Home, Mt. Diablo and Bay views, stunning attention to detail, mature landscaping and grand entry invites you into the large entertaining rooms and open interior. Living and dining centered around a feature fireplace, European white oak flow seamlessly throughout. Enjoy indoor-outdoor living w/ La Cantina sliders. Office w/ built-in cabinetry and views of the front yard. Kitchen w/ Miele and Liebherr appliances, sweeping countertops, high-end fixtures, family room, outdoor BBQ patio, mudroom, two half baths and connected two-car garage w/ workshop. Guest/In-law suite on first floor. Grand staircase leads to four suites upstairs, laundry room, primary suite with two w
Stunning home on most sought after street in San Mateo Park! This 4 bedroom 3.5 bath home boasts formal living spaces, high ceilings, kitchen family room, lovely primary suite, exceptional sunny lot, an office and extra in law room or den. Detached garage with game room or potential ADU. Close to Burlingame Ave and nearby parks.
2016-built contemporary masterpiece on a premier street in lower North Hillsborough. Sustainable design by architect Dan Phipps, built by Toboni Builders with solar power, radiant-heated concrete or oak floors, wiring for EV, and radiant deck heated salt water pool on just over one-half acre. Native landscaping, Corten steel walls, and Ipe wood exterior. Accent walls, cabinetry, and doors all in gorgeous walnut and ceilings up to 20 feet. Formal dining room plus tremendous great room with modern kitchen designed for home chef, private chef, and caterers. Primary suite, secondary suite, and office on main level + 2 beds and bath upstairs along with customized study center. Lower level rec ro
Modern elegance meets unrivaled luxury. This modern luxury masterpiece epitomizes elegance and sophistication situated on a sprawling two acre lot, this estate includes a guest house boasting opulence at every turn with a pool overlooking views that are unmatched. Marvel at the grandeur of 26-foot ceilings and european oak floors as you enter connecting to the gourmet kitchen, adorned with cambria countertops and top-of-the-line gaggenau appliances beckoning culinary excellence. Entertain effortlessly in the game room, indoor/outdoor bar, and gym while indulging in relaxation in the sauna or luxurious jacuzzi tubs. The exterior of this estate adorns european garage doors, italian windows, a
Magnificent Mediterranean Estate with 6 bedrooms, 6 bathrooms, plus an additional two half bathrooms/Soaring ceilings with custom skylights provide an abundance of natural lighting over the dramatic entry that features grand columns and graceful staircases with custom ironwork and a cascading water wall feature/Spacious Primary bedroom with high coffered ceiling, bold crown molding, fireplace, a separate walk-in closets and spacious main bathroom that features a large shower with dual heads and a separate tub/Sizable office/study with cozy fireplace and built-in bookshelves that are blessed with an abundance of natural lighting from multiple sides/The resort-style backyards is perfect for e
Huge updated Legacy home, with a large backyard that boasts six bedrooms, four bathrooms & a den/office. Incredible corner lot home walking distance to Borel Middle School, Aragon HS & Baywood Elementary in the well-sought Baywood-Aragon area with over 3,600 square feet of living space and west of Alameda De Las Pulgas. Due to the large lot size and recent California Law, a detached ADU and JADU are allowed on this property, and can be transformed to house in-laws, college-age children, caregivers, or rent-paying tenants. Natural light shines in all hours of the day with colorful neighborhood and Bay views. This home also features a Gourmet Kitchen with restaurant grade applianc
Step into this custom-designed home, constructed in 2001, boasting a sprawling 3,600 square feet all on one level, nestled on a coveted level lot. The architecture exudes charm with its lofty ceilings, creating an open, luminous ambiance. Expansive windows frame picturesque views of vibrant flowers and lush trees, bringing the outdoors in. This spacious abode features 5 bedrooms, 4.5 baths, all thoughtfully arranged. Entertain guests in the formal living and dining areas, or retreat to the elegant wood-paneled office for quiet productivity. Gather in the generous family room, seamlessly connected to the functional kitchen with a granite-topped center island & top-of-the-line stainless
Fabulous, turnkey, one level home presents a versatile & open floor plan perfect for indoor/outdoor entertaining & enjoying the California lifestyle. Modern layout with high ceilings & natural light streaming in through abundant windows & skylights is extended by a beautiful covered patio with built-in BBQ, stone counters and gas firepit. The expansive living/great room, adorned with a stunning marble fireplace & appointed with designer light fixtures, wallpaper & window treatments, contribute to the luxurious ambience of this immaculate home. The Chef's kitchen features: Thermador suite of appliances (6 burner cooktop, refrigerator, oven, dishwasher) Uli
HUGE PRICE REDUCTION!!!!! TOBIN CLARK'S BEST IN CLASS!!! Fantastic modern showcase situated at the end of a quiet cul-de-sac. HUGE 1.21 ACRE LOT w/ lots of mature trees & foliage for total privacy & seclusion. THREE LIVING AREAS IN ONE, w/ a 4,691 SqFt main house * , a 748 SqFt pool house * , and 578 SqFt guest house * . The pool house has 2 pristine bathrooms & a full kitchen & living room. The guest house has 2 spacious bedrooms & 1 bathroom. PERFECT FOR GUESTS, RENTAL INCOME, AND MULTI-GENERATIONAL. Curb appeal features a wrought iron gate, flowering hedges, & commanding columns. Inside, the open floor plan optimizes space & flow allowing for com
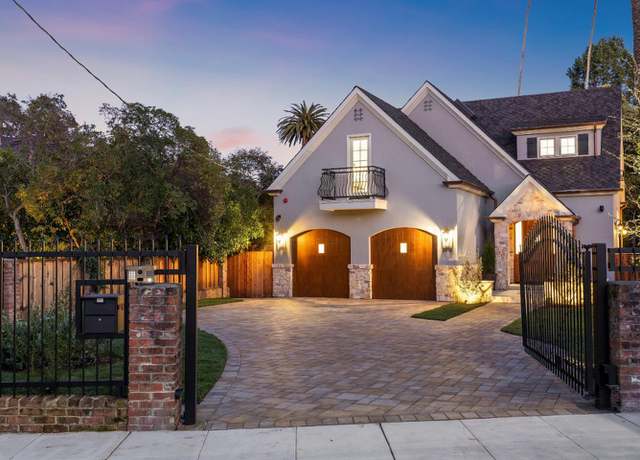
BRAND NEW GATED ESTATE. .. CARMEL MODERN ON DOUBLE LOT WITH ADU! Savor "that new house smell" from this charismatic luxury estate on one of Burlingame's most treasured streets. Easton Drive, the famed gateway to Burlingame's Easton Addition, and just a block from the Hillsborough border, hosts this curated lifestyle statement by esteemed local builder BG Pacific. Sweeping gated front grounds, akin to Hillsborough or Atherton, create a sense of arrival and spacious set-back from the road. Artisan construction details, from the smooth grey stucco, to the rustic stone accents and nods to European design. The exterior endears you with its Carmel architectural ambiance, while inside lo
Over 1.8 absolutely level acres, one of only a few parcels of it's size in all of Hillsborough. The merging of two . 9 acre lots, the parcel totals over 1.8 acres and can easily be subdivided into 2 lots. Located in the most coveted location in lower Hillsborough, 210 Uplands sits across from some of Hillsborough's most beautiful estates. A once in a lifetime opportunity. When gone there will be no others.
Your Dream Home Awaits in Prime San Mateo Park! Seeking the perfect situation? Look no further than this exceptional opportunity to create your dream home in the prestigious San Mateo Park neighborhood. Situated on a fantastic lot in a highly desirable area, on a quiet, picturesque street, this property comes with plans to commence construction on your ideal residence this summer. Embrace the chance to craft your perfect house in a fantastic neighborhood, making your dream home a reality. Complemented by an ADU, 6 ensuite bedrooms, and separate areas for living and dining, each space crafted for memorable gatherings and relaxing moments. Additional information available upon request. Don't
ATTRACTIVE SELLER FINANCING AVAILABLE TO QUALIFIED BUYER. Spectacular Custom Contemporary 6 bed/6.5 bath in highly coveted lower Hillsborough. Filled with natural light & clean line finishes, this spectacular property is set in a well-manicured verdant tree-lined large corner lot. Stunning architectural features of stately columns, soaring ceilings, and artful use of natural stones of marble, granite & sandstone set the tone for this sophisticated showcase of a home. The design and layout of this home epitomize California living at its finest. The open-flowing floor plan and strategically placed bedrooms, office areas and entertaining areas allow for an effortless combination of
Price Reduced 300k!!! Offers presented as the come. Tucked away at the end of a long private driveway, hidden from view, lies this charming abode. Full of cozy embrace, this home exudes warmth and charm, seamlessly blending inviting aesthetics with practical design elements. The bright floor plan is both welcoming and functional, conducive to everyday living and entertaining. With ample living quarters throughout, inside youll find both a spacious living room and wide-open family room. The well-equipped kitchen has what you need to get the job done, and when its time to eat, theres a large formal dining room. The versatile 3 bed 3 bath layout has room to accommodate the whole family, includ
Experience luxury and sophistication in this completely remodeled and expanded prime Lower Hillsborough home. Nestled in a private cul de sac location on a . 49 acre lot, this residence offers a warm and inviting floorplan with spacious formal living, dining, family and kitchen areas. The first floor features the original master plus two bedrooms and a second-story addition with a stunning primary suite retreat and another large ensuite bedroom, plus an office loft area. Abundant natural light and modern flare through the newly installed Nano door and skylights, this home combines comfort with style. Upgrades abound, from new windows, roof, electrical, plumbing and floors to a fully transfo
Welcome to 200 W. 3rd Avenue in beautiful Lower Baywood. .. La Patrona, one of the finest quality-built homes in San Mateo! This magnificent four-bedroom, three and a half bathroom Mediterranean home was originally built in 1936 and has been lovingly maintained. The current owners have made many quality improvements and upgrades over the past 20-years and have taken this home to the next exquisite level that you see today. Gracious sized rooms, updated gourmet kitchen, quality fixtures and finishes in all bathrooms, including the main floor powder room. The entry foyer and the master craftsmen formal staircase greet you as you enter this fine home. The 4th bedroom was most recently used as
Verdant retreat of 1.4 acres in the heart of prime Hillsborough. This sophisticated home has views of trees from nearly every room. A voluminous foyer with a focal picture window looking onto lush foliage introduces the bright open interior with soaring ceilings, spacious, elegant formal rooms, 3 bedroom suites with walk in closets (2 are primary suites), & a kitchen updated with center island, all new appliances (Thermador range, Bosch refrigerator + dishwasher & wine cooler) opens to a big eat in kitchen and sizable family room. An office or library off the main hallway can be closed off or open to extend the living room and a perfectly situated powder room serves the common ar
Welcome to 1203 Parrott Drive, a stunning modern home that has been meticulously renovated to the highest standards. 3-bedroom, 2-bathroom residence boasts 1470 sq ft of living space on a generous lot of 9690 sq ft. Smart home features rough finishes that have been expertly crafted, including new framing, isolated piers, vaulted ceilings, & floor leveling with 3/4 plywood. Every detail has been carefully considered, the Class A Composition Shingles to the Milgard Tuscany Windows & custom front door. Step inside to discover a home that has been transformed. Home has been sheathed with OSB, insulated, & features foam insulation in the vaulted ceiling. New electrical wiring, p
ONE OF HILLSBOROUGH'S FINEST PROPERTIES!!! Breathtaking views of the San Francisco bay & beyond. HUGE MOSTLY LEVEL LOT WITH OVER . 5 ACRES. Exquisite Mediterranean design complemented by a red-tiled roof and circular paver driveway. A grand foyer welcomes you in with soaring ceilings. Throughout you'll find hardwood flooring, carpeting, and recessed lighting. To the left of the foyer, a refined living room with a tasteful fireplace. On the right, a great room that integrates both the kitchen & dining area and family room; ideal for hosting guests. The high-end, modern chef's kitchen is a culinary haven, equipped with all top-of-the-line stainless steel appliances, a large center
Discover unparalleled value in this meticulously crafted luxury new construction at 1175 San Raymundo in Hillsborough, California. Completed in 2023, this remarkable residence offers a grand living experience with expansive proportions and top-tier finishes, spanning over 5200 square feet. Thoughtfully designed for modern living, it features two family rooms, a spacious open living-dining area with a chef's kitchen, six bedrooms, seven bathrooms, and an additional flex room, striking the perfect balance of relaxation and privacy. Bifolding windows throughout enhance the seamless indoor-outdoor integration, defining the home's character. Complemented by thoughtfully designed decks and terrac
Elegance abounds in this original William Wurster design that was expanded and restored to perfection by renowned local architect Farro Essalat. Tucked away on approximately . 73 acres of outstanding verdant grounds, 989 Hayne Road is a rare gem that is to be cherished for generations to come. Every feature of this five bedroom, five and one-half bath home offers the highest level of design, impeccable attention to detail, and masterful craftsmanship. The welcoming foyer with beautiful curved staircase is a fitting prelude to the grandly-proportioned interior spaces, which include a library, billiard room, huge family room and mud room. The delightful flow of this exceptional home extends t
Indulge in the epitome of luxurious living with this newly renovated Hillsborough estate, offering breathtaking views of the San Francisco Bay. Custom-built in 2000 and recently transformed into a transitional modern design, this residence offers natural light throughout and boasts 6 generously sized bedrooms and 6 1/2 baths. Enter through a formal foyer with a sweeping stairway, setting the tone for the elegance within. Two primary suites with expansive views, provide a serene escape. Pamper yourself in the primary suite's steam shower, offering a spa-like retreat within the comforts of home. The open kitchen-family room floor plan is a showcase, featuring top-of-the-line brand new applian
LOWER NORTH HILLSBOROUGH! CREATE YOUR DREAM ESTATE! I INCLUDED A COUPLE VIRTUAL RENOVATION PHOTOS THAT HIGHLIGHT THE EXTREME POTENTIAL THIS PROPERTY OFFERS! WALK TO NORTH ELEMENTARY SCHOOL AND DOWNTOWN BURLINGAME AVE. SITUATED ON A 1.1 ACRE FLAT PARCEL, THIS 7900+/- SF HOME IS LOCATED ON ONE OF HILLSBOROUGH'S MOST COVETED STREETS. EVERYWHERE YOU LOOK, THE MEDITERREANEAN DESIGN CELEBRATES IMPRESSIVE ARCHITECTURAL DETAIL RARELY FOUND IN HILLSBOROUGH. THE MAIN HOUSE OFFERS 5 BEDROOMS, 6 BATHROOMS, A BEAUTIFULLY APPOINTED LIVING AND DINING ROOM WITH PERIOD DETAILS, SEPARATE OFFICE WITH WET BAR AND FIREPLACE, LARGE SPACIOUS KITCHEN, ADJACENT FAMILY ROOM WHICH OPENS TO THE SUNNY YARD AND POOL, A
Welcome to 762 Chateau Dr, an opulent residence that defines the pinnacle of luxury living in the prestigious Carolands Hillsborough enclave. Nestled on a pristine street, this architectural marvel seamlessly blends timeless elegance with contemporary sophistication. Revel in an array of amenities, including an inviting outdoor pool, a tranquil retreat to the natural outdoor space, and the convenience of an elevator. This residence offers not just a home, but a lifestyle of unparalleled luxury. Schedule your private tour today and envision the limitless possibilities of refined living at 762 Chateau Dr.
Buy Then Build: Lot and Approved plans included in price. Secluded in exclusive Hillsborough, this modernist masterpiece, a three story wonder of glass that floats with the forest. Designed by acclaimed, award-winning architect Leonard Ng, the plans for this iconic 11,875 sq. ft. retreat are a meditation on minimalism, an extension from the trees that questions where nature ends & home begins. Clear heart red cedar siding opens to vast windows, soaring lines and engaging angles that lean into natural light & wide views. 7 en suite bedrooms, 9 bathrooms, a great room, wine cellar, fitness studio, wet & dry saunas, plus detached 800 sq. ft. guest house provide for exquisite
BEST DEAL DONT MISS OUT!!!!! ONE OF THE BEST VIEWS IN ALL OF HILLSBOROUGH! UNPARALLELED PANORAMIC BAY VIEWS from nearly every part of the house. 270 DEGREE+ UNOBSTRUCTED VIEWS! Experience breathtaking sunrises & sunsets right from the backyard. Embrace the good life w/ this one-of-a-kind showcase home. Contemporary design culminates w/ modern conveniences in a fantastic open floor plan; this is the pinnacle of luxury living! The home itself sits on an expansive 1.3 acre lot at the end of a private cul-de-sac. The sophisticated foyer sets the tone for the entire residence. Inside you'll find high ceilings, crown molding, recessed lightings, skylights, hardwood flooring, a semi-spiral
ONE OF HILLSBOROUGH'S MOST IMPRESSIVE BAY-VIEW MANSIONS! Walk to Burlingame! 10 minutes to SFO! You won't believe the architectural quality and drama! Soaring Bay Views for this renovated classic, assigned to North Elementary and within walking distance of Downtown Burlingame Avenue! Best of both worlds with authentic Gatsby character, yet this house was painstakingly restored in the early 2000s to bespoke heights. Storybook street of minimal traffic, shouldered by other picture-perfect mansions, only 1.4 miles to downtown Burlingame & just 1.1 miles to North School. * Grand entertaining platform of architectural significance on 4 levels. * Ceilings soar to 25 feet. * Monumental lobby
ANOTHER HUGE PRICE REDUCTION! $1Million Deduction! - A truly RARE LISTING that embodies opulence and exclusivity at its finest! IT DOESN'T GET BETTER THAN THIS SHOWCASE HILLSBOROUGH ESTATE! This once-in-a-lifetime property presents the perfect opportunity to live a life of luxury & sophistication, one you deserve! Tucked away at the end of a cul-de-sac in one of Hillsborough's most prestigious neighborhoods, seated on an over 1 acre lot. Commanding panoramic Bay views inside & out; from Downtown SF to the San Mateo Bridge. You get a front row seat to the true beauty of our world! The exterior is a testament to refined aesthetics & meticulous craftsmanship, embraced by meti
Situated on a private side street, this grand estate sits on a majestic 2-acres with jaw-dropping panoramic bay views, some of the best in all of Hillsborough. Exquisite architectural detailing and finishes throughout, including inlaid parquet walnut floors, hand carved fireplaces, and walls of glass framing iconic bay views and landscaping. The main level includes a stunning office, billiard hall, and the "Morocco Room" lounge. Upstairs, the large master suite enjoys equally stunning views of the bay, in addition to a luxury spa bath and formal sitting room. A separate in-law suite and wine cellar with tasting room are located on the lower level of the residence. Equally impressi
GREAT OPPORTUNITY FOR THIS TROPHY ESTATE * * * If you are looking for the best of the best, this is a once-in-a-lifetime opportunity for you to enjoy your life! After years of renovations, 1868 Floribunda Avenue is ready for you to view! The lot is almost 5x bigger than standard lots, all usable! Renovated to the highest quality, situated in one of the best locations in Hillsborough! Nearly 20,000 square feet throughout 6 buildings. New custom-built water well. Three private gates - resident driveway, guest driveway, and pedestrian walkway. No expense was spared for this property to reach the ultimate heights in a smart & secure dream home! You have to see it, to believe it! Qualifi
The subject property comprises of one legal parcel of vacant land covering an area of approximately 1.23 acres and presents a unique opportunity for a residential development and to build your dream estate. This vacant land offers a blank canvas to explore various possibilities. This site is situated at 0 Woodridge Road and Crystal Spring, providing excellent accessibility and visibility. Furthermore, the lot is located in one of the quietest areas in Hillsborough. This private land caters to everyone's preferences with favorable zoning and a prime location. This land presents an exceptional opportunity to shape a remarkable ground-up development in the thriving city of Hills
2205 Skyfarm Drive is one of the last of the estate sized building sites in the famous Country Club Manor. 0.825 Acre lot, the lot is fairly level and flat, located in the prime and desirable area of Hillsborough. The backyard is adjacent to Burlingame Golf and Country Club. The parcel faces northwest and is sheltered by many of the original heritage trees. 2205 Skyfarm Drive is a once in a lifetime opportunity to build the estate of your dreams. Seller has a boundary survey on file and conceptual home designs available. Close to Eucalyptus, Burlingame restaurants, stores, and boutiques are minutes away.
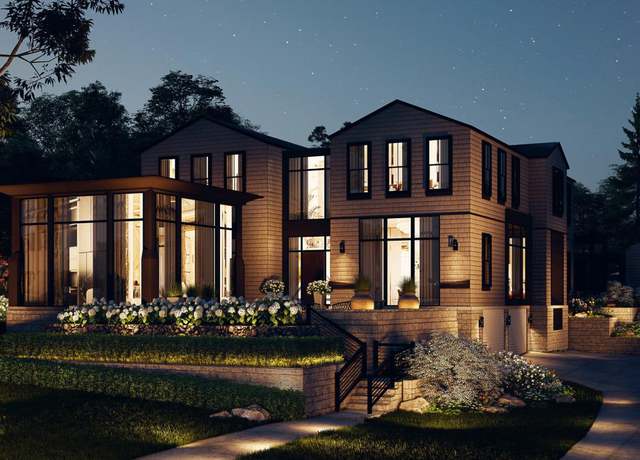
Land + Approved Plans only Included in Price. Flourish in this once-in-a-lifetime 5 bedroom, 6 bathroom Modern Shingle Style Farmhouse Design full of harmony and light on half an acre in coveted lower Hillsborough. This gorgeous 6,000 square foot retreat is designed for construction and completion in winter 2025 by Gold List builder RG Development. Traditionally inspired with a gabled roof and cedar shingled frame, the two story main house embraces modern sensibilities with a soaring column of glass at its heart. Eloquent connections to the outdoors bring light and nature to every corner. A pool, spa, wine room, butlers pantry, living room, theater, luxurious primary suite and an unparallel
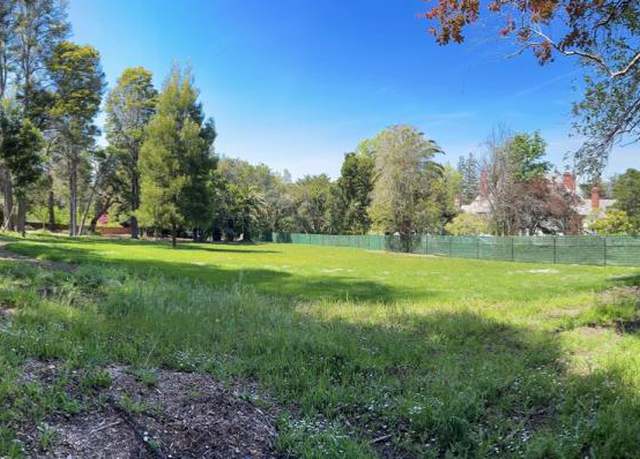
PRIME LOWER HILLSBOROUGH LOT WITH . 90 ACRES OF USABLE LAND! NEWLY RENOVATED POWERFUL WATER WELL!!!! SAVE ON YOUR WATER BILLS WHEN WATERING YOUR GARDENS! YOU WILL NOT FIND A BETTER CHOICE THAN THIS CURRENTLY IN HILLSBOROUGH!!! Located at the end of an exclusive cul-de-sac in the prestigious historic Fagan Estates subdivision. This lot features A WIDE SPRAWLING GREEN LAWN with almost an acre of pristine land to BUILD YOUR DREAM HOME! Encompassed by an abundance of mature trees offering total privacy. Only . 5 miles walking distance to bustling Downtown Burlingame. The lot offers the perfect canvas to get everything you've dreamed about with only your imagination being the limit. ONCE-IN-A-LI
School data is provided by GreatSchools, a nonprofit organization. Redfin recommends buyers and renters use GreatSchools information and ratings as a first step, and conduct their own investigation to determine their desired schools or school districts, including by contacting and visiting the schools themselves.Redfin does not endorse or guarantee this information. School service boundaries are intended to be used as a reference only; they may change and are not guaranteed to be accurate. To verify school enrollment eligibility, contact the school district directly.
Homes for sale in Hillsborough have a median listing price of $8.24M. Some of these homes are Hot Homes, meaning they're likely to sell quickly.
What are some of the most popular neighborhoods in Hillsborough?
Popular neighborhoods include Burlingame Park, Downtown San Mateo, East San Mateo, Baywood, Central San Mateo, Shoreview, Downtown Burlingame, San Mateo Park, Aragon / Baywood, and Lakeview.
Hillsborough, California boasts a robust transportation network, with cars being the primary mode of transport. Traffic levels can be high during peak hours, especially on the main thoroughfares. While Hillsborough itself does not have a public transportation system, nearby cities offer these services. The town is conveniently located near major highways and freeways, providing easy access for residents commuting by car. Learn more on our Hillsborough city guide.
What types of properties are available in Hillsborough?
Hillsborough, California offers a variety of single-family home types, including ranch-style homes, contemporary homes, Mediterranean-style homes, and modern homes. These homes can be found throughout the city, with many located in well-known neighborhoods like Carolands, Tobin Clark Estate, and Brewer Subdivision. Most properties feature three to six bedrooms and were built in various years. To explore different property types for sale in Hillsborough, California, use the 'Home type' filter located above the active listings. Customize your search by selecting options like single-family homes, condos, townhomes, and more.
What is life like in Hillsborough?
Hillsborough, California offers a serene living experience with its picturesque landscape characterized by rolling hills, lush greenery, and beautiful residential neighborhoods. The region enjoys a pleasant Mediterranean climate, with mild winters and warm summers, providing an ideal environment for outdoor activities and exploration. The area boasts a thriving job market, with a range of employment opportunities available across various industries. Residents can indulge in a plethora of recreational activities, such as hiking, biking, and exploring the local parks and trails. Additionally, the town hosts numerous community events, fostering a sense of togetherness and engagement among its residents.
What are the schools and amenities like in Hillsborough?
Hillsborough, California, provides a variety of public amenities for its residents. The town boasts a number of high-end restaurants, offering diverse culinary experiences. For outdoor enthusiasts, there are several well-maintained parks for leisure and recreation. Grocery shopping is convenient with a selection of stores available. Additional amenities include a public library, a post office, and a police station, ensuring all basic needs and services are met within the town.
In the past month, 8 homes have been sold in Hillsborough. Find your dream home in Hillsborough using the tools above. Use filters to narrow your search by price, square feet, beds, and baths to find homes that fit your criteria. Our top-rated real estate agents in Hillsborough are local experts and are ready to answer your questions about properties, neighborhoods, schools, and the newest listings for sale in Hillsborough. Our Hillsborough real estate stats and trends will give you more information about home buying and selling trends in Hillsborough. If you're looking to sell your home in the Hillsborough area, our listing agents can help you get the best price. Redfin is redefining real estate and the home buying process in Hillsborough with industry-leading technology, full-service agents, and lower fees that provide a better value for Redfin buyers and sellers.


 REDFIN IS COMMITTED TO AND ABIDES BY THE FAIR HOUSING ACT AND EQUAL OPPORTUNITY ACT. READ REDFIN'S FAIR HOUSING POLICY AND THE NEW YORK STATE FAIR HOUSING NOTICE.
 United States
 Canada