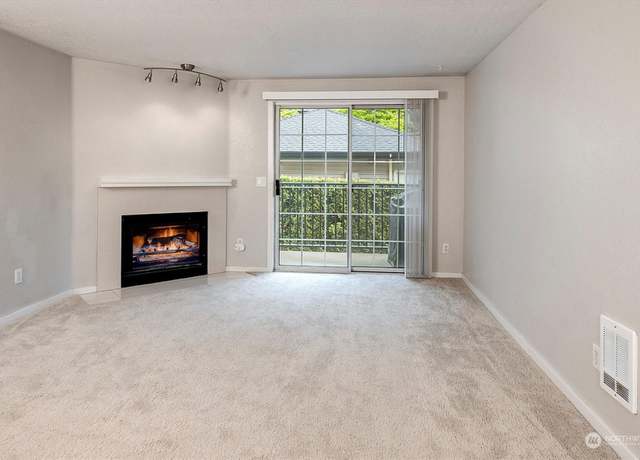
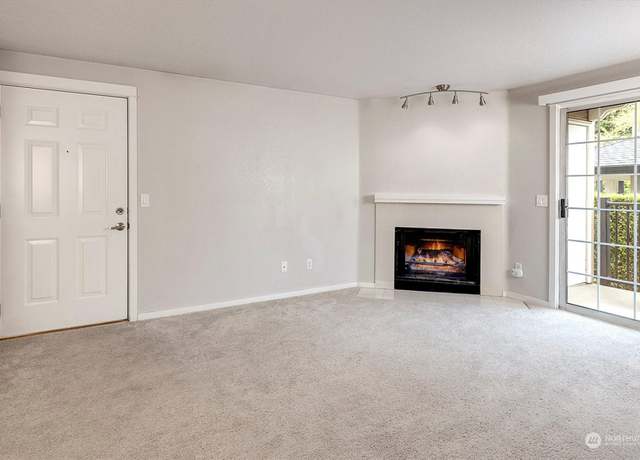
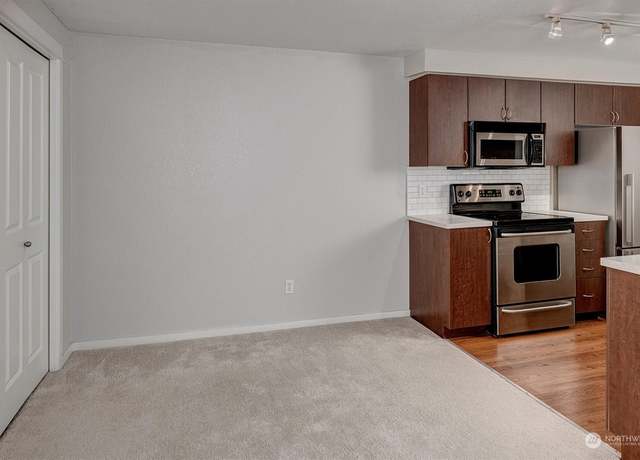
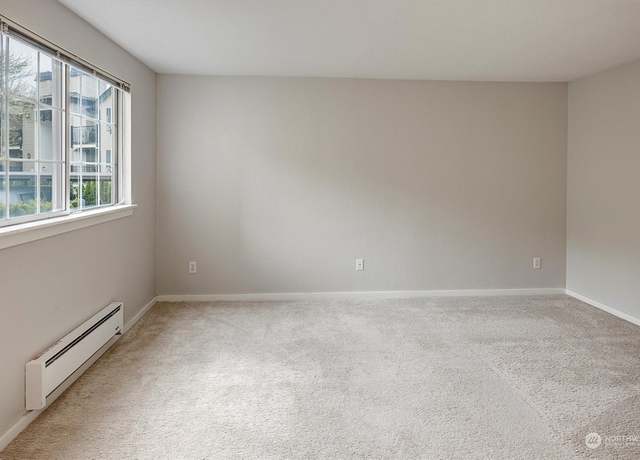
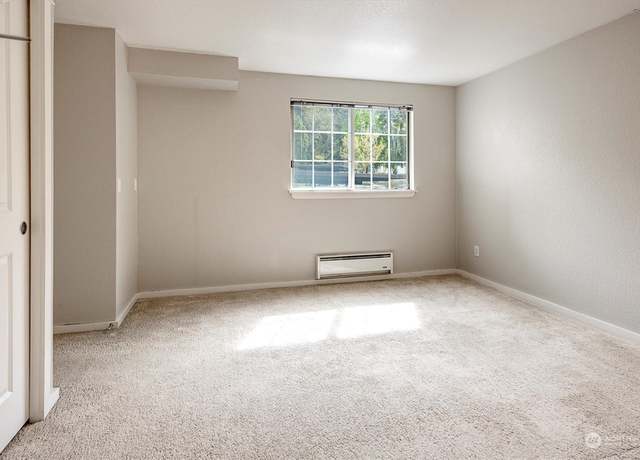
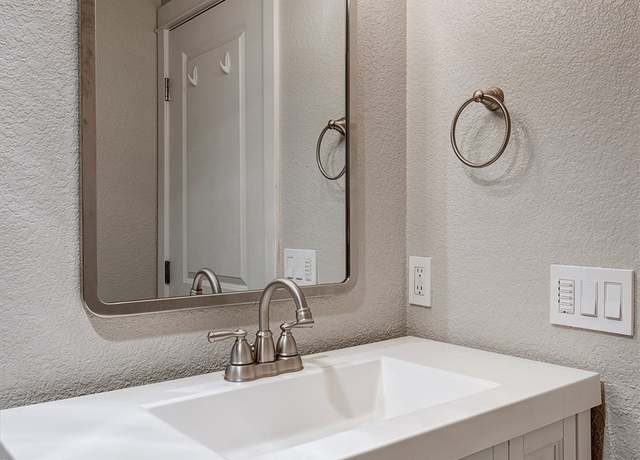
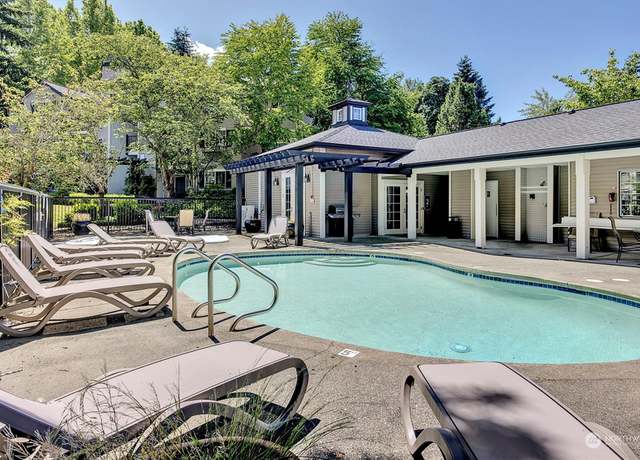
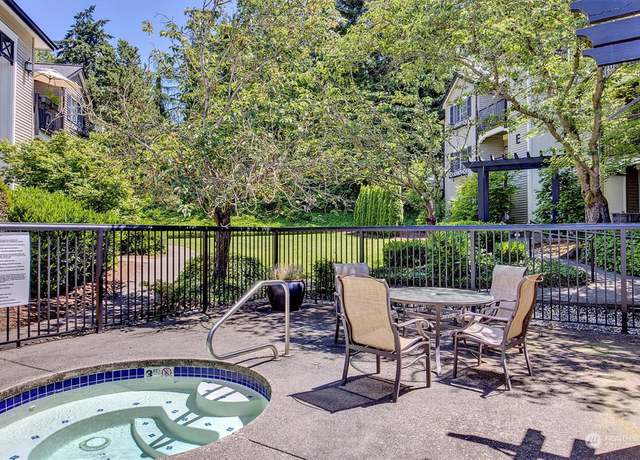
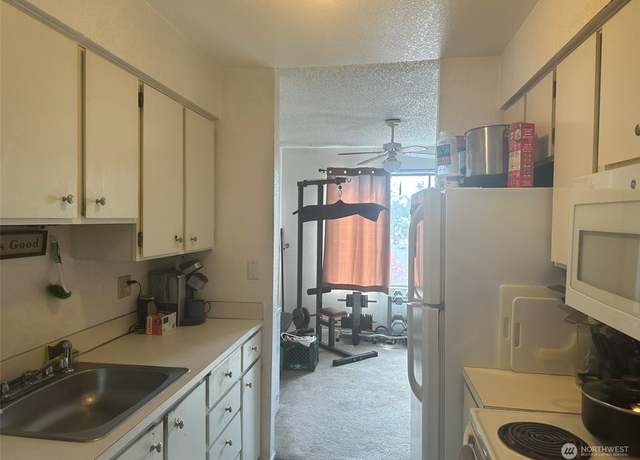
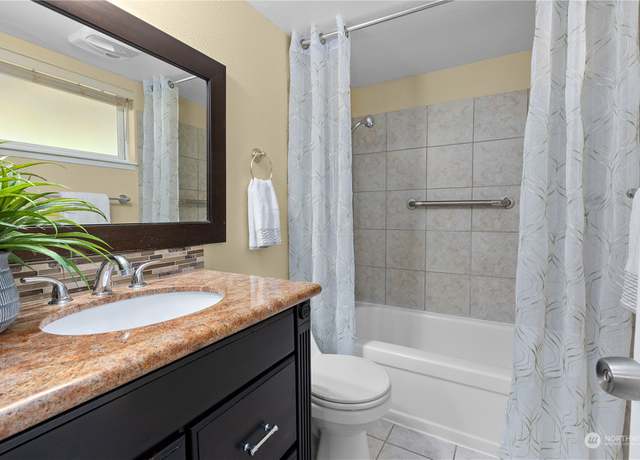
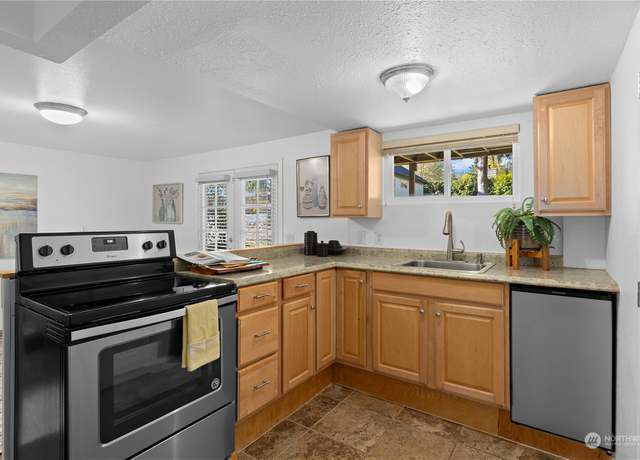
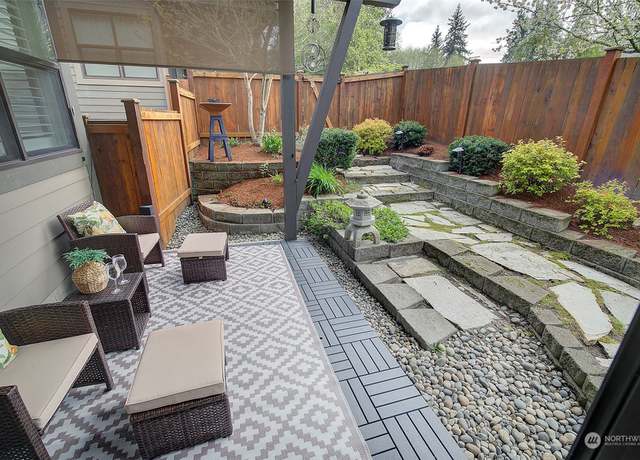
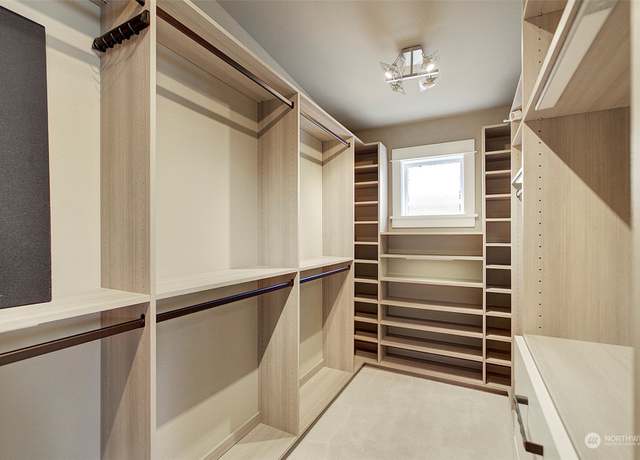
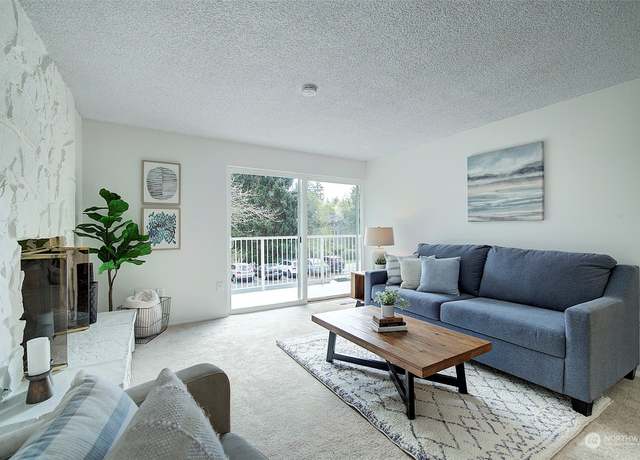
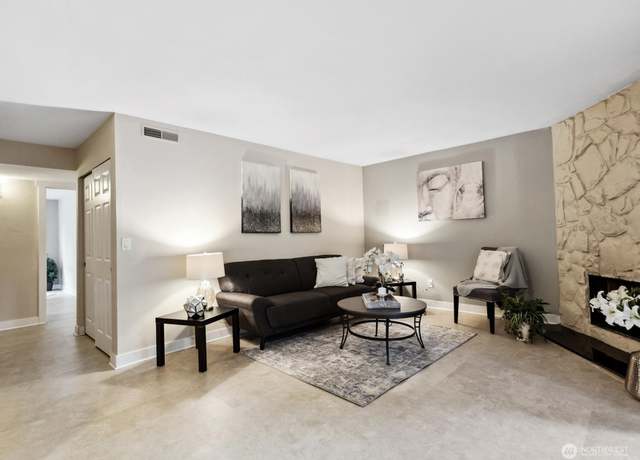
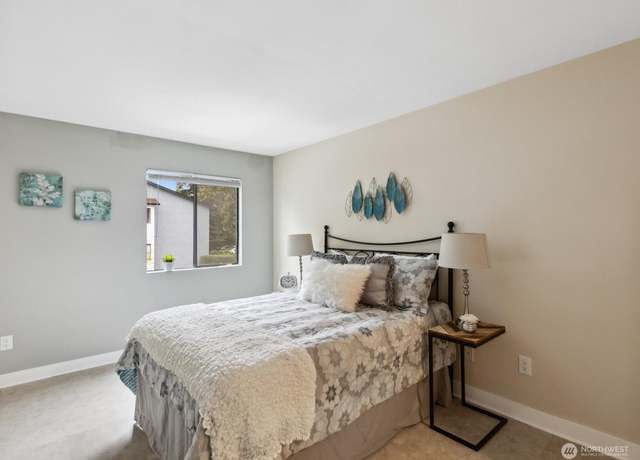
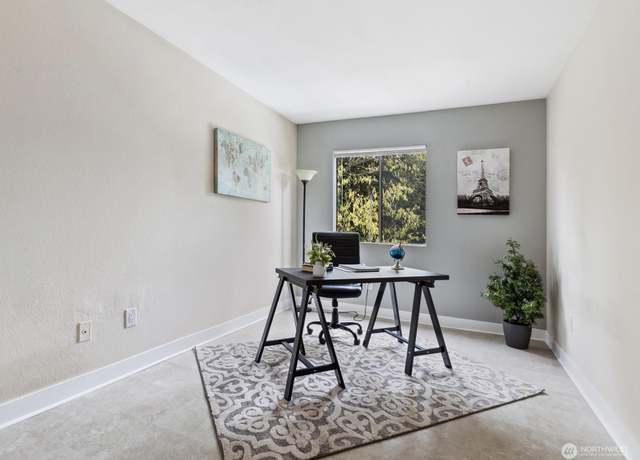
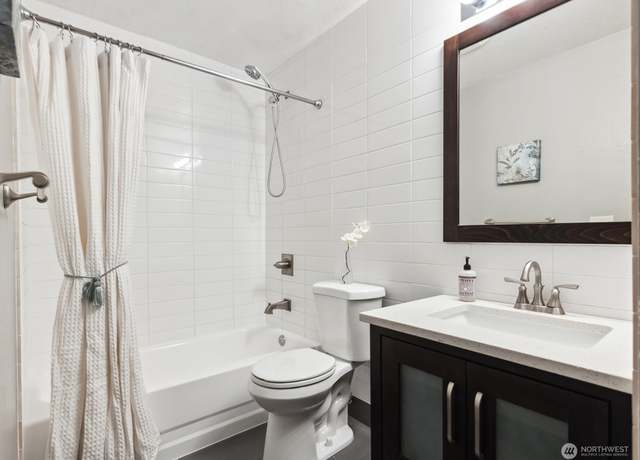
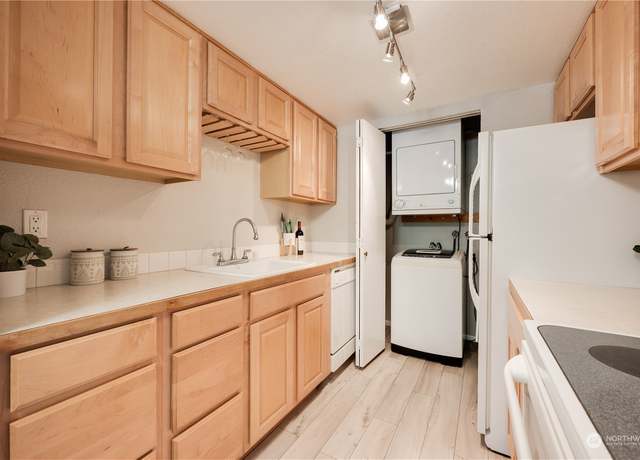
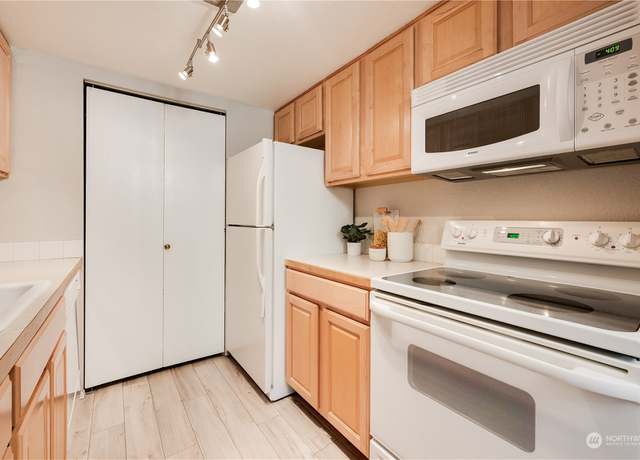
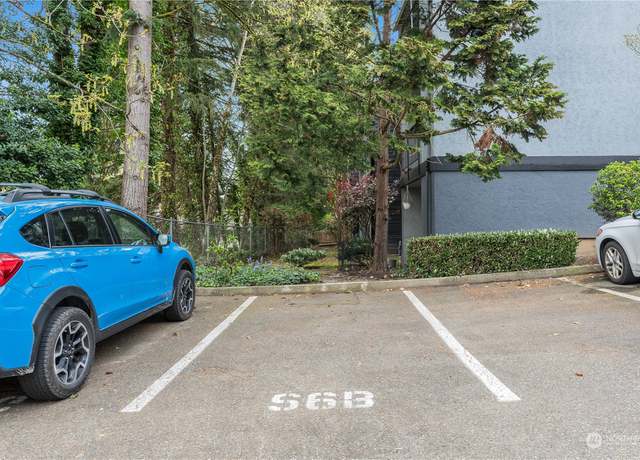
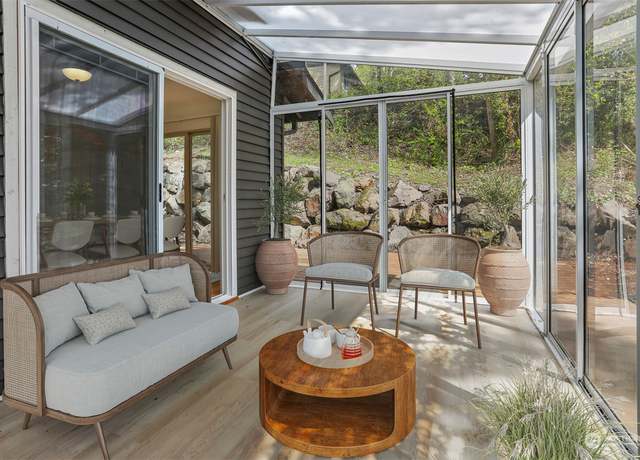
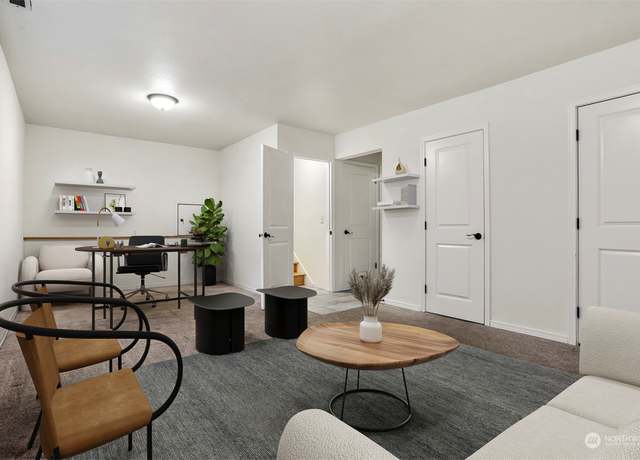
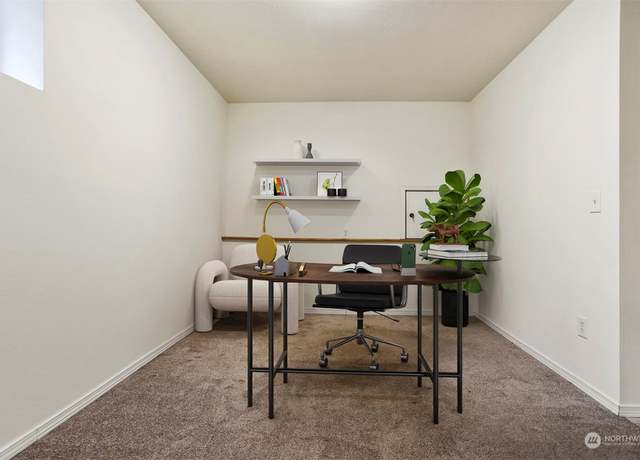
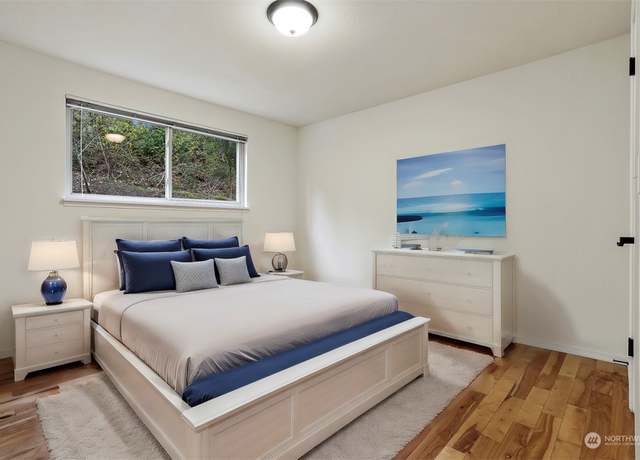
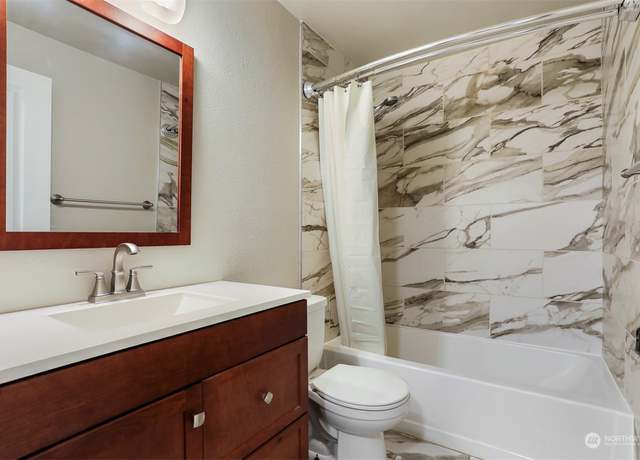
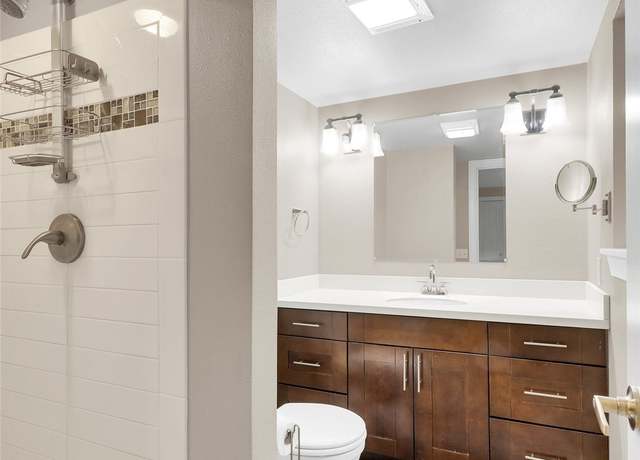
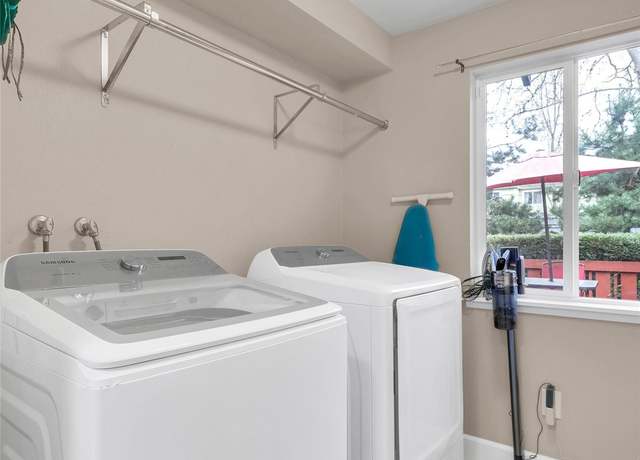
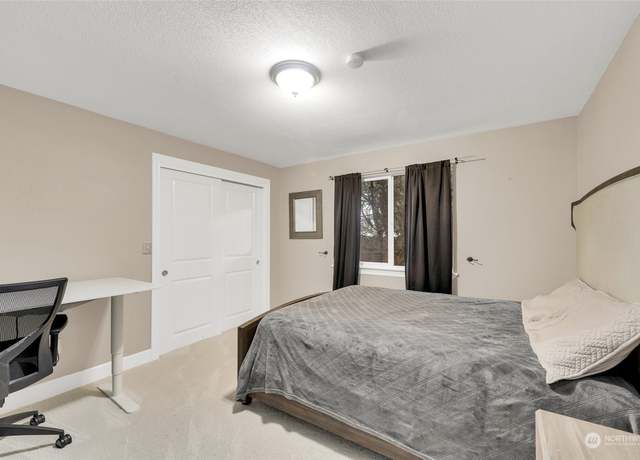
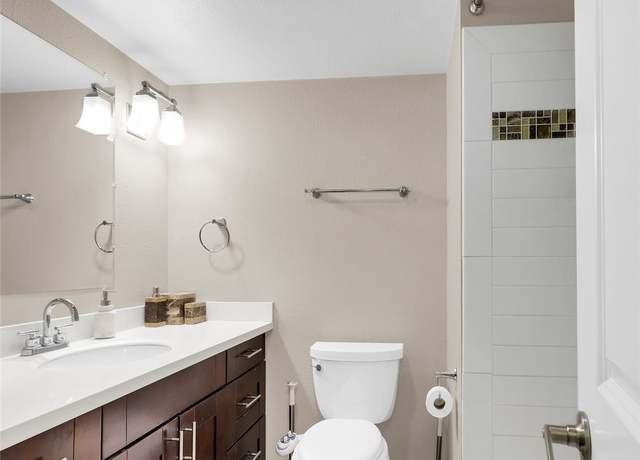
Garden, end unit condo in sought after Totem Lake community! Bright ground level, private, one bedroom condo that invites outdoors in! Relax on fenced garden patio this summer or lounge by cozy fireplace during the fall! Condo features living room with 2 sets of sliders to patio & adjoins dining and kitchen area! Primary suite offers updated bath with newer double vanity and lots of closet space with walk in closet! Entertain in the kitchen open to the dining and living room! Sprawl on to the patio on summer evenings. Stainless steel appliances & newer washer/dryer stay. Close by carport parking with storage unit. Community offers outdoor pool & hot tub. Embrace the fun an
1/19
$399,000
1 bed1 bath741 sq ft
11508 NE 128th St #14, Kirkland, WA 98034
Listing provided by NWMLS as Distributed by MLS Grid
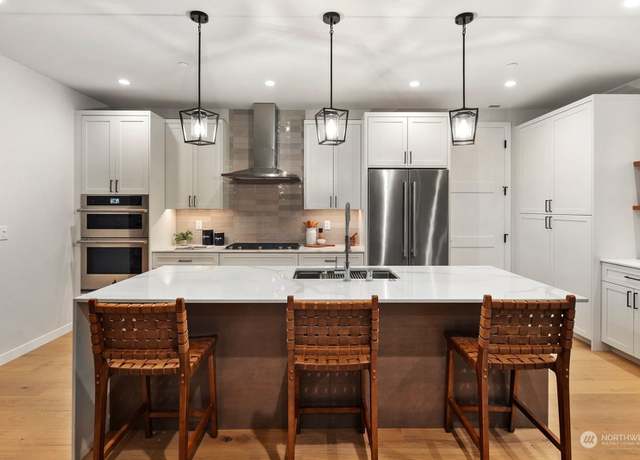
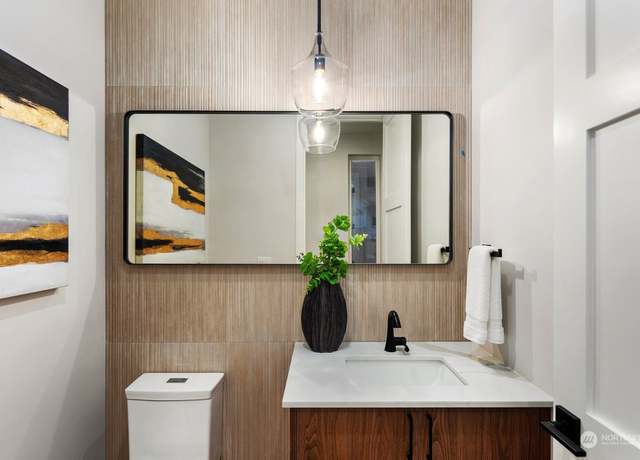
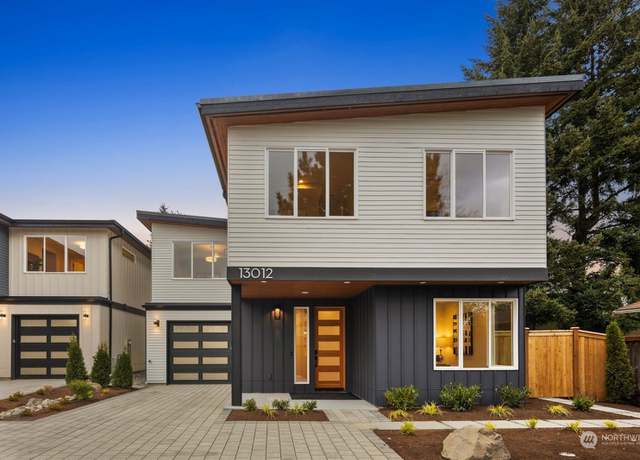
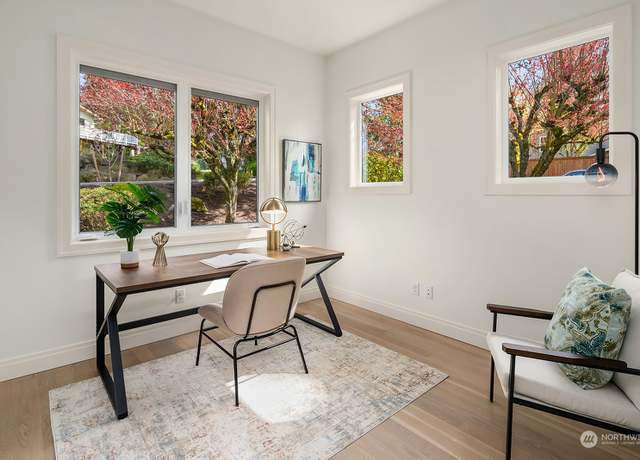
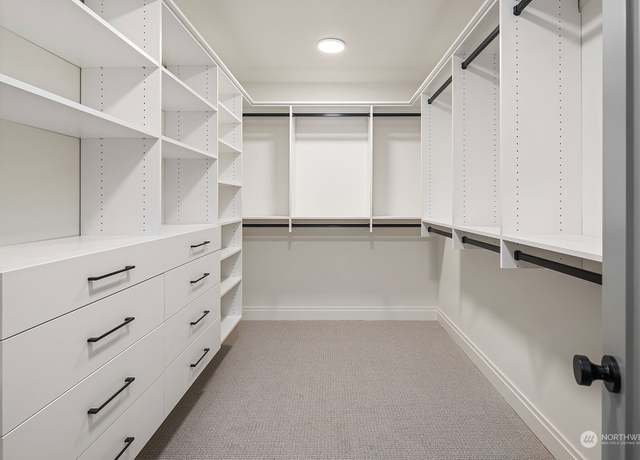
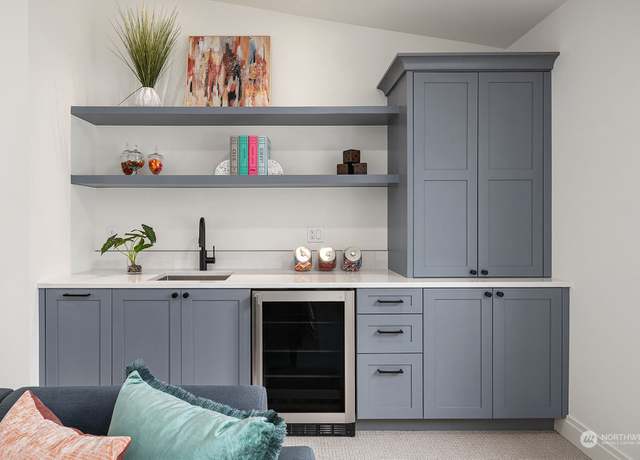
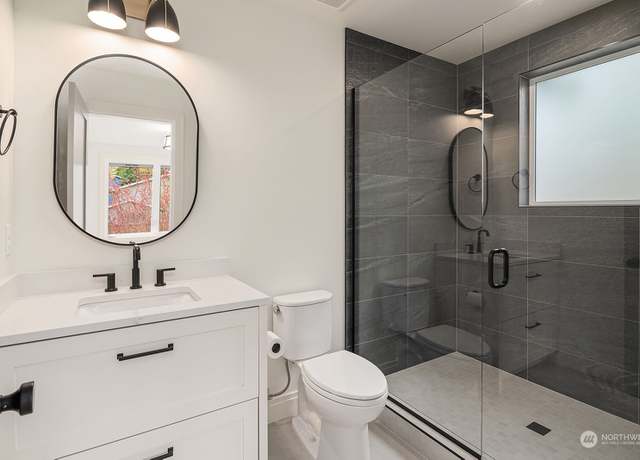
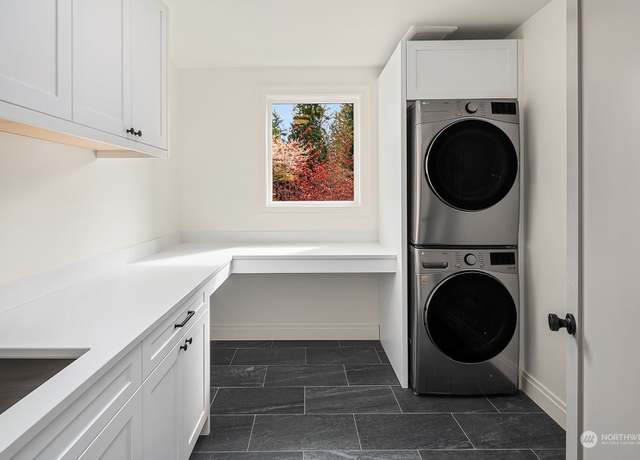
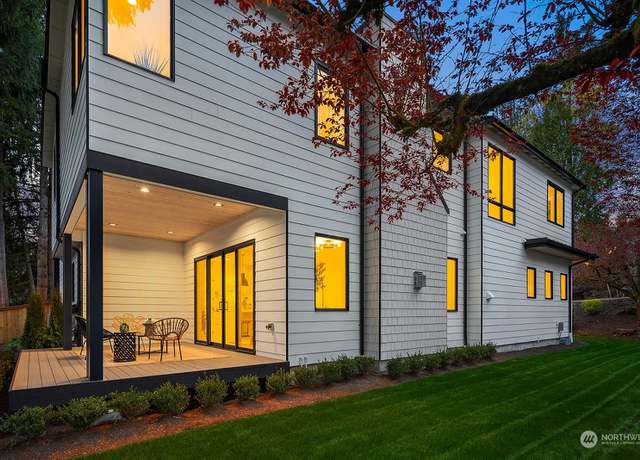
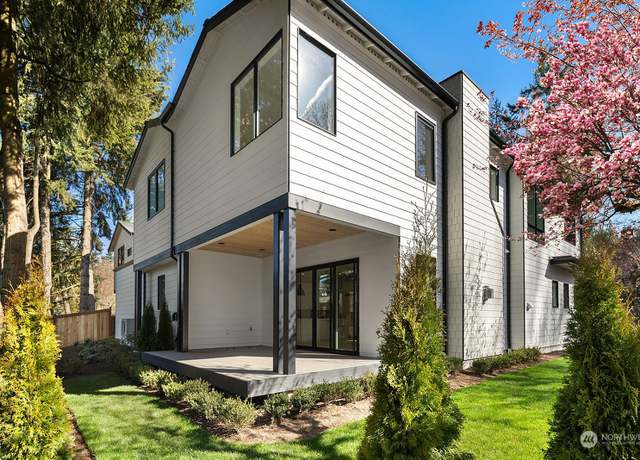
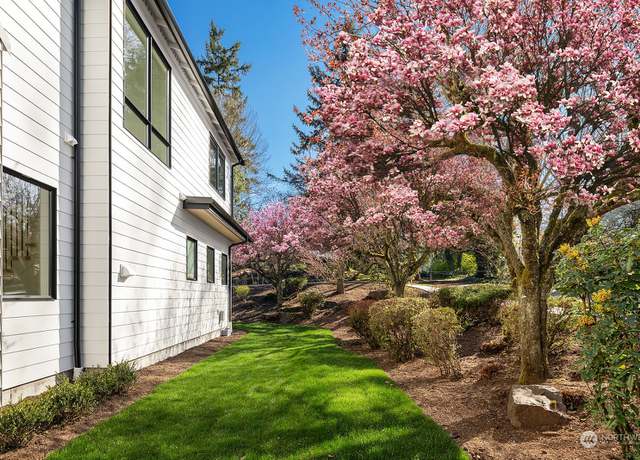
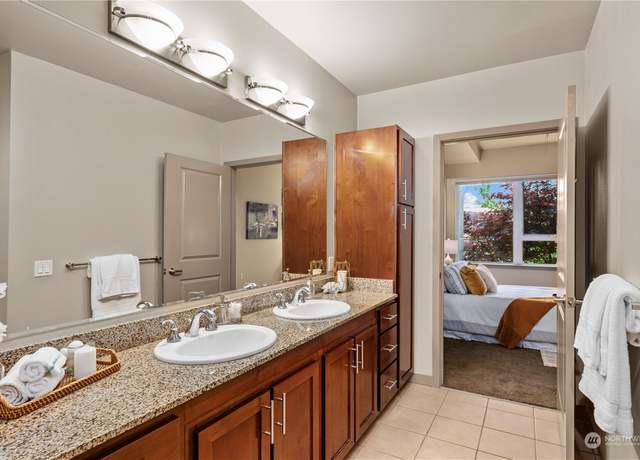
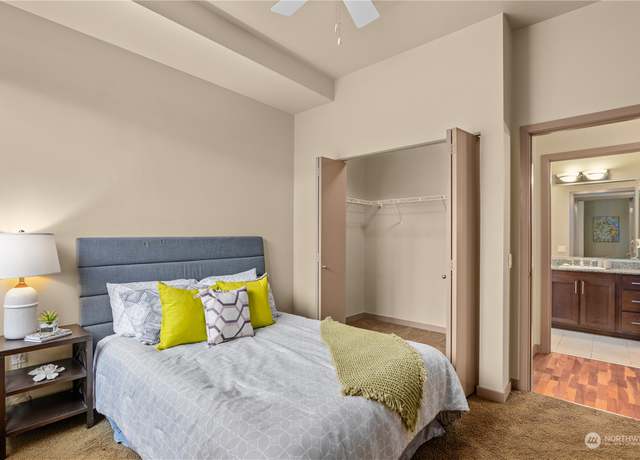
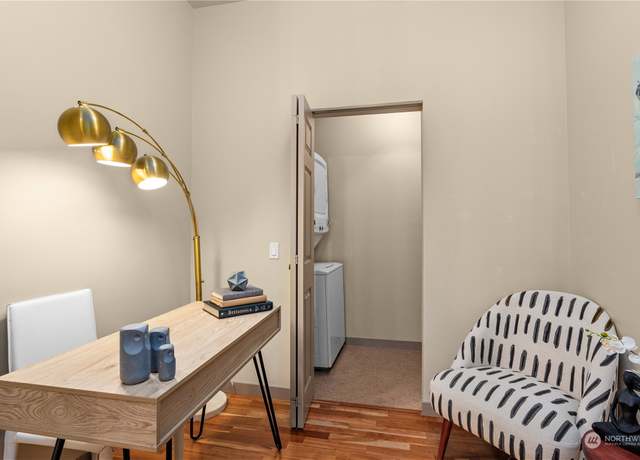
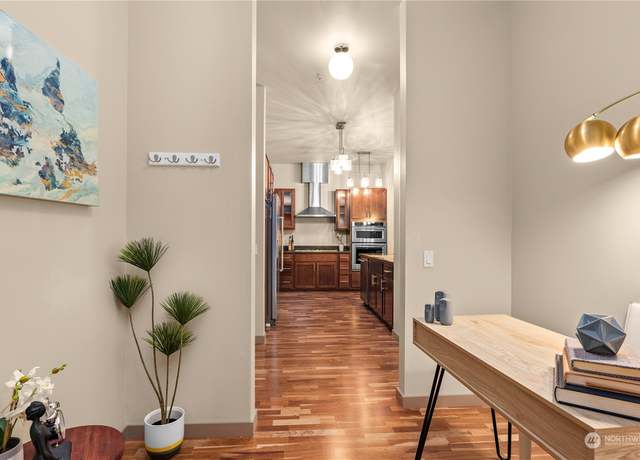
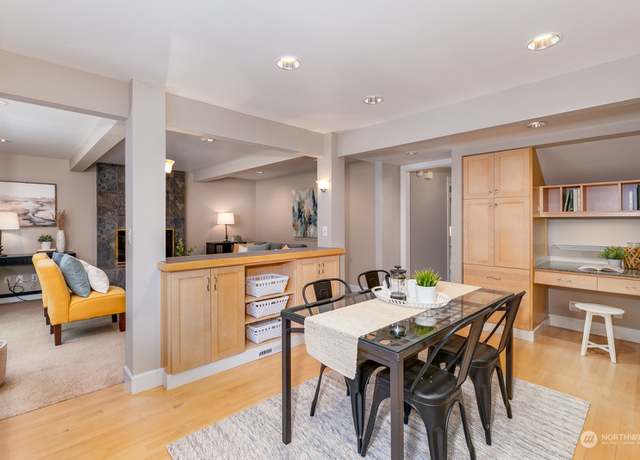
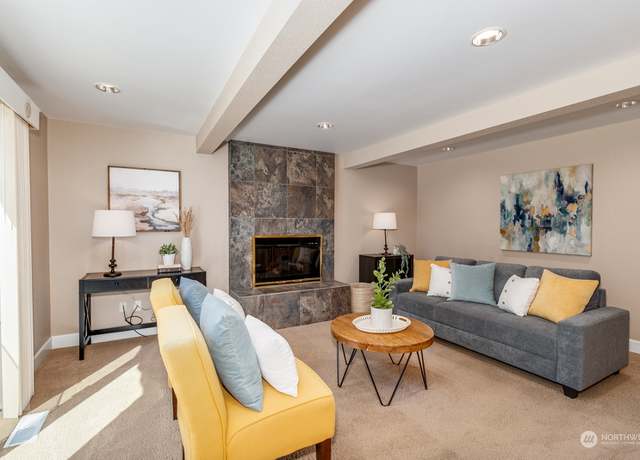
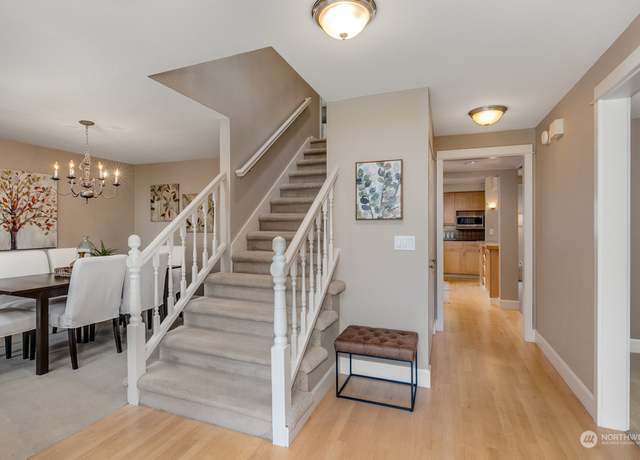
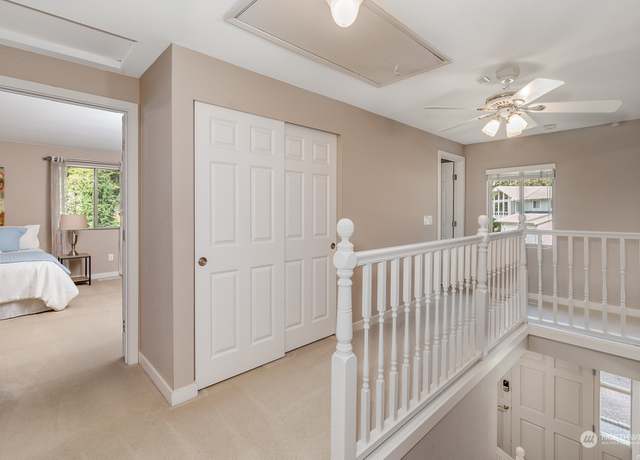
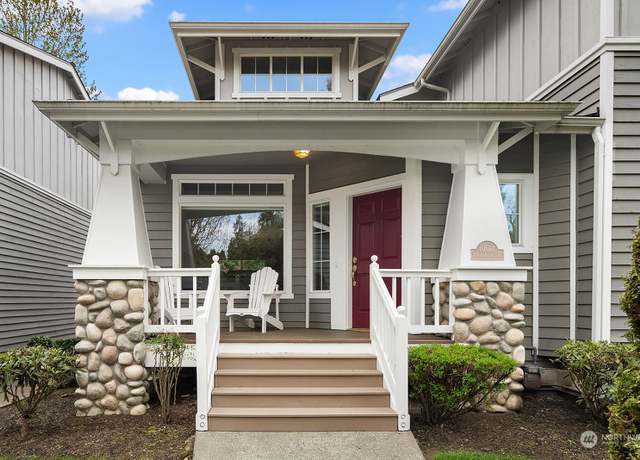
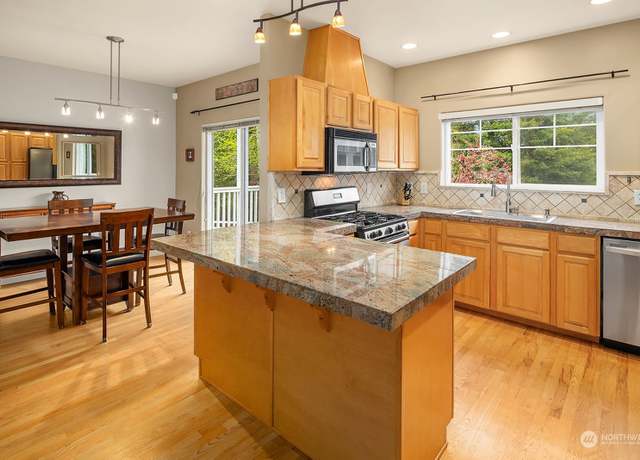
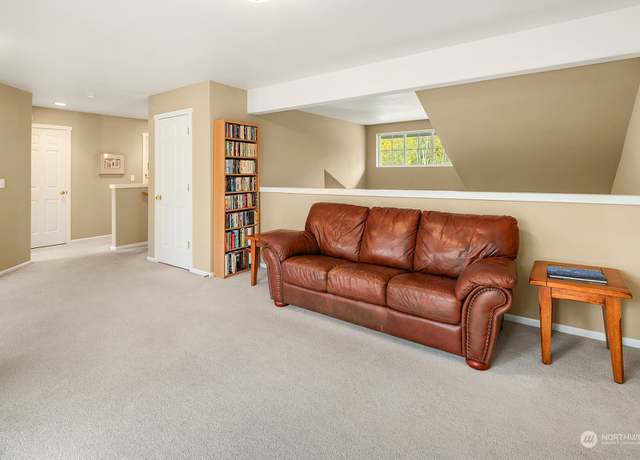
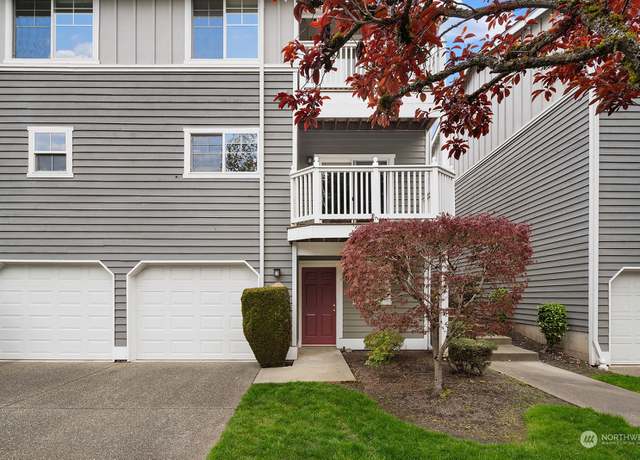
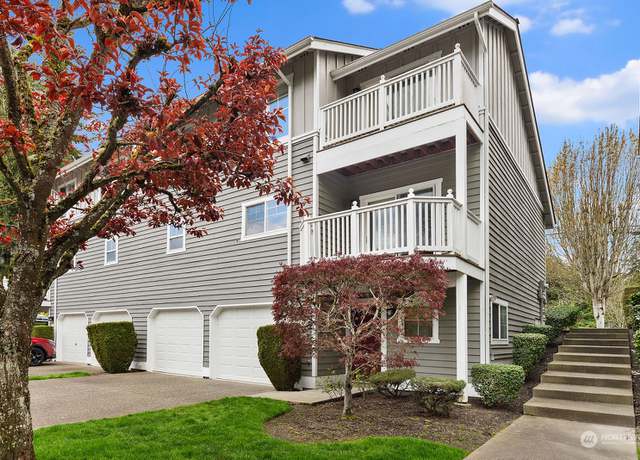
Meticulously crafted by Seattle Custom Contractors, this elegant four-home community is opposite an amazing new park and only minutes away from Kirkland’s dining, shopping, and Woodinville's renowned wineries. Meticulously designed for privacy, this home boasts an open floor plan, high-end finishes, 9’ ceilings, chef's kitchen with top-tier appliances, oversized quartz island, and expansive windows and carefully designed privacy. Featuring 3 bedrooms, home office, bonus loft, 2.5 modern baths, a heated deck for year-round enjoyment, a private garage, and a fully fenced yard. Smart home features, tankless hot water, and state-of-the-art living. Every detail is thoughtfully crafte
1/35
$1,575,000
3 beds2.5 baths1,820 sq ft3,863 sq ft (lot)
13012 132nd Ave NE, Kirkland, WA 98034
Listing provided by NWMLS as Distributed by MLS Grid
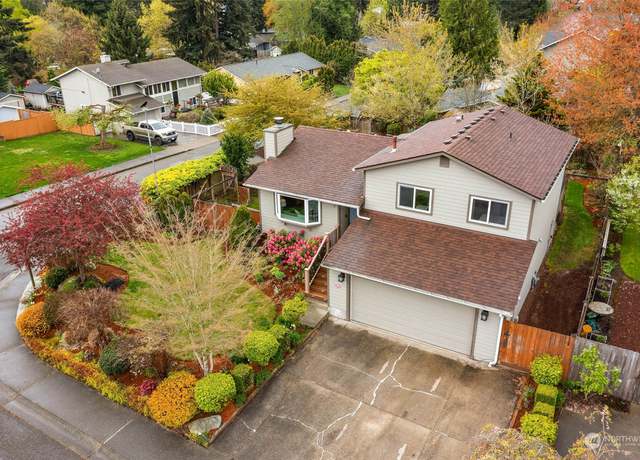
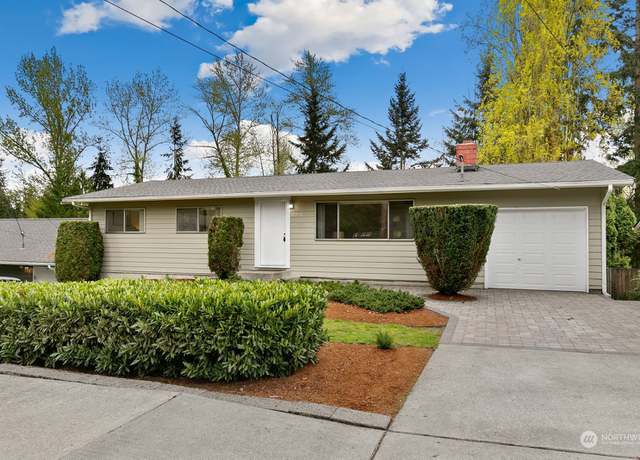
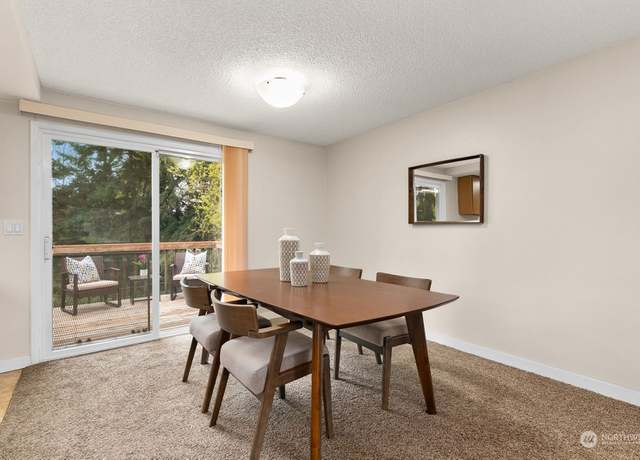
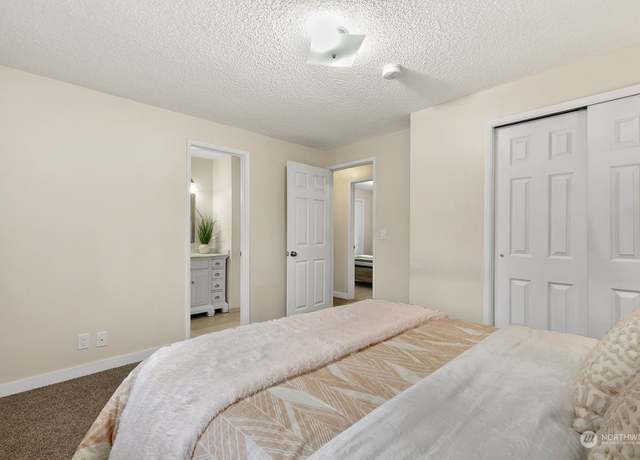
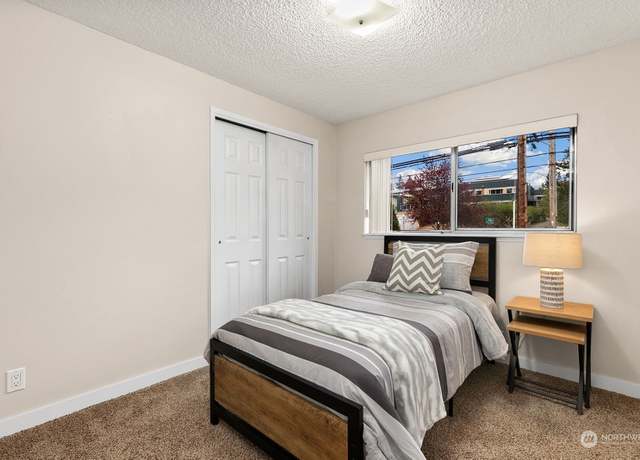
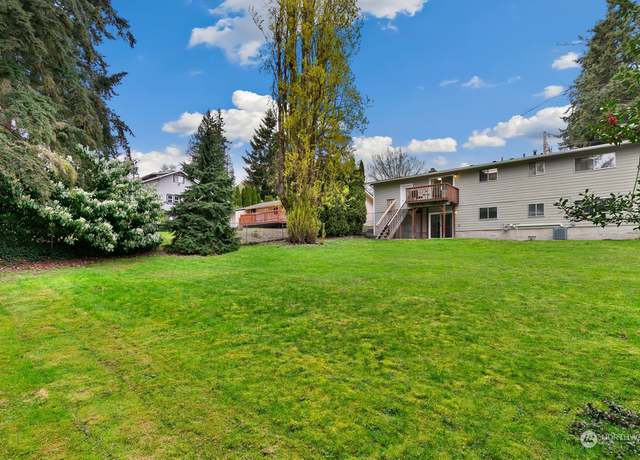
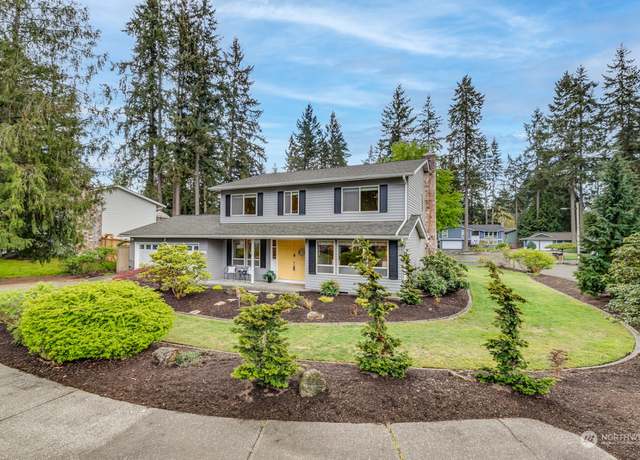
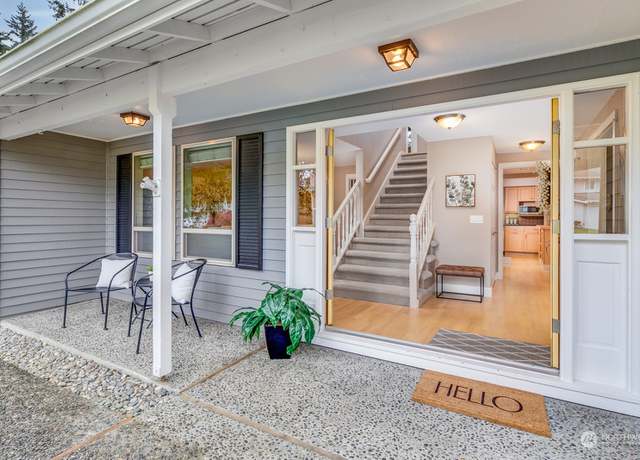
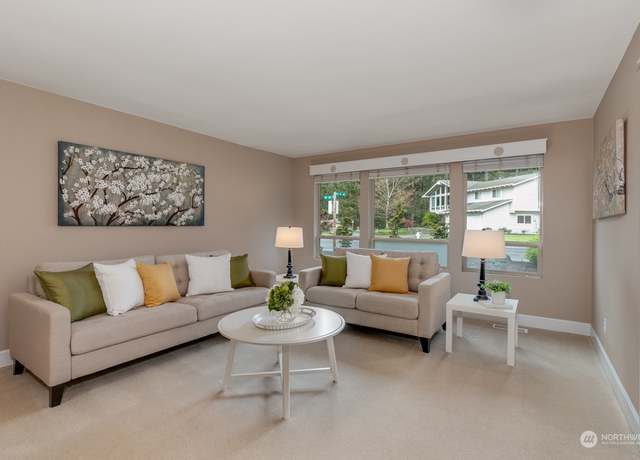
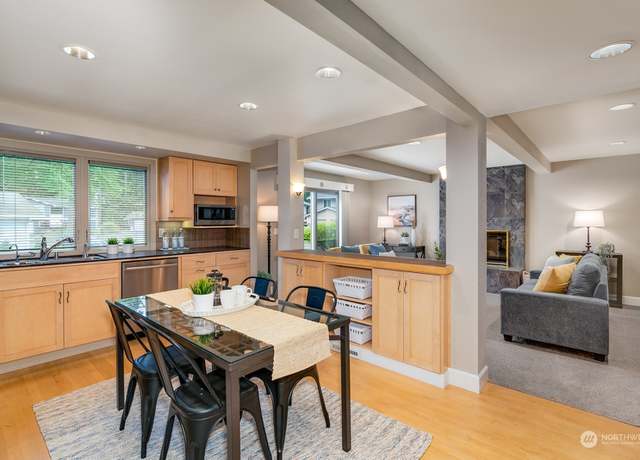
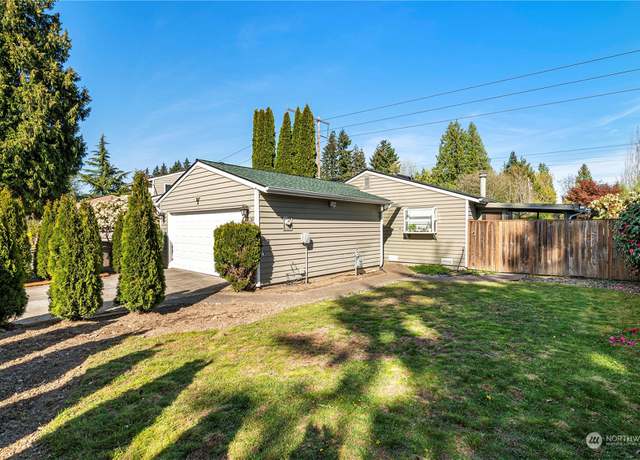
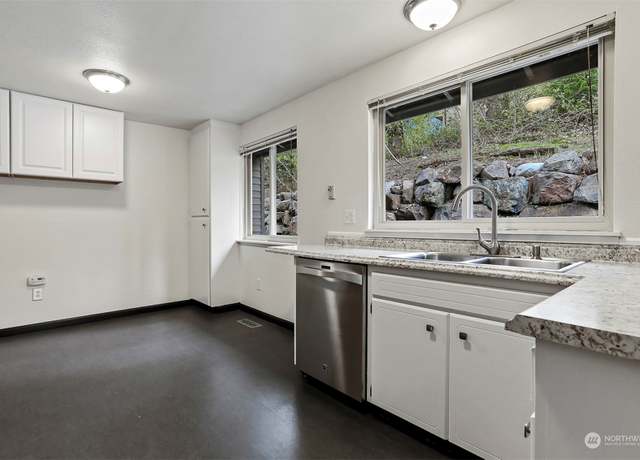
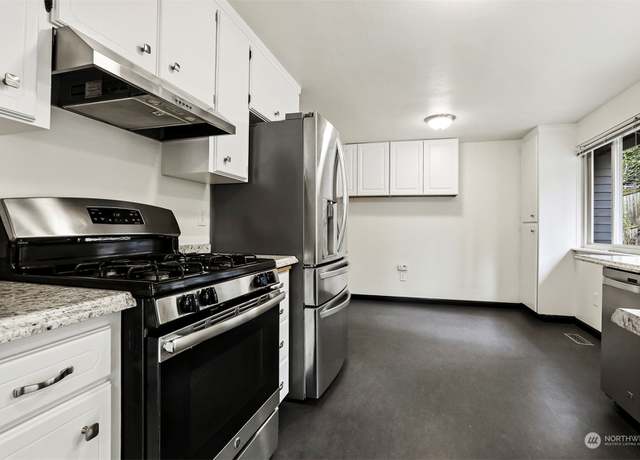
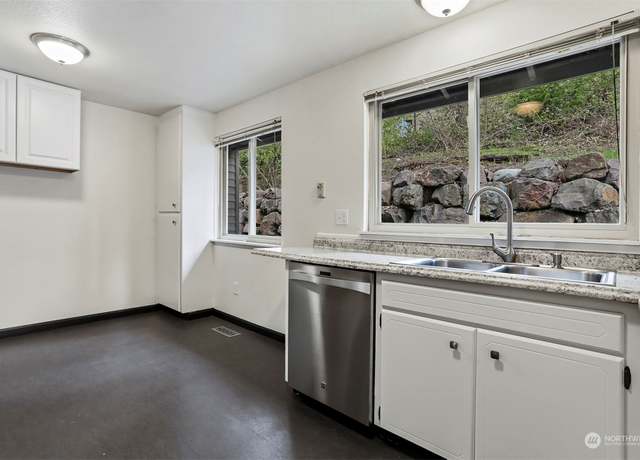
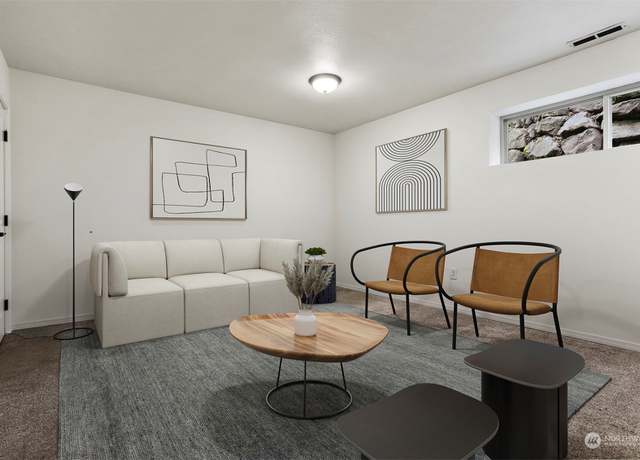
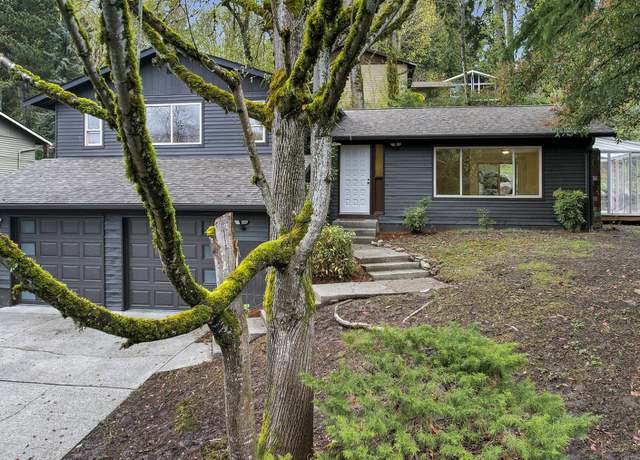
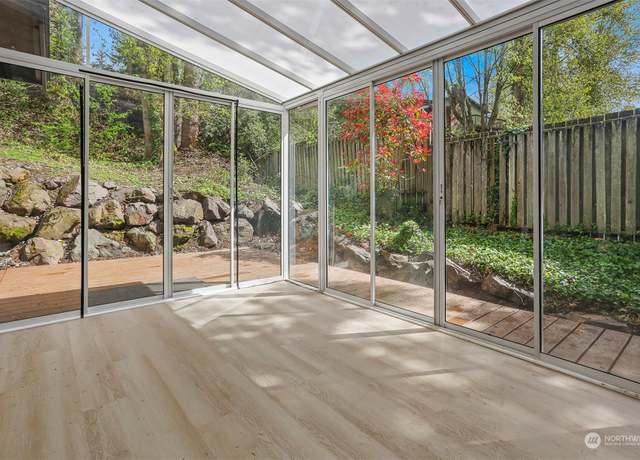
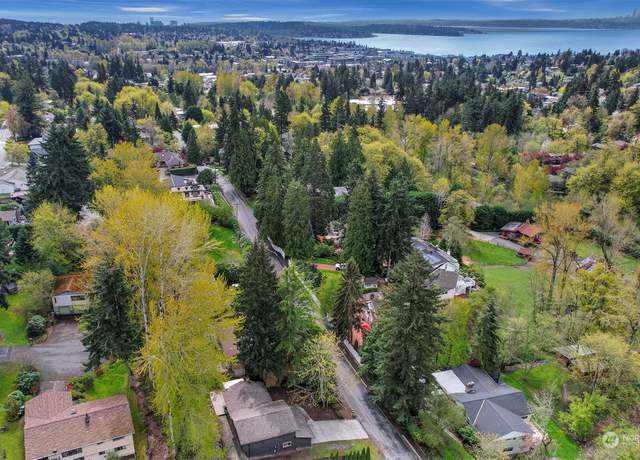
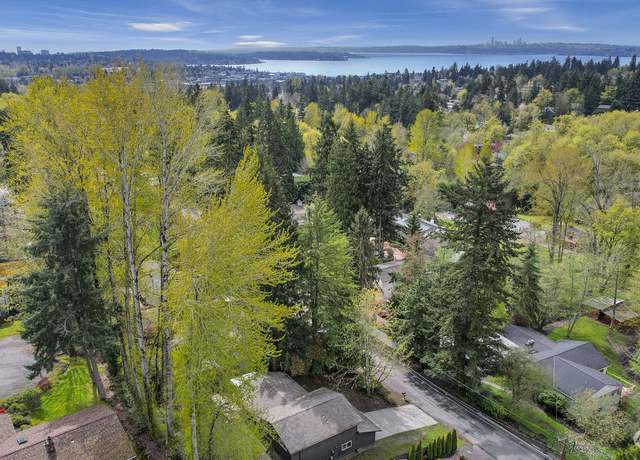
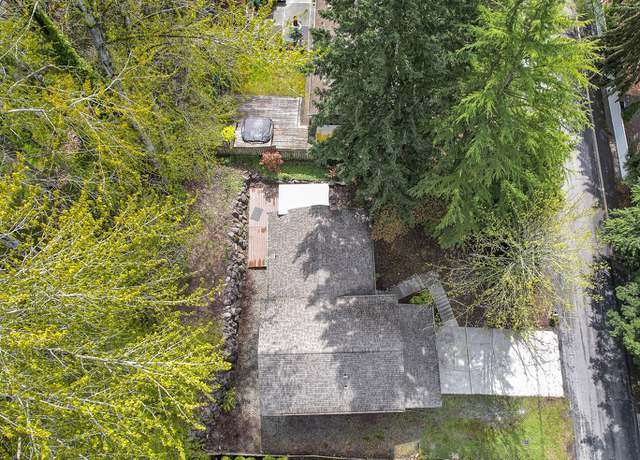
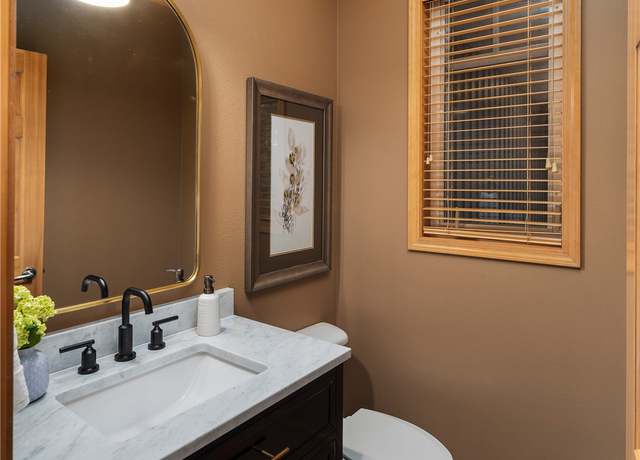
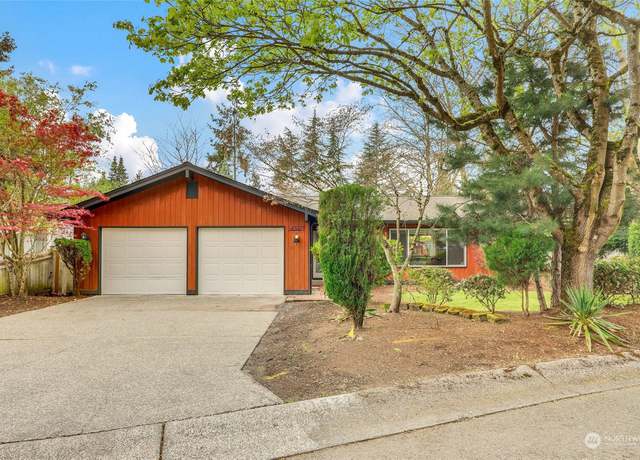
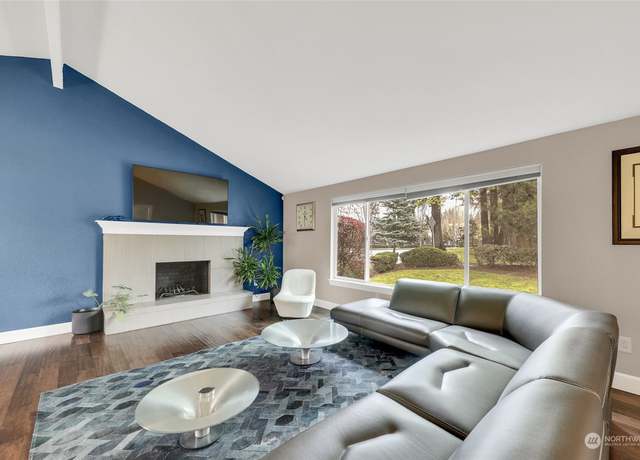
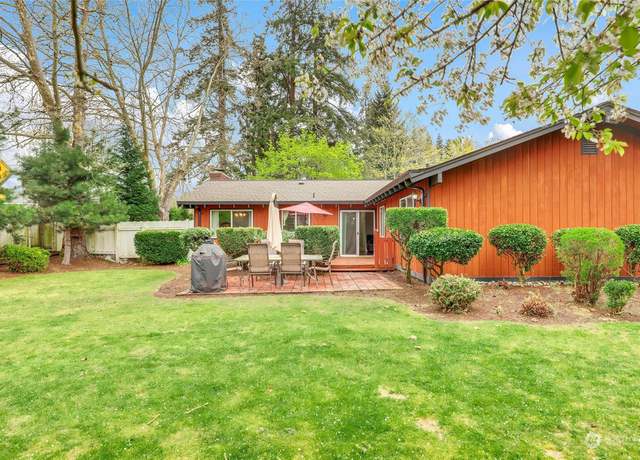
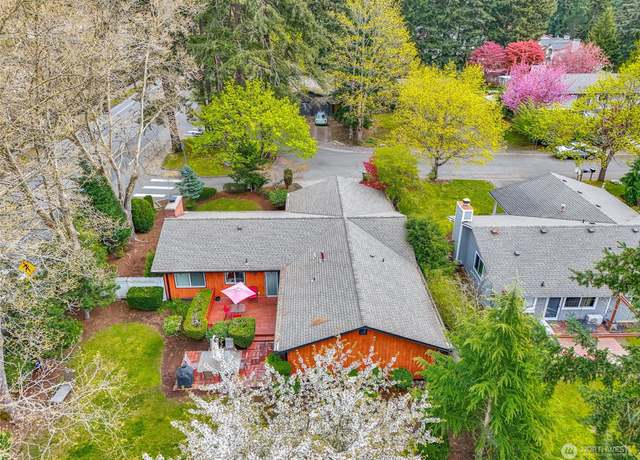
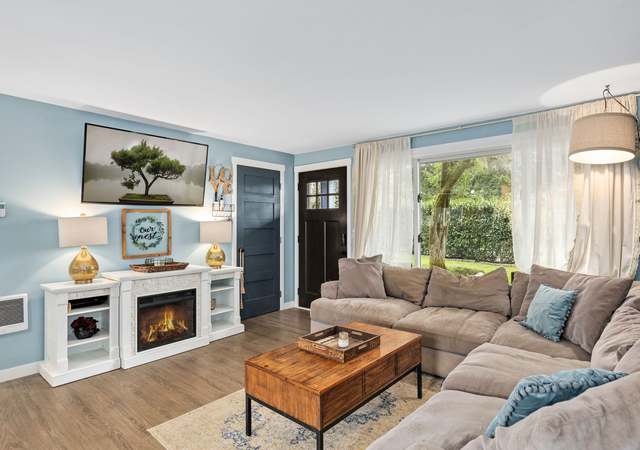
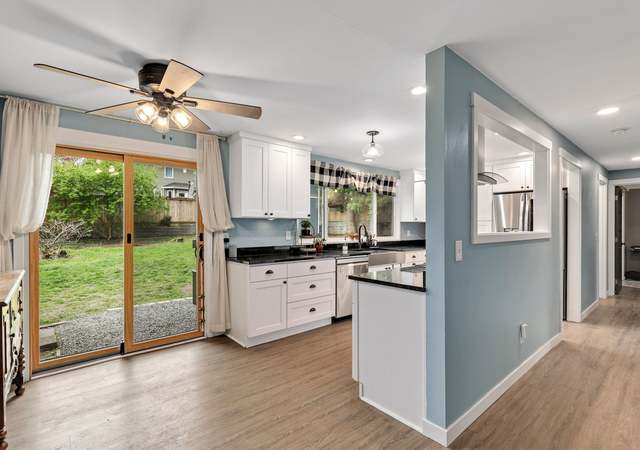
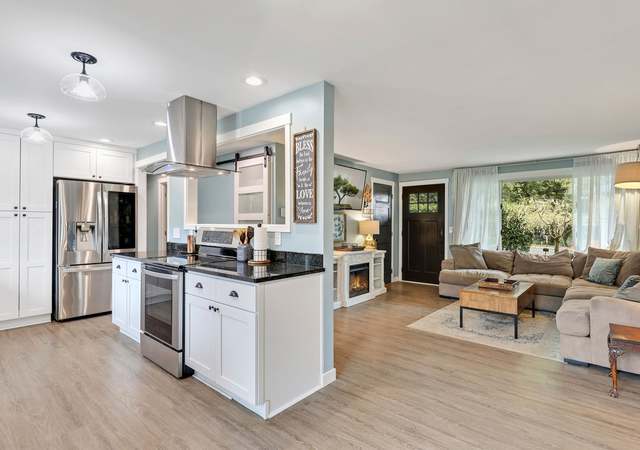
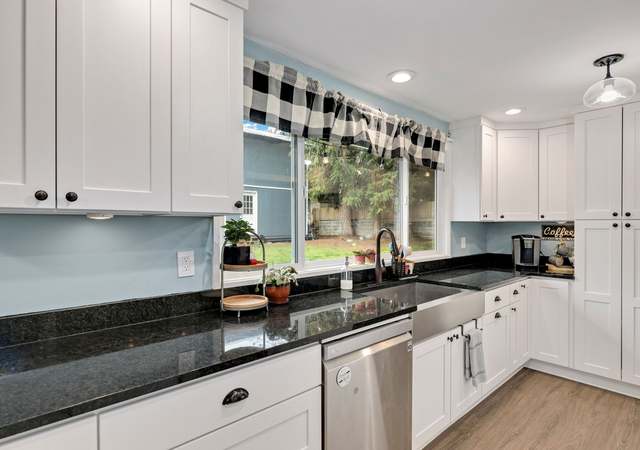
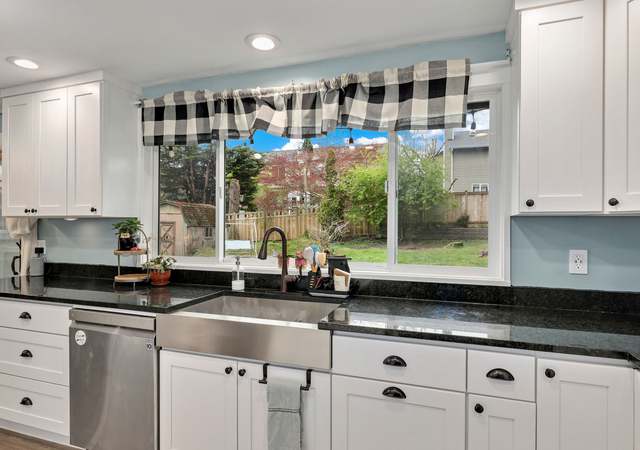
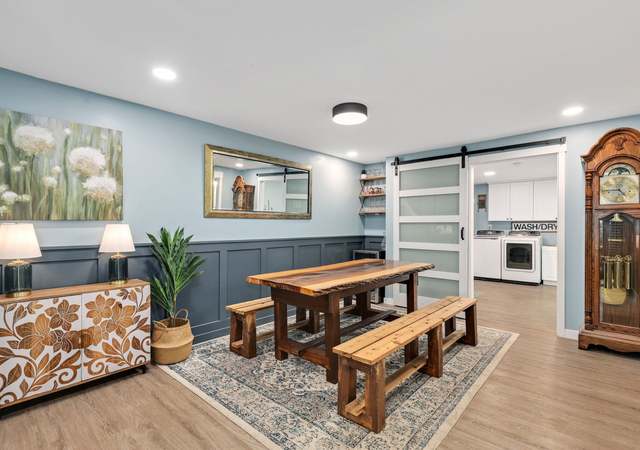
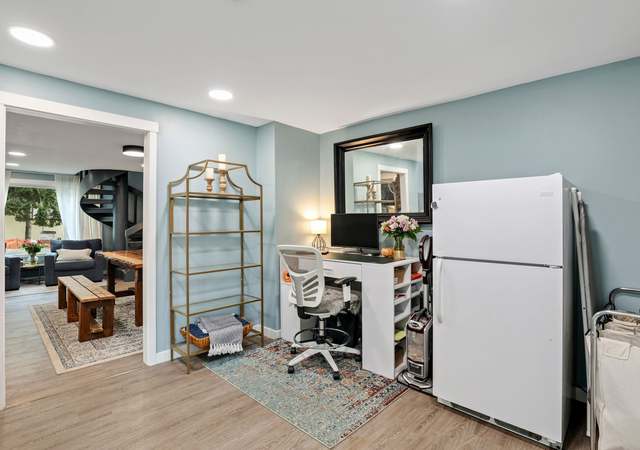
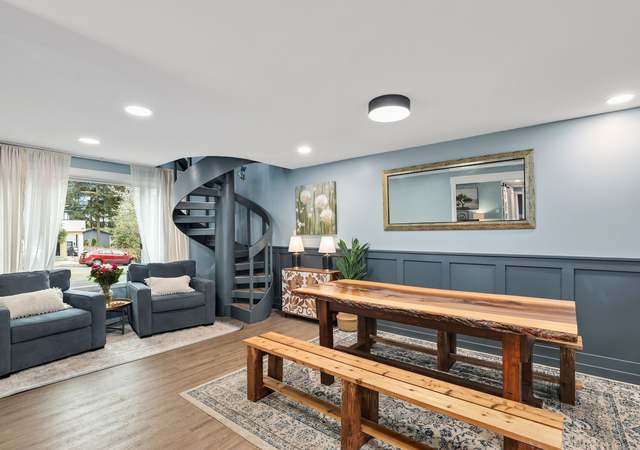
Welcome to this stunning fully remodeled home situated in the prime location of Kirkland. This property exudes elegance and practicality in its design. It features a state-of-the-art heated pool and an expansive outdoor patio, perfect for entertaining. The home, a single-level rambler, includes 4 bedrooms and 3 bathrooms. It has been recently updated with new flooring, paint, appliances, and much more. Additionally, it offers a large fenced yard and RV parking space. Permits are approved for a 1880sqft extension. Its central location provides easy access to the 405, bus routes, and the Eastside's premier shopping center, The Village at Totem Lake!
1/9
$1,600,000
4 beds2.5 baths1,697 sq ft0.26 acre (lot)
12803 111th Ave NE, Kirkland, WA 98034
Listing provided by NWMLS as Distributed by MLS Grid
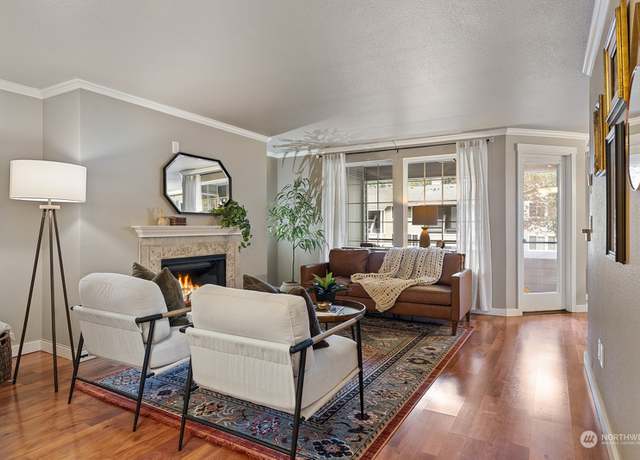
Live minutes to all that Kirkland has to offer! Remodeled 2BD 1BA condo featuring wood burning fireplace, private patio, storage, and covered parking! In-unit Washer and Dryer. Community features pool, hot tub, clubhouse, & gym. Close to Downtown and Kirkland Urban with shopping and dining galore! Enjoy waterfront lake activities like paddle boarding, kayaking, and boating. Take a stroll along the adjacent Cross Kirkland Corridor Trail. Near Google, 405, 520, Downtown Bellevue, Microsoft, Facebook, & more!
1/27
$520,000
2 beds1 bath824 sq ft
224 9th St Unit G-203, Kirkland, WA 98033
Listing provided by NWMLS as Distributed by MLS Grid
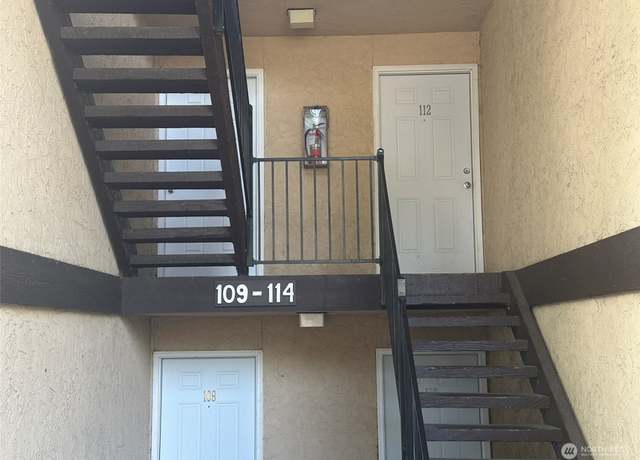
Nestled in the heart of Kingsgate Ridge, offering convenient proximity to hospitals and tech hubs, this 2 bed, 1 bath condo is ready for your touches. Enjoy easy access to amenities including shopping, dining, & entertainment just moments away. The living room & dining area provide an inviting space for relaxation and entertaining. This functional floor plan offers exceptional value, complete with a laundry washer/dryer combo conveniently located in the bathroom, enclosed storage on the balcony. This unit includes one assigned parking spot w/ ample guest parking available. Experience the perfect blend of comfort and convenience in this desirable home.
1/9
$299,000
2 beds1 bath845 sq ft
12525 NE 145th Pl Unit F112, Kirkland, WA 98034
Listing provided by NWMLS as Distributed by MLS Grid
Immerse in luxury living at its finest with this immaculately maintained residence, steps from Juanita Bay, Beach Park, and Juanita Village. Crafted by Cedarbrook Homes, this NW contemporary masterpiece offers 4,550 sq ft of living space. Vaulted ceilings, office, chef's kitchen, butler's pantry, skylights, AC, 4 fireplaces. Recent upgrades: new roof, paint. Enjoy cherry/blueberry trees, tea house/kids play deck—a serene oasis. Don't miss this dream home opportunity! Inspection report is availalbe.
1/40
$2,790,000
5 beds3.5 baths4,550 sq ft0.25 acre (lot)
10917 101st Pl NE, Kirkland, WA 98033
Listing provided by NWMLS as Distributed by MLS Grid
Stunning updated Kirkland townhome located steps away from the Cross-Kirkland Corridor & Google, & just a short distance to the core of Downtown Kirkland shops/restaurants. Beautiful setting in a well-maintained community! This stand-alone townhome features an oversized two-car garage (possibly 3), & a great room style floor plan perfect for entertaining! Updated w/ refinished oak hardwood floors, paint, quartz counters, new bathrooms, doors, lighting, & more. Gourmet kitchen w/ large island, pantry & updated appliances. The living room features great SW exposure with an additional fireside nook for relaxing. Decks on both levels for enjoying what the PNW offers!
1/36
$1,545,000
3 beds2.5 baths1,776 sq ft
8628 112th Ln NE #9, Kirkland, WA 98033
Listing provided by NWMLS as Distributed by MLS Grid
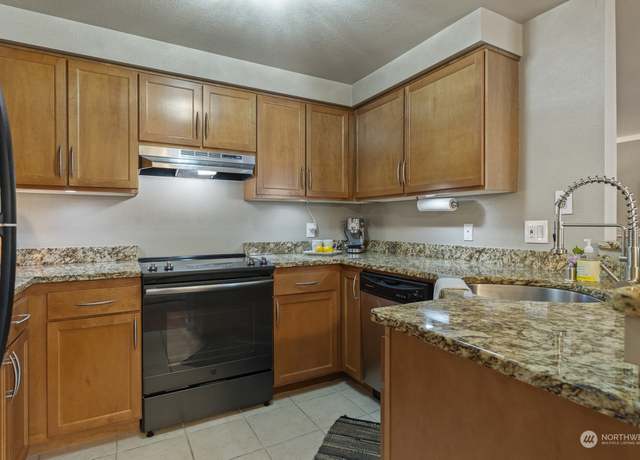
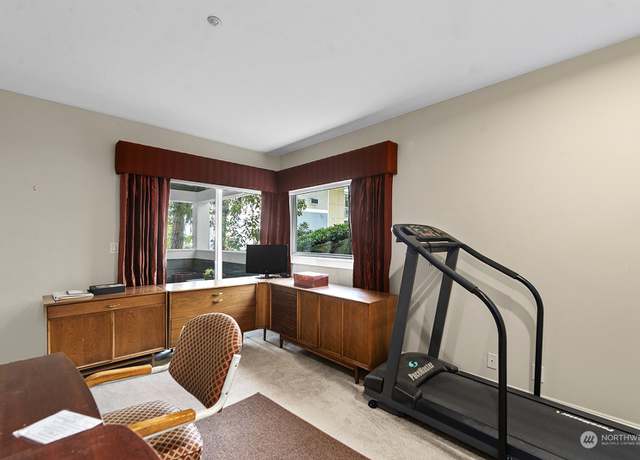
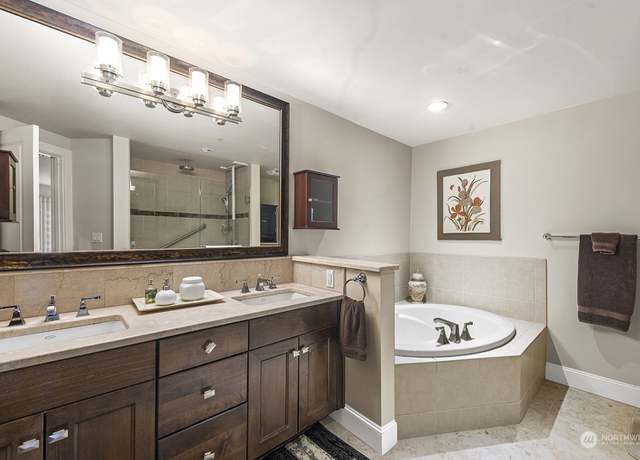
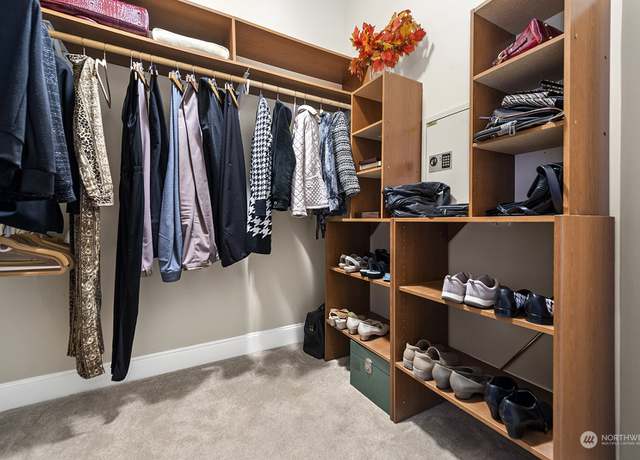
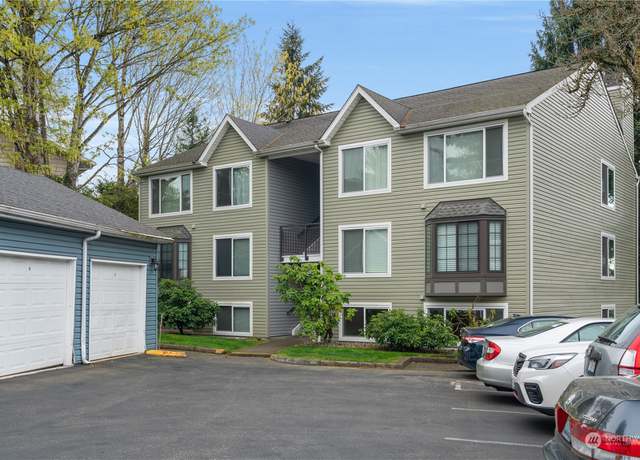
Immaculate condo in prime location. Close to Juanita Village, Juanita Beach and downtown Kirkland. Open floor plan maximizes space and functionality. Oversized windows throughout. Dining area comfortably seats 6 for entertaining. Living room features cozy wood-burning fireplace. Well-appointed kitchen has stainless appliances, ample storage, and granite counters. Spacious primary bedroom with custom designed wood closet system. Covered deck has additional storage. Relax at the outdoor pool, hot tub or clubhouse. Explore Kirkland's lively downtown scene with charming boutiques, gourmet restaurants, and beautiful waterfront. Assigned covered parking. Minutes to 405 & Village at Totem La
1/40
$408,000
1 bed1 bath832 sq ft
10009 NE 120th Ln Unit B202, Kirkland, WA 98034
Listing provided by NWMLS as Distributed by MLS Grid
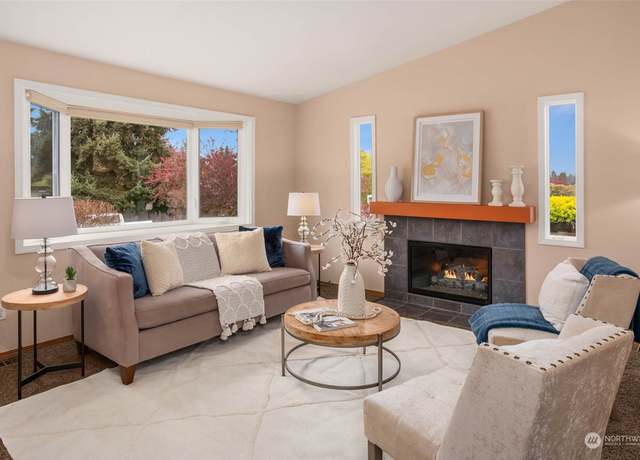
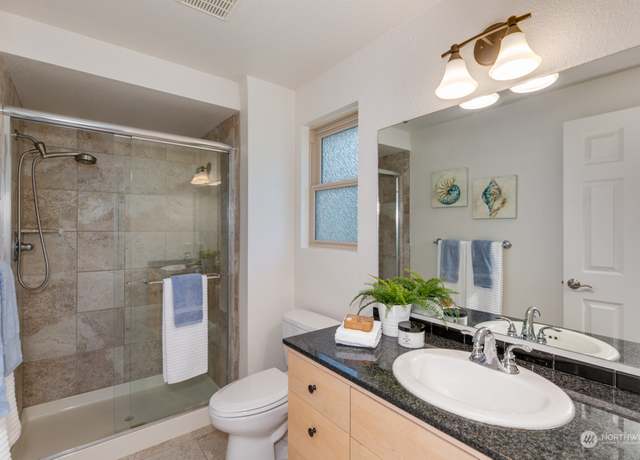
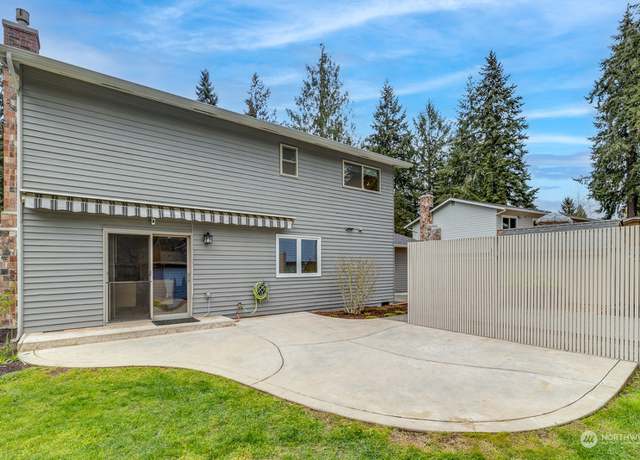
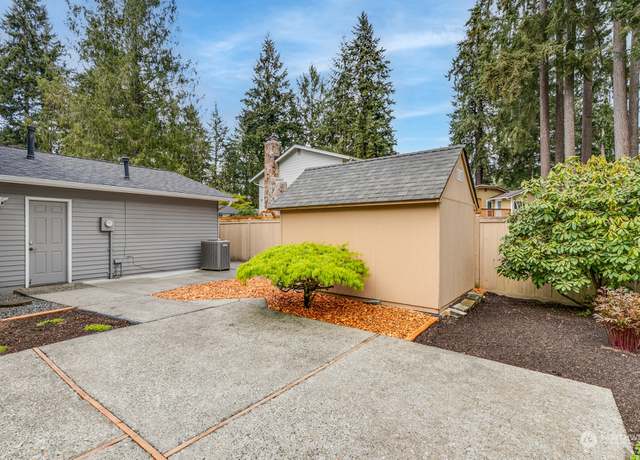
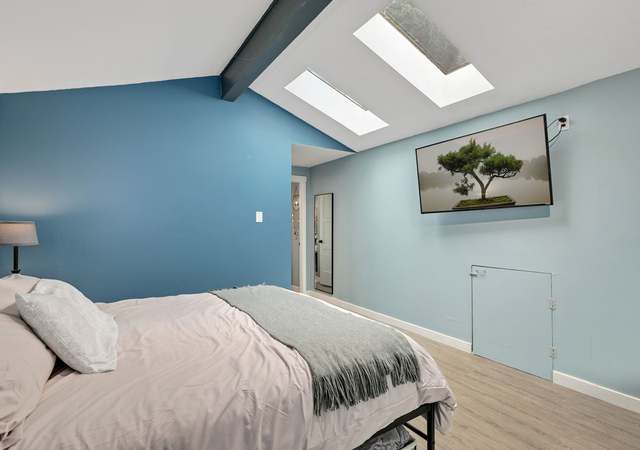
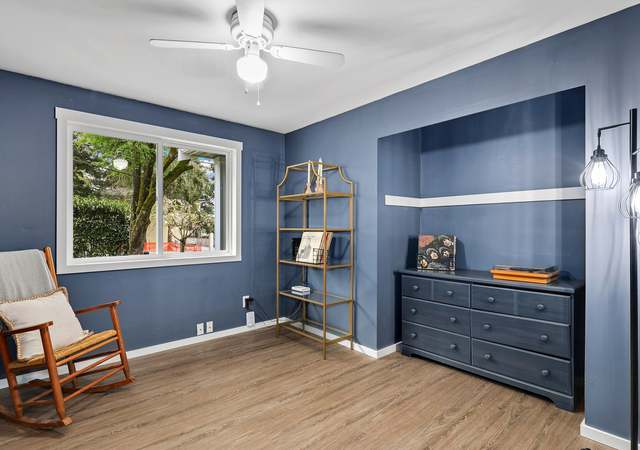
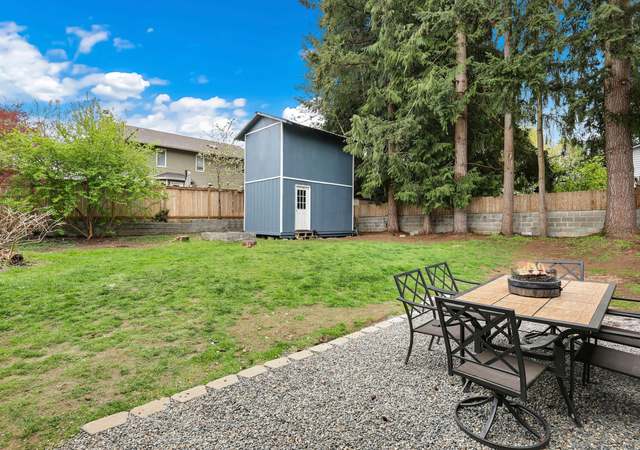
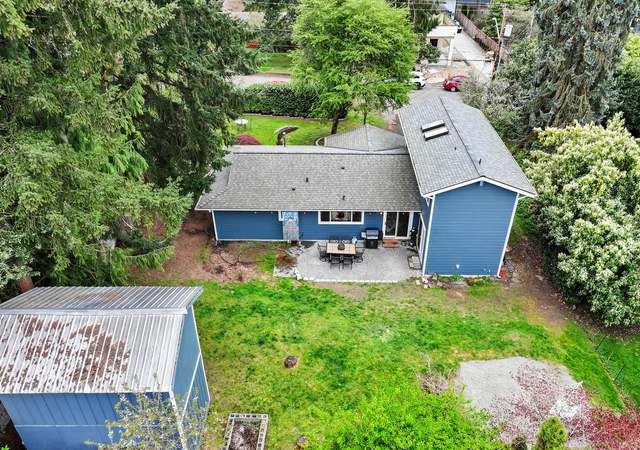
Welcome to the South Rose Hill Community, where this charming rambler awaits! You will love the perfect blend of impressive essentials & thoughtful updates through-out; as well as a refreshing color palette & abundant natural light. This home offers two separate living spaces, each complete w/ its own fireplace. French doors lead into an office/bedroom or retreat to either of the two bedrooms down the hall. The fully equipped kitchen features white quartz countertops, & SS appliances. Enjoy your outdoor living space w/ a storage shed, brand-new landscaping & electric car charger. Just minutes from the Kirkland waterfront, Bellevue Golf Course, & parks. Outstandin
1/32
$1,175,000
3 beds2 baths1,400 sq ft6,708 sq ft (lot)
7004 122nd Ave NE, Kirkland, WA 98033
Listing provided by NWMLS as Distributed by MLS Grid
Spectacular Custom View Home perched on a quiet street in coveted East of Market. Grand Entry w/ custom arched millwork. Sitting area w/ views of Lake+Mountains. (Could be office) Gracious Dining room. Gourmet kitchen w/ SST Appliances, Huge Island, Beverage Fridge, Built-in Refrigerator, Butlers Pantry. Great room w/ fireplace, Built-in Shelving. Kitchen opens to covered porch+yard+gardens. Primary has Views of Lake+Mt. Rainier+Olympic Mnts. 4 large bedrooms upstairs. Lower level has a bonus room w/ walk out (possible rental suite), an extra room w/ walk in closet (could be a 5th bed), full bath. flex room+huge storage room. Detached oversized 2 Car Garage w/ alley access: Approx, 550 sq.
1/29
$3,400,000
4 beds3.5 baths4,500 sq ft6,000 sq ft (lot)
124 13th Ave, Kirkland, WA 98033
Listing provided by NWMLS as Distributed by MLS Grid
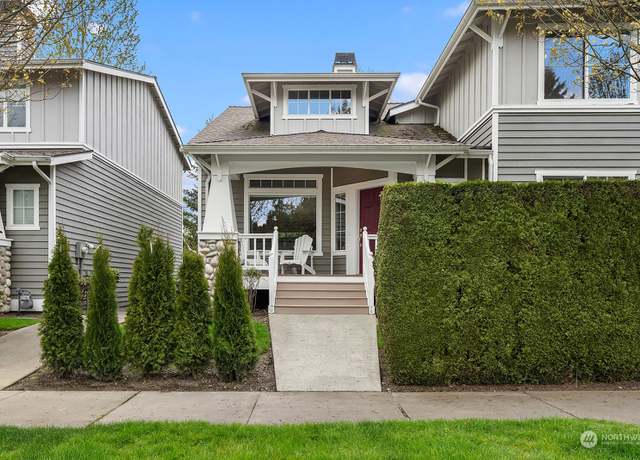
Centrally located in the Rose Hill neighborhood, this newly completed home built by local home builder, Steele Homes, features a bright and airy floor plan, designer finishes, and is set on a corner lot within walking distance to Rose Hill Elementary. With 4 bedrooms, office and bonus room, this home offers flexibility, comfort, and convenience. The light-filled great room boasts white oak hardwood floors and tall ceilings. The gourmet kitchen includes Fulgor Milano Italian designer appliances with a 6-burner gas range, pantry, and quartz countertops. Primary suite is filled with luxe amenities including a large wet room, 5-piece bath w heated floors, and WIC. Fully-fenced, level backyard w
1/32
$2,299,950
4 beds3.5 baths2,674 sq ft4,073 sq ft (lot)
12802 NE 83rd St, Kirkland, WA 98033
Listing provided by NWMLS as Distributed by MLS Grid
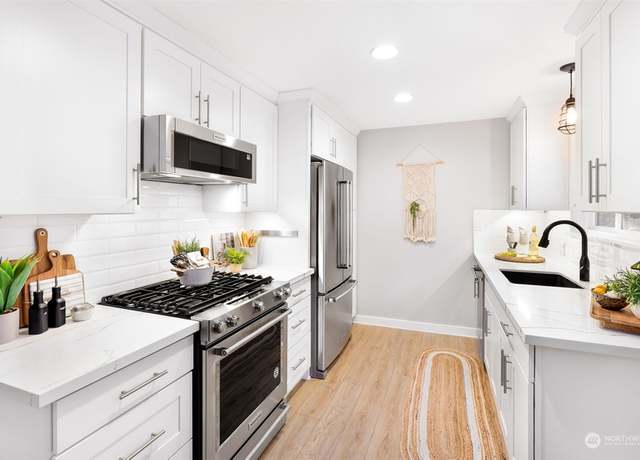
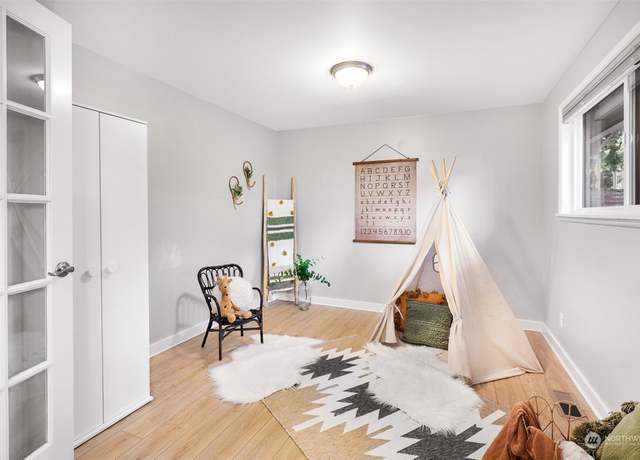
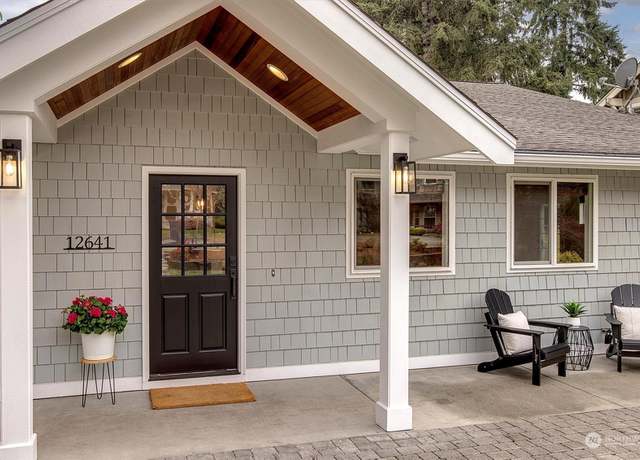
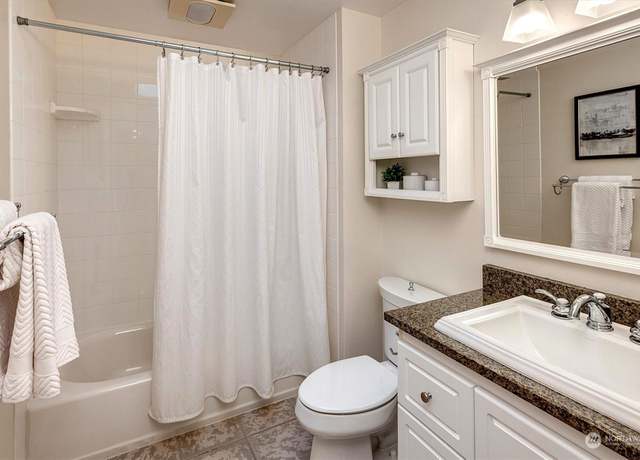
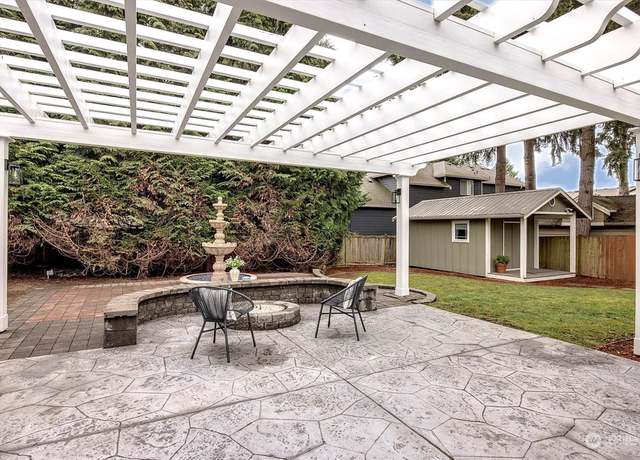
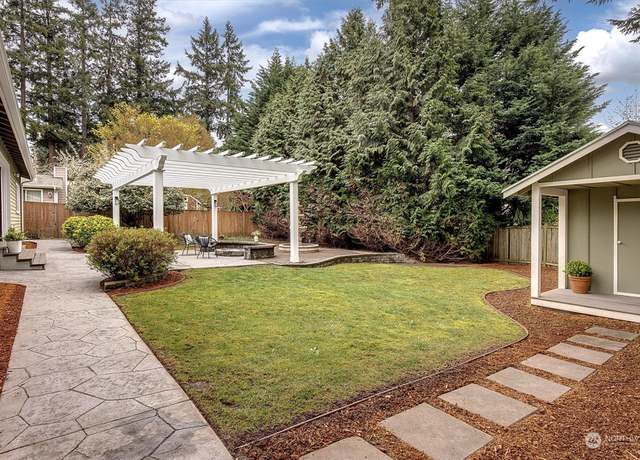
Chic + Stylish ranch style home nestled in North Rose Hill on an expansive lot! Year-round indoor/outdoor living w/ covered +enclosable deck to enjoy your morning coffee. Gorgeous pergola w/ patio +spacious yard +shed. Completely remodeled interiors include gorgeous chef's kitchen w/ modern cabinetry, brand new quartz, designer backsplash + fixtures. 2 living spaces including great room provide ideal places to relax and gather. Massive primary retreat w/ 5-piece spa inspired en suite, walk-in closet, vaulted ceilings + gas fp is truly a place to unwind. Additional features incl A/C, Sec System, hardwoods and new designer paint, carpet + lighting. Minutes to parks, dining, shopping, major em
1/28
$1,650,000
3 beds2 baths1,760 sq ft9,600 sq ft (lot)
12641 NE 104th St, Kirkland, WA 98033
Listing provided by NWMLS as Distributed by MLS Grid
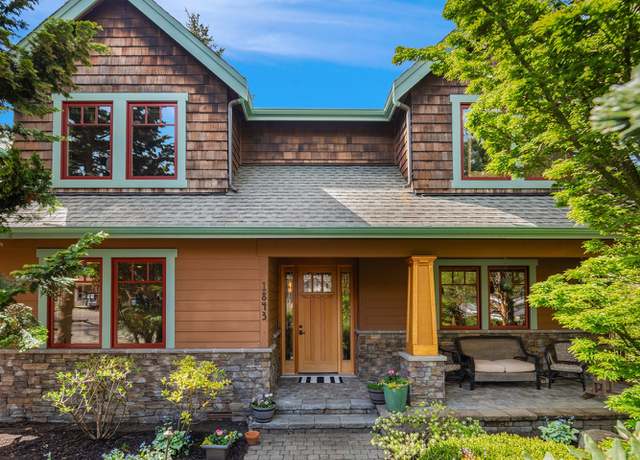
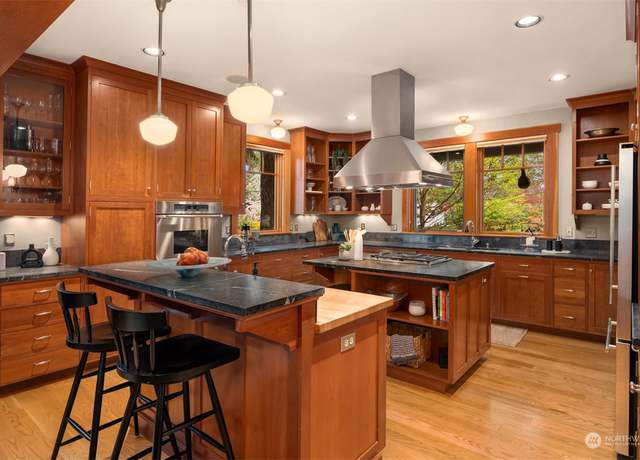
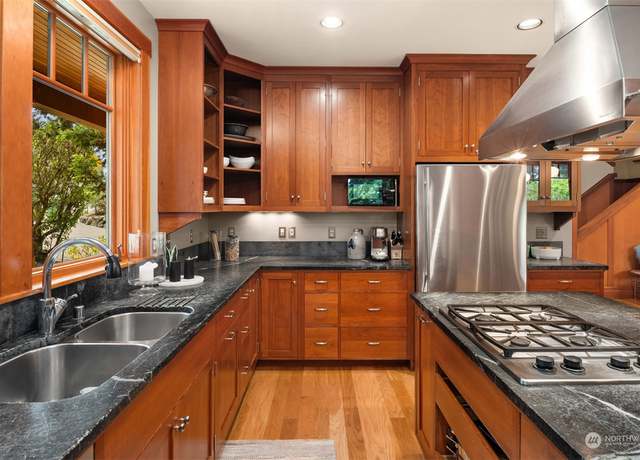
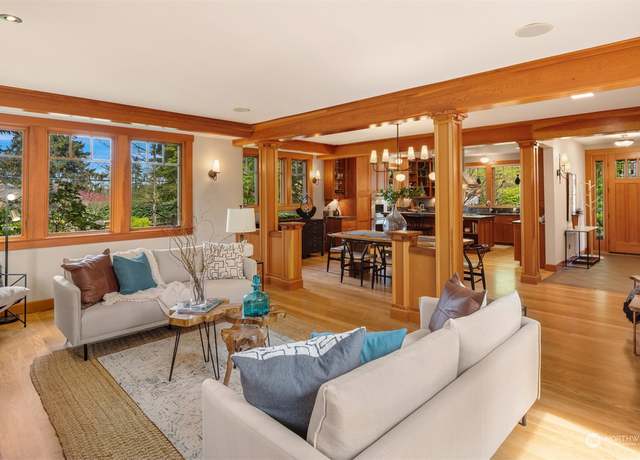
Exceptional custom residence nestled in the heart of the coveted Norkirk community. This signature property combines striking NW craftsman architecture w/ bespoke luxury finishes & unparalleled privacy. Inviting interior designed for entertaining offers sundrenched great rm w/ dedicated living & dining spaces, open concept epicurean kitchen, home office, bonus rm & breathtaking primary suite. Superior quality is evident throughout w/ handcrafted fir millwork, wide plank white oak hardwoods & extensive use of natural solid surface stone. Located in one of the premier communities on the eastside, this idyllic home provides unrivaled access to popular area parks, both D
1/40
$2,800,000
4 beds2.5 baths3,360 sq ft7,680 sq ft (lot)
1843 3rd St, Kirkland, WA 98033
Listing provided by NWMLS as Distributed by MLS Grid
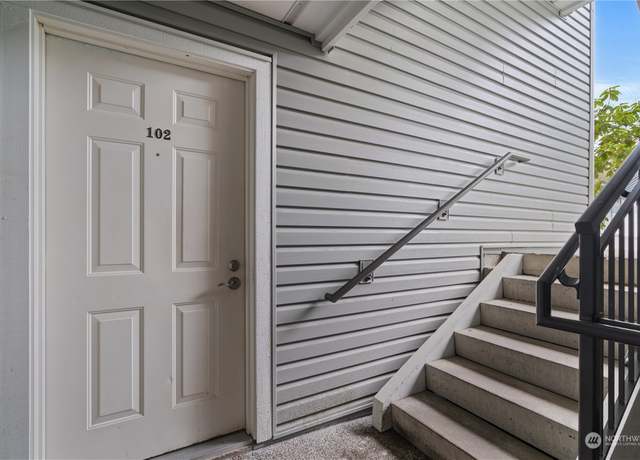
This two-bedroom condo has all the essentials! Private/fenced yard, covered patio, walk-in closet and open concept kitchen, it offers both comfort and convenience. Nestled in the heart of Kirkland, enjoy the tranquility without sacrificing proximity to amenities. Coveted Lake Washington School District, no rental cap and pet-friendly, it's an excellent investment opportunity or starter home. Don't miss out on this perfect blend of location, features, and potential.
1/36
$460,000
2 beds1 bath833 sq ft
8240 126th Ave NE Unit A102, Kirkland, WA 98033
Listing provided by NWMLS as Distributed by MLS Grid
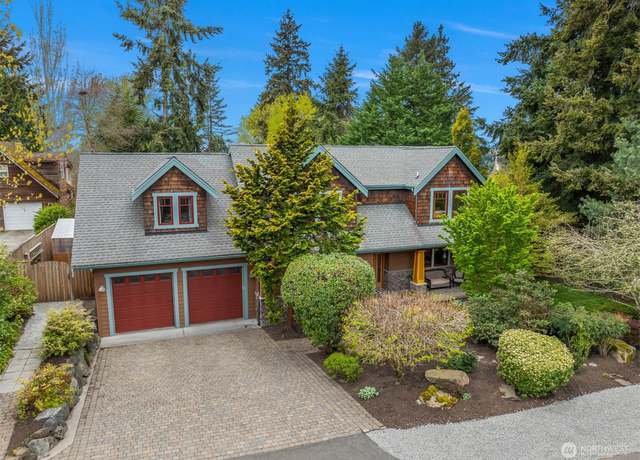
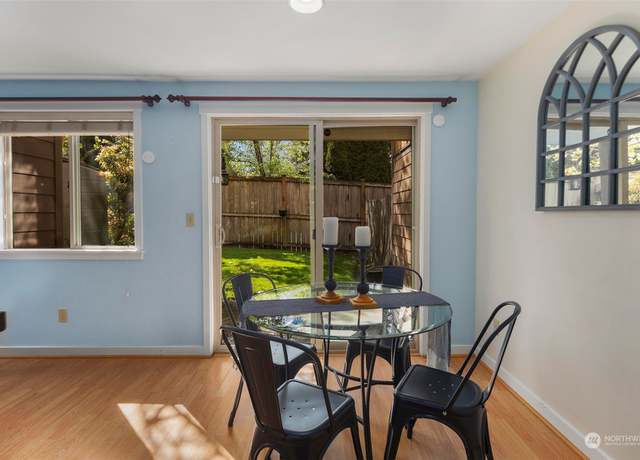
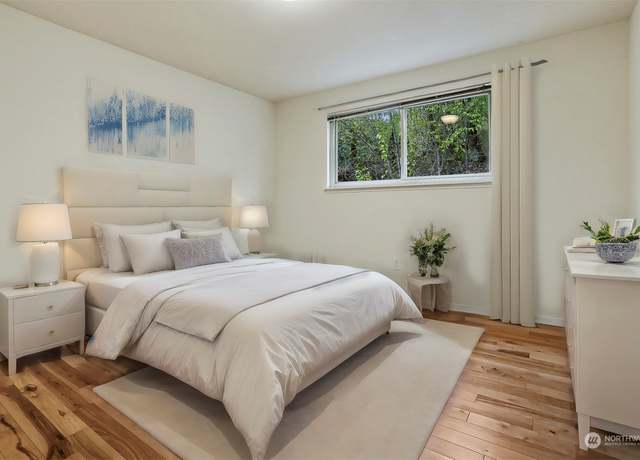
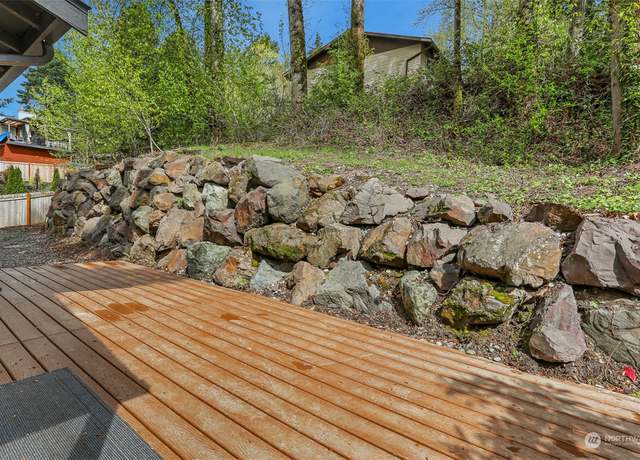
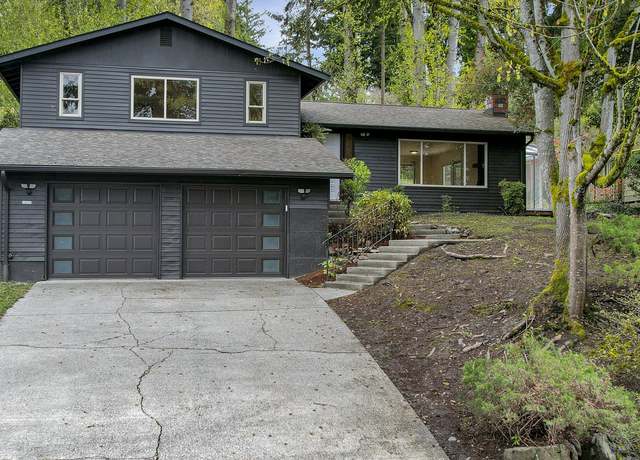
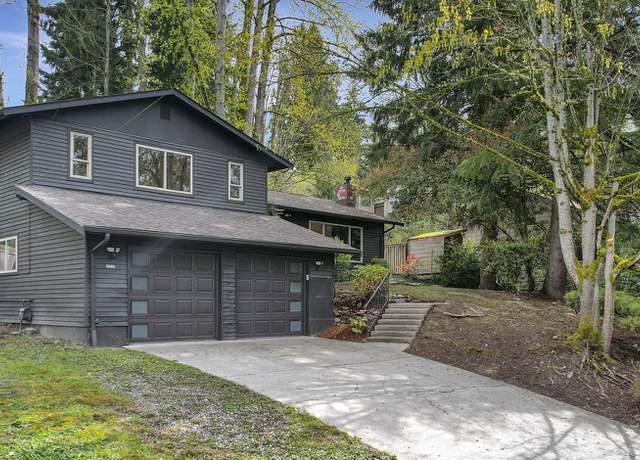
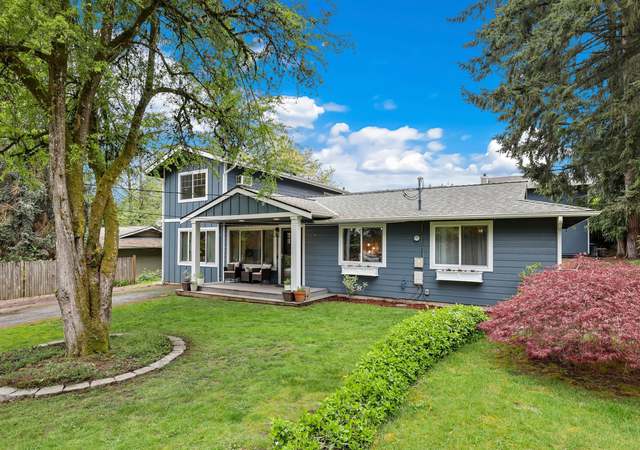
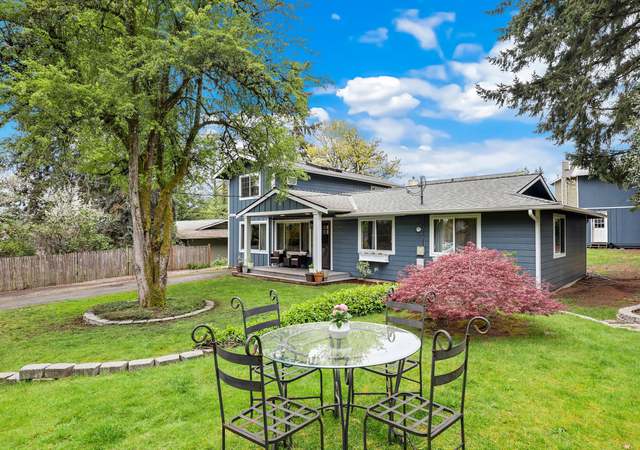
Discover this exquisite Tri-Level home perfectly placed on a corner lot in the coveted Finn Hill neighborhood. Step inside to find an open and inviting living area, a space designed for both relaxation and social gatherings. The kitchen, stylish and functional overlooks a charming dining area that serves as the heart of the home. Bedrooms located upstairs, lower floor offers expansive bonus/den. Outside, the backyard is a private oasis featuring a spacious covered Trex deck, ideal for outdoor entertainment. Raised garden beds, enclosed kennel and detached outbuilding serving as storage or flex space. The property’s standout location near Big Finn Hill Park and major highways provides
1/32
$995,000
3 beds2.5 baths1,510 sq ft7,067 sq ft (lot)
14327 82nd Ave NE, Kirkland, WA 98034
Listing provided by NWMLS as Distributed by MLS Grid
The one you’ve been waiting for! Nestled in beautiful Juanita, this charming 4-bedroom/3 bath home offers a perfect blend of comfort and convenience. The open concept floor plan welcomes you with warm skylights and an updated kitchen. Enjoy your expansive sundeck while overlooking your parklike backyard. Lower-level offers MIL quarters with separate entry. Brand new carpet, with newer roof and furnace. Be ready for the Summer heat with recently installed heat pump. Located in a quiet cul de sac, minutes away from schools, shopping and parks. Award winning LW schools. Freshly poured driveway. Pre-inspected! Must see property!!
1/35
$1,099,000
4 beds3 baths1,680 sq ft8,460 sq ft (lot)
8324 NE 143rd St, Kirkland, WA 98034
Listing provided by NWMLS as Distributed by MLS Grid
Step into luxury with this stunning downtown condo in Kirkland Central. From sleek furnishings to elegant accents, every detail exudes sophistication & style. Indulge in the epitome of urban living, where every corner of this impeccably maintained condo invites relaxation. South facing end unit for great natural light and maximum privacy within the complex. Premium location - walk to EVERYTHING this resort town has to offer: Google, Kirkland Urban, grocery, banks, beaches, fitness, shops, restaurants, library & transit. Well run HOA - amenities incl onsite gym, building manager & community patio. Secured parking space & storage unit included. Most furnishings availab
1/16
$668,000
1 bed1 bath703 sq ft
211 Kirkland Ave #309, Kirkland, WA 98033
Listing provided by NWMLS as Distributed by MLS Grid
Immaculate custom stand alone in desirable South Rose Hill. One of only eleven total homes in Talbott Place. Kitchen boasts updated granite counters with large island, SS appliances, wine fridge. Extra Large primary bedroom with custom walk in closet. Enjoy movies in your very own $30,000+ custom theatre room equipped with an LED star ceiling and seating for six. Home is loaded with extras including custom window shutters, custom closets from closet factory. Brand new carpet, W/ D. Interior has been freshly painted. Central AC, updated in 2020. Two car garage equipped with ceiling rack, EV Plug. Fully fenced backyard with covered patio and updated landscaping surrounding the home. Meticulo
1/36
$1,950,000
4 beds3.5 baths2,895 sq ft
12305 NE 84th Ln, Kirkland, WA 98033
Listing provided by NWMLS as Distributed by MLS Grid
This beautiful 2nd floor unit, remodeled in 2024, includes new kitchen w/ quartz counters & new flooring throughout. Dinning room off the kitchen leads to large living room w/ an abundance of natural light. Sliding door opens to oversized deck for enjoying the summer months. Oversized Primary bedroom w/ ensuite 3/4 bathroom includes new vanity and ample closet space. Primary also has direct access to the large deck. 2nd bedroom for guests or home office. Additional bathroom w/ new vanity & full size W/ D in utility closet. Complex amenities include swimming pool, club house, sauna (2), extra storage unit & 14 visitor parking spots. Located close to restaurants, shopping an
1/32
$475,000
2 beds2 baths937 sq ft
9807 NE 124th St #206, Kirkland, WA 98034
Listing provided by NWMLS as Distributed by MLS Grid
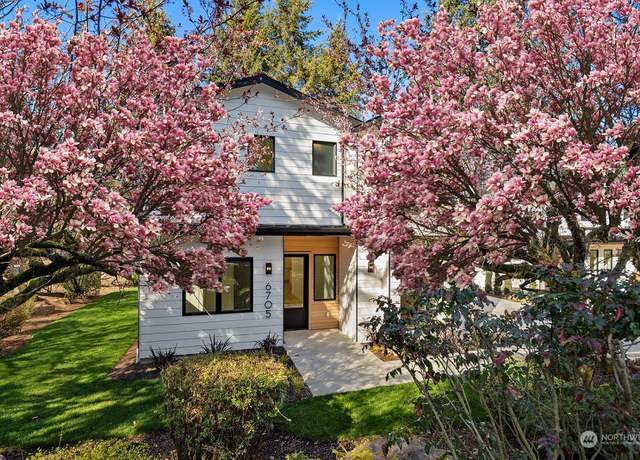
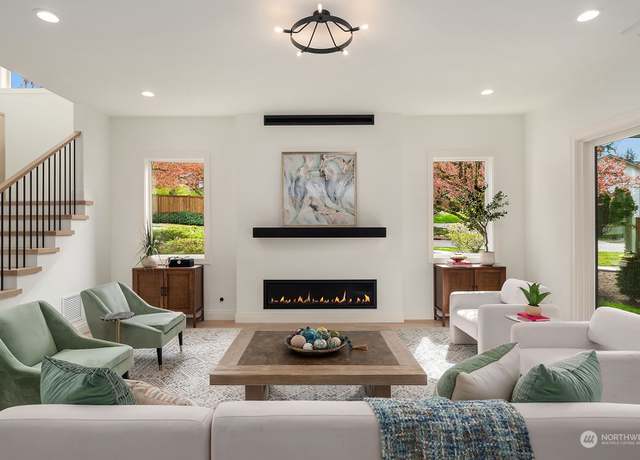
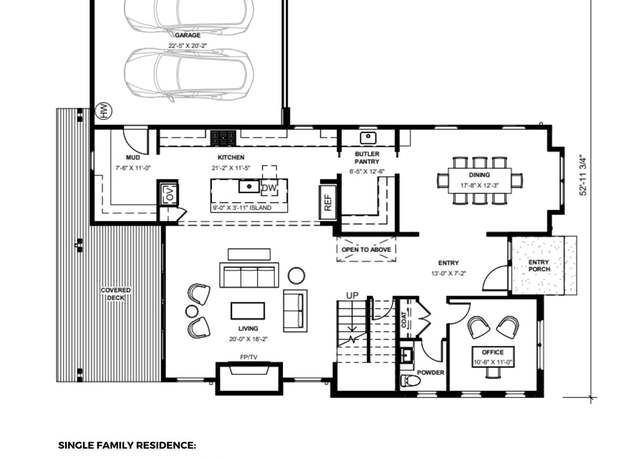
Gorgeous New Home with Impeccable Floor Plan & Finishes! Imagine Homes presents an airy, open, light-filled home with a column of light centering your daily living. EVERYTHING EASTSIDE w/ in 5-10 mins of your frontdoor: Google, Met Market, Dwtn Bellevue, Microsoft, Dwtn Kirkland, Bridle Trails & Lake WA schools! Thoughtfully designed to satisfy every "wants & needs" list: priv & sumptuous primary suite + stellar formal din room + great room/kitchen extended thru sliders to covered deck + home theater complete w/ wet bar entertaining center for movie night + home office + smart mudroom. Top-flight kitchen: limitless counterspace, Butler's pantry, premium app
1/40
$2,980,000
4 beds3.5 baths3,768 sq ft6,779 sq ft (lot)
6705 117th Ave NE, Kirkland, WA 98033
Listing provided by NWMLS as Distributed by MLS Grid
Unique Opportunity! Impeccable New Home + Detached Home for Mutligenerational Living or Rental or Investment by Imagine Homes! Smart, gracious flr plan & finishes in an airy, open, light-filled environment. EVERYTHING EASTSIDE w/ in 5-10 mins of your frontdoor: Google, Met Market, Dwtn Bellevue, Microsoft, Dwtn Kirkland, Bridle Trails & Lake WA schools! Thoughtfully designed to satisfy every "want & need": priv & sumptuous primary suite + stellar din room + great room/kitchen extended thru sliders to outdoor deck + home theater complete w/ wet bar entertaining center/home theater + home office + mudroom. Top-flight kitchen: limitless counters, Butler's pant
1/40
$4,250,000
6 beds6 baths5,101 sq ft9,182 sq ft (lot)
6705 6707 117th Ave NE, Kirkland, WA 98033
Listing provided by NWMLS as Distributed by MLS Grid
Rare West of Market Opportunity! Prized location, zoning, and multiple options for use or future development. Duplex sits on a flat 8000+ sq ft lot blocks to…everything. Downtown Kirkland, waterfront, parks, award winning schools and eateries. Current use was rental on one side, business on the other. Do a few updates and keep as a duplex or rebuild as townhomes, short term rentals, office/retail. Sought after Market Street Corridor (MSC -1) zoning allows for single family, office, retail, townhomes, or multifamily. Each unit is a 2 bed, 1 bath. 2 car carport, alley access, new roof, new furnace. Buyer to verify all to own satisfaction.
1/25
$1,550,000
4 beds2 baths1,600 sq ft8,048 sq ft (lot)
1235 Market St, Kirkland, WA 98033
Listing provided by NWMLS as Distributed by MLS Grid
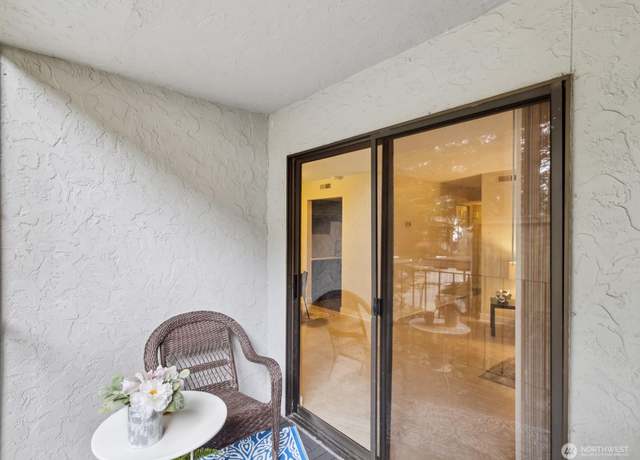
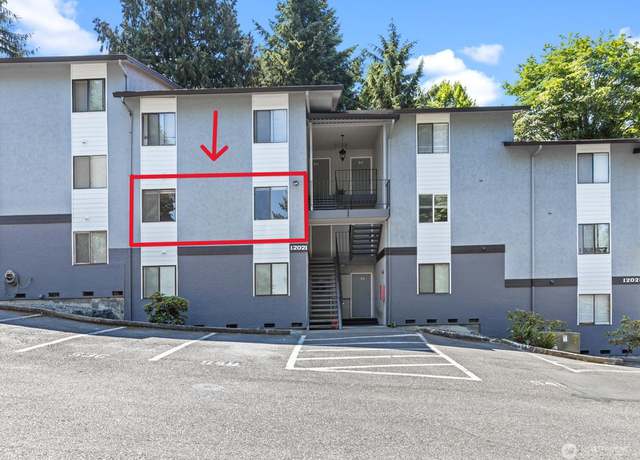
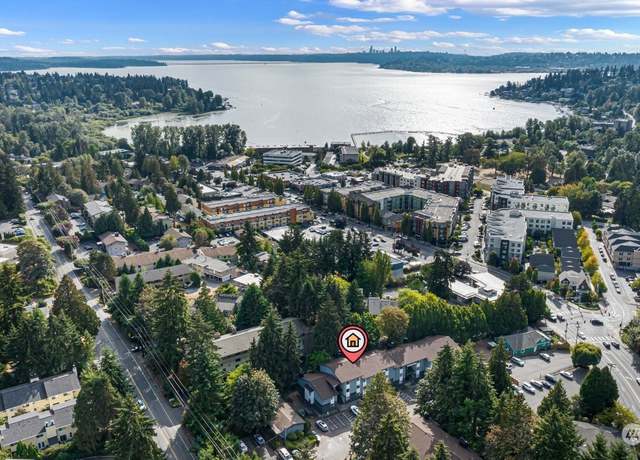
Embrace the vibrant lifestyle of Kirkland's desirable Juanita neighborhood, w/ beaches, parks, restaurants & shops just blocks away! Step inside to discover vinyl plank flooring throughout, complemented by tile flooring in the kitchen & bathroom. Spacious living room boast a cozy fireplace, creating an inviting atmosphere for relaxation or entertainment. Slide open the balcony doors to let in fresh air & enjoy your morning coffee or evening relaxation. The bright kitchen features granite countertops, newer SS appliances & ample cabinet space. Generous walk-in closet in primary bedroom, providing plenty of storage space. This condo is ideal for accommodating guests, s
1/20
$425,000
2 beds1 bath963 sq ft
12021 100th Ave NE Unit 3B, Kirkland, WA 98034
Listing provided by NWMLS as Distributed by MLS Grid
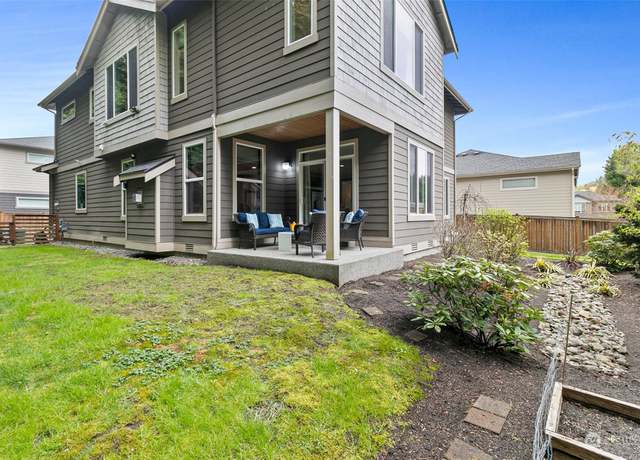
Welcome to the immaculately maintained 2015 built 2-story home in the community of Verde. This gorgeous home offers ample space for everyone - 4 bedrooms, oversized loft, bonus & utility room on upper level, den or 5th bedroom on main level. 2.75 bath w/ main level shower. Inviting living room adjacent to formal dining. Chef's kitchen w/ large island next to breakfast nook & cozy family room w/ gas fireplace. Walk-in Pantry. Large master suite w/ 5-piece bath & walk-in closet. Covered patio overlooks serene greenery in the backyard. Dead-end street. Enjoy the close proximity to the amenities of shopping & dining in the Village at Totem Lake only one exit away. Sought
1/40
$1,845,000
4 beds3 baths3,680 sq ft6,875 sq ft (lot)
10031 NE 147th St, Bothell, WA 98011
Listing provided by NWMLS as Distributed by MLS Grid
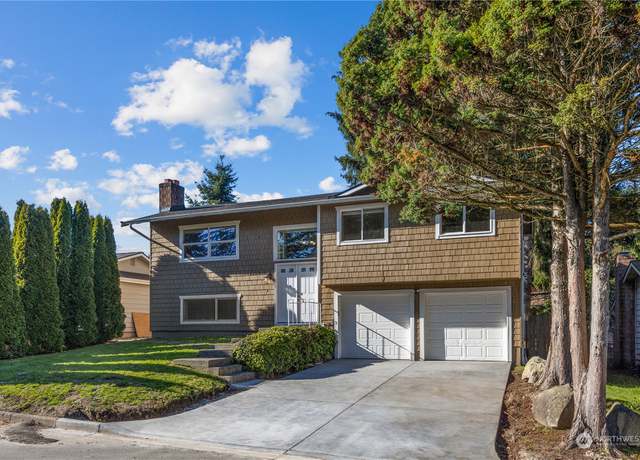
Beautiful North facing daylight rambler is situated on an expansive lot, that is perfect for living in now and developing in the future. Light, bright and move-in ready!!! Brand New roof, new air conditioning to cool the hot summer days, new driveway and pavers and an updated kitchen. Wonderful 2080 SF floor plan showcases abundant windows in the spacious living/dining area, 3 beds and a full bath upstairs. Downstairs features an ENORMOUS bonus/flex room, ornate floor to ceiling tiled fireplace and an additional bedroom and fully updated bathroom. Outside find an entertainment sized deck overlooking the huge private yard. Minutes to Google, Microsoft D/T Kirkland and Freeways.
1/25
$1,299,950
4 beds2 baths2,080 sq ft8,512 sq ft (lot)
11213 NE 112th St, Kirkland, WA 98033
Listing provided by NWMLS as Distributed by MLS Grid
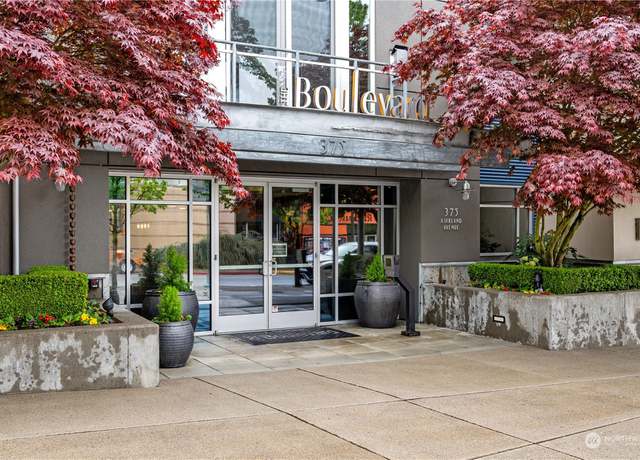
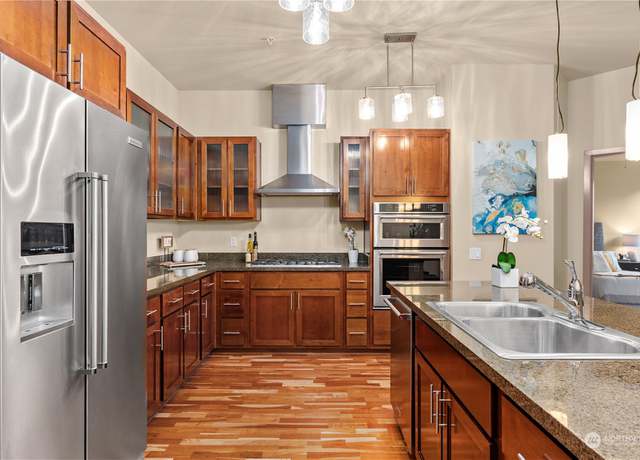
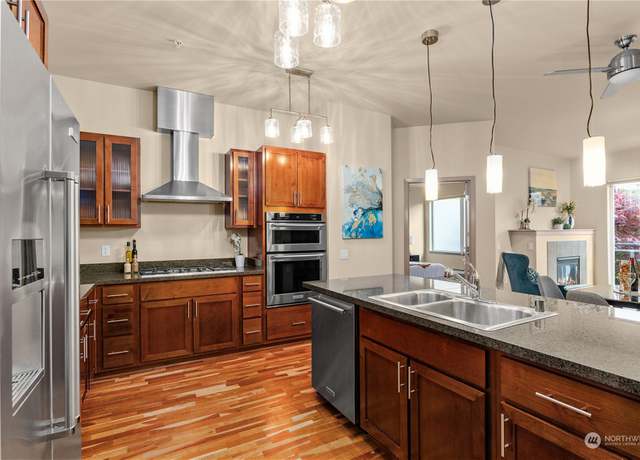
Live the coveted downtown Kirkland lifestyle at The Boulevard! This premier community exemplifies luxury living in an unbeatable location! This condo lives large w/ an open floorplan, 9' ceilings & large windows. 2 bdrms + an office offers a versatile layout to fit your lifestyle. The spacious kitchen boasts granite counters, gas cooking & many newer appliances. The primary bdrm feels luxurious w/ a walk-in closet & 5-piece bath. Hardwood floors, gas fireplace, top-down/bottom-up shades, in-unit W/ D & 2 garage prkg spots! Well-run, pet-friendly HOA w/ a community lounge, on-site mgmt & no rental cap. PCC, Performing Arts Center, library, senior center &
1/34
$885,000
2 beds2 baths1,277 sq ft
375 Kirkland Ave #236, Kirkland, WA 98033
Listing provided by NWMLS as Distributed by MLS Grid
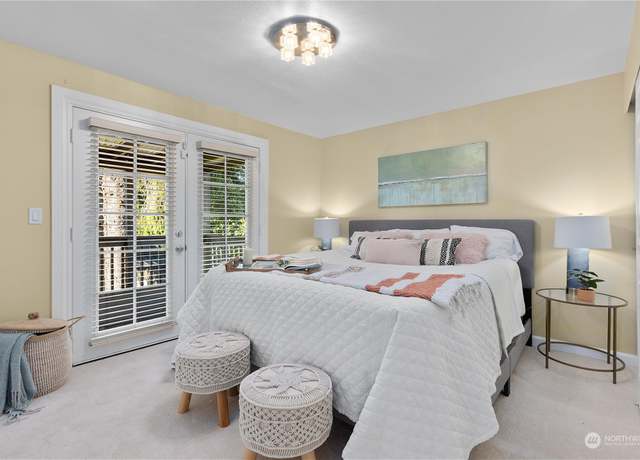
Quiet location on a corner lot of a cul-de-sac, on a beloved street in Juanita, is this spacious 2,100 sf home. A ground-level wide entry welcomes you in. The updated, open-concept kitchen flows into the family room w/ gas fireplace with a slider to the patio, retractable awning & backyard. The main level also offers a living room, dining room and family room. Separate laundry room & half bath along w/ a two-car garage complete the main level. The Primary bedroom with en suite bathroom upstairs is accompanied by 3 bedrooms and a pull-down ladder to storage in the attic. New roof, gutters, exterior paint & garage door in 2020. New electrical panel. Amazing location close to
1/32
$1,199,950
4 beds2.5 baths2,100 sq ft6,900 sq ft (lot)
10403 NE 136th Pl, Kirkland, WA 98034
Listing provided by NWMLS as Distributed by MLS Grid
Welcome to Rosewood Commons PUD/Townhome in the heart of Kirkland and desired Lake Washington schools! Space and opportunity on three levels. Lower level private entrance and the possibility to make it something special. Main floor Master bed with 5pc bath, and walk in closet. Kitchen with granite counters, SS sink and appliances. Upstairs features 2 beds, full bath, open office & family room with deck. Vaulted ceilings, Main Floor gas fireplace, Dinning room with sunrise deck, 3 car garage, Open concept, territorial views, Small intimate complex of 10 units well managed. Air Conditioning and Easy East side commute!! Pre Inspected!!
1/34
$1,475,000
4 beds2.5 baths2,557 sq ft3,076 sq ft (lot)
10014 NE 124th Ave, Kirkland, WA 98033
Listing provided by NWMLS as Distributed by MLS Grid
Welcome home to a beautiful rambler in Upland Green community of Kirkland. This 2 Bedroom home with a bonus room & 1.75 bath features a great floor plan layout & separate entrance to the attached 2 car garage. Enjoy updated kitchen with stainless steel appliances, living room with a fireplace and a dining room with a glass slider leading to a covered patio which is perfect for social gathering. The primary bedroom is connecting to a bonus room that leads to the deck outside. The backyard overlooks the tennis courts. New Roof in February 2024, new carpet in guest room. Ideally situated near Award-winning Lake Washington School District, parks & new Village at Totem Lake. Do
1/23
$859,950
2 beds2 baths1,260 sq ft5,000 sq ft (lot)
13630 135th Ave NE, Kirkland, WA 98034
Listing provided by NWMLS as Distributed by MLS Grid
Located in the heart of Downtown Kirkland, the Portsmith offers unparalleled convenience. Just one block from the waterfront, shops and restaurants, it's the epitome of urban living. Recent updates include fresh carpet and paint. The open floorpan maximizes the space. Portsmith amenities include a beautiful gathering space, fitness center, conference room and two guest suites available for your out of town guests. Unit comes with two secure parking spaces and has no rental cap. Pre-inspected for buyer's peace of mind.
1/22
$865,000
2 beds2 baths1,090 sq ft
109 2nd St S #520, Kirkland, WA 98033
Listing provided by NWMLS as Distributed by MLS Grid
Opportunity Knocks in Kirkland! This 3 bedroom (possible 4 bedroom) 3 bath home boasts a sought after location in Kingsgate close to Totem Lake, Microsoft, 405, 520 & I-90. With a bath off the primary bedroom, a family room and wet bar on the lower level, plus a 2 car garage - the potential is endless! Bring your vision and creativity to restore this gem to its full glory. Original finishes provide a blank canvas for your personal touch. At 1950 square feet, there's plenty of room to re-imagine and renovate. Don't miss your chance to make your mark in this desirable neighborhood and make this home shine! The fully fenced yard is ready for outdoor entertaining. Furnace-2017/new blower
1/28
$974,950
3 beds3 baths1,950 sq ft7,800 sq ft (lot)
13807 128th Ave NE, Kirkland, WA 98034
Listing provided by NWMLS as Distributed by MLS Grid
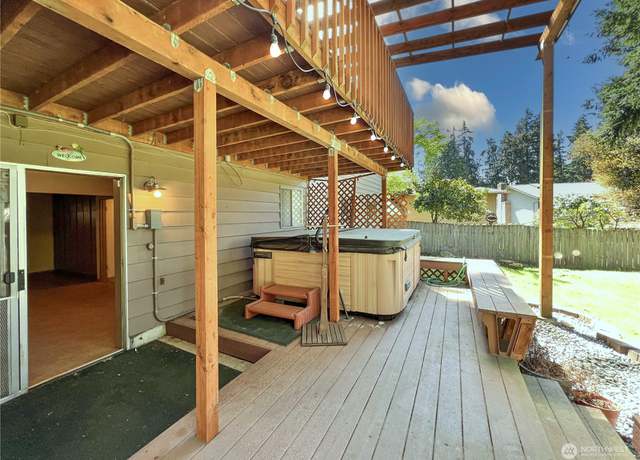
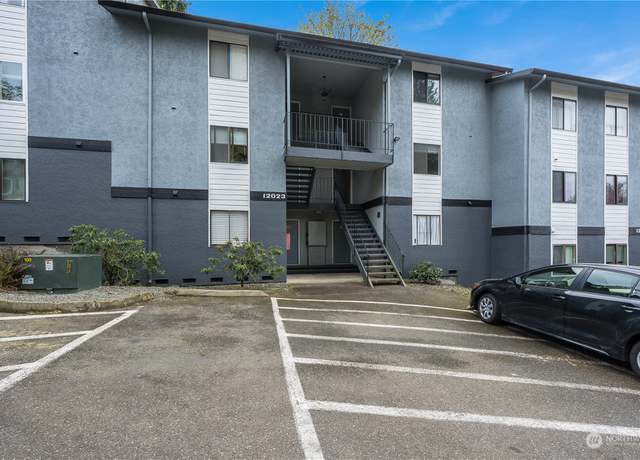
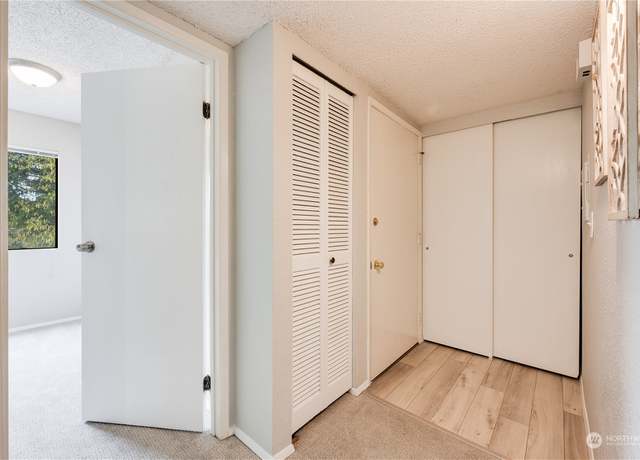
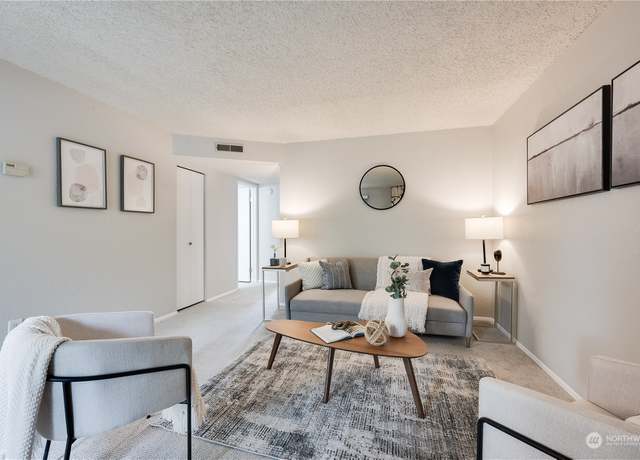
Embrace the convenience and beauty of life in Juanita! Located across the street from Juanita Beach Park and Juanita Village, with its vibrant restaurants and retail, and minutes to 405 and downtown Kirkland, this charming one bedroom is exactly where you want to be! Tucked away on a quiet street beneath towering trees, yet in the middle of the best Juanita has to offer. This unit offers a cozy family room with stone wood-burning fireplace. The kitchen features a spacious eating area. A generous bedroom and full bath complete the interior. Enjoy your morning coffee on the quiet balcony. Peekaboo city views on a clear day! Storage closet with ample space located on balcony. No rental cap! Fa
1/15
$334,950
1 bed1 bath662 sq ft
12023 NE 100th Ave NE Unit 6B, Kirkland, WA 98034
Listing provided by NWMLS as Distributed by MLS Grid
Welcome to the Highlands neighborhood of Kirkland. Update tri level home on a large private lot. Main floor features a formal living room with hardwood floors, recessed lighting and a gas fireplace, formal dining room has sliding door to back deck and side door to Sunroom/Atrium. Updated kitchen with eating space, gas range and stainless appliances all included. Upper level features hardwood floors, a master bedroom suite with an updated 3/4 bathroom & walk in closet, 2nd & 3rd bedrooms and an updated full bathroom. Lower level has a family room, 1/2 bathroom and laundry closet. Attached 2 car garage. Gas forced air heat. Great location close to cross Kirkland trail, Downtown/wa
1/40
$1,149,757
3 beds2.5 baths1,820 sq ft9,269 sq ft (lot)
10120 111th Ave NE, Kirkland, WA 98033
Listing provided by NWMLS as Distributed by MLS Grid
A Private Sanctuary in the Heart of Kirkland. Pristine East of Market NW Contemporary. Meticulously cared for home recently updated featuring new roof, heating system, kitchen, appliances, baths & engineered hardwood floors. Main floor features living & family room w/ fireplace, dining room, kitchen, large office, utility room & powder room. Upstairs primary w/ heated floor bath, walk in closet & 3 additional bedrooms, 2 more baths & large bonus room. Extraordinary sunny private fenced backyard w/ patio, big lawn & surrounding garden. Curated berry & herb garden. Wonderful outdoor spaces for play & entertainment. 3 car garage. Blocks from lowe
1/40
$3,325,000
4 beds4.5 baths3,913 sq ft0.28 acre (lot)
1077 3rd St, Kirkland, WA 98033
Listing provided by NWMLS as Distributed by MLS Grid
Escape to Pebble Beach Condominiums! This top-floor haven boasts stunning views of Lake Washington, the Olympics, and Seattle. Luxuriate by the fireplace, enjoy a sleek kitchen and bathroom, plus 40k of California Closets and a Murphy bed. Entertain in the open-concept living and dining areas, with ample storage. Step onto the oversized deck for breathtaking vistas. Dive into water activities from the private beach. Benefit from locked storage, deeded parking, bike storage, and kayak/paddleboard launch. Experience the epitome of waterfront living, minutes from downtown Kirkland. This is lakefront living at its finest!
1/21
$670,000
1 bed1 bath595 sq ft
6201 Lake Washington Blvd NE #307, Kirkland, WA 98033
Listing provided by NWMLS as Distributed by MLS Grid
Welcome to the Copper Wood community of Kirkland. This Beautiful property sits on a Large private lot. Entry opens into spacious family room with vaulted ceiling, hardwood flooring throughout plus large fireplace to compliment. Bright windows adds natural lighting and character. Kitchen boasts quartz counter tops, new cabinets, custom glass tile backsplash and stainless steel appliances. Nice size primary bedroom with attached bathroom plus walk in closet. Additional two bedrooms with new paint and flooring plus full size bathroom. Enjoy the beautiful landscape and roomy private back yard. Extra large 2 car garage with plenty of space for workshop and all your tools. Within minutes from I-4
1/20
$1,300,000
3 beds2 baths1,380 sq ft8,644 sq ft (lot)
11527 113th Pl NE, Kirkland, WA 98033
Listing provided by NWMLS as Distributed by MLS Grid
Updated, move in ready, and charming! Perfect location in established Finn Hill neighborhood situated on a large lot. Inside, you'll feel the warmth & character of this home, w/ a cozy living room space that connects with an updated kitchen. Granite countertops, SS appliances, and lots of cabinet space! Dining room connects to a large utility/office space. Updated full bathroom and bedrooms on main floor all with laminate flooring. Upstairs, you'll love the full primary wing! Complete with a custom bathroom, WIC, & vaulted ceilings! Home sits back off the street for plenty of privacy, and has an extra long driveway for RVs/boats! HUGE backyard, with custom built shed, perfect for
1/38
$995,000
3 beds2 baths1,820 sq ft9,702 sq ft (lot)
8020 NE 124th St, Kirkland, WA 98034
Listing provided by NWMLS as Distributed by MLS Grid
One-level living in central Kirkland with sweeping westward views of Lake Washington & Olympic Mountains. This spacious 2 bed/2 bath corner unit home at Villas at Carillon Point offers 1,684 sqft of light-filled space and a light and airy open floor plan. Two balconies, and ample room for comfortable living. Located across the road from Carillon Point and down the road from downtown Kirkland. Enjoy a personal garage with EV charging install, one assigned parking spot, guest parking, and elevator access. . Gourmet kitchen and large living room with fireplace, dining area, breakfast nook, walk-in laundry room, and formal entry foyer. Air-conditioning and closet systems. Washer & D
1/40
$1,820,000
2 beds2 baths1,684 sq ft
5404 Lake Washington Blvd Unit D, Kirkland, WA 98033
Listing provided by NWMLS as Distributed by MLS Grid
Elegantly renovated 2-bed, 1-bath condominium nestled in the cherished Kingsgate neighborhood. Revel in the abundant natural light that illuminates the inviting main living and dining spaces. Delight in the generously sized kitchen featuring stainless steel appliances and a spacious walk-in pantry. Numerous upgrades, including wood plank flooring, in-unit washer/dryer, freshly painted interiors, modern lightnening, stone fireplace, and a pristine enameled bathtub accompanied by newer sinks and faucets, among other amenities. Embrace outdoor living during the summer months on the serene patio enveloped by lush trees. Single car garage w/ lots of extra storage and workbench. Exterior of compl
1/22
$490,000
2 beds1 bath935 sq ft
12728 NE 144th St Unit F102, Kirkland, WA 98034
Listing provided by NWMLS as Distributed by MLS Grid
You've been waiting for this thoughtfully remodeled, gorgeous, 4 bedroom view home East of Market! Close to everything, home offers Location, location! Minutes to the I-405 & 85th intersection and the downtown Kirkland shops & beach! Home features a redone kitchen with eating area! A redone Primary suite with remodeled ensuite bath & walk in closet! Relax in the family room with sliders to view deck! Embrace the ambiance of 2 gas fireplaces; one in living room and another in primary bedroom! Downtown skyline & lake view! Easy outside access with multiple sliders to private entertaining oasis featuring 2 patio areas deck! Bring the games & barbeque! Live your b
1/19
$1,775,000
4 beds2 baths2,320 sq ft0.23 acre (lot)
11404 NE 92nd St, Kirkland, WA 98033
Listing provided by NWMLS as Distributed by MLS Grid
Based on information submitted to the MLS GRID as of Tue Apr 23 2024. All data is obtained from various sources and may not have been verified by broker or MLS GRID. Supplied Open House Information is subject to change without notice. All information should be independently reviewed and verified for accuracy. Properties may or may not be listed by the office/agent presenting the information. Some IDX listings have been excluded from this website.
This area's enrollment policy is not based solely on geography. Please check the school district website for more information.
Elementary schools
Middle schools
High schools
GreatSchools Summary Rating
9/10
Emerson K-12
Public, K-12
8/10
Benjamin Franklin Elementary School
Public, K-5
8/10
Peter Kirk Elementary School
Public, K-5
7/10
Helen Keller Elementary School
Public, K-5
7/10
Alexander Graham Bell Elementary School
Public, PreK-5
Only showing 5 of
18 elementary schools.
School data is provided by GreatSchools, a nonprofit organization. Redfin recommends buyers and renters use GreatSchools information and ratings as a first step, and conduct their own investigation to determine their desired schools or school districts, including by contacting and visiting the schools themselves.Redfin does not endorse or guarantee this information. School service boundaries are intended to be used as a reference only; they may change and are not guaranteed to be accurate. To verify school enrollment eligibility, contact the school district directly.
Homes for sale in Kirkland have a median listing price of $1.35M. Some of these homes are Hot Homes, meaning they're likely to sell quickly.
What are some of the most popular neighborhoods in Kirkland?
Popular neighborhoods include Finn Hill, Market / Downtown Kirkland, Lake City, South Juanita, Totem Lake, North Juanita, Northeast Seattle, View Ridge, North Seattle, and Bridle Trails.
Kirkland, Washington offers a variety of transportation options, including a well-structured public transportation system. The city is served by King County Metro Transit buses, providing residents with an alternative to driving. However, for those who prefer using a car, it's important to note that Kirkland experiences moderate to high levels of traffic, especially during peak hours. Additionally, the city is conveniently located near major highways and freeways, including Interstate 405, making it easily accessible for both local and out-of-town commuters. Learn more on our Kirkland city guide.
What types of properties are available in Kirkland?
Kirkland, Washington offers a variety of single-family home types, including ranch-style, split-level, and contemporary homes, among others, each with their own unique architectural features and designs; these homes can be found throughout the different neighborhoods of Kirkland, such as Bridle Trails, Juanita, and Houghton, providing a range of options for potential buyers; most properties in Kirkland, Washington offer multiple bedrooms and were built in various years, allowing buyers to find a home that suits their specific needs and preferences; To explore different property types for sale in Kirkland, Washington, use the 'Home type' filter located above the active listings. Customize your search by selecting options like single-family homes, condos, townhomes, and more.
What is life like in Kirkland?
Kirkland, Washington offers a serene and picturesque living experience with its stunning landscape. The city is blessed with a beautiful mix of mountains, lakes, and parks, providing abundant opportunities for outdoor enthusiasts to explore and enjoy nature. The weather in Kirkland is characterized by mild summers and cool, wet winters, creating a pleasant climate throughout the year. The city boasts a thriving job market, with diverse employment opportunities across various industries, ensuring residents have ample options for career growth. Kirkland also offers a vibrant social scene, with a plethora of recreational activities, cultural events, and dining options to keep residents entertained and engaged.
What are the schools and amenities like in Kirkland?
Kirkland, Washington offers a variety of public amenities to enhance the lifestyle of its residents. Yes, the city boasts a wide selection of restaurants catering to diverse culinary tastes. Numerous parks provide open spaces for leisure and recreation, while a range of grocery stores ensure convenient access to daily necessities. Additional amenities include libraries, fitness centers, and community centers that foster social interaction. Overall, Kirkland provides a well-rounded living experience with its array of amenities.
In the past month, 138 homes have been sold in Kirkland. In addition to houses in Kirkland, there were also 64 condos, 27 townhouses, and 2 multi-family units for sale in Kirkland last month. Kirkland is a moderately walkable city in King County with a Walk Score of 51. Kirkland is home to approximately 48,669 people and 31,911 jobs. Find your dream home in Kirkland using the tools above. Use filters to narrow your search by price, square feet, beds, and baths to find homes that fit your criteria. Our top-rated real estate agents in Kirkland are local experts and are ready to answer your questions about properties, neighborhoods, schools, and the newest listings for sale in Kirkland. Our Kirkland real estate stats and trends will give you more information about home buying and selling trends in Kirkland. If you're looking to sell your home in the Kirkland area, our listing agents can help you get the best price. Redfin is redefining real estate and the home buying process in Kirkland with industry-leading technology, full-service agents, and lower fees that provide a better value for Redfin buyers and sellers.


 REDFIN IS COMMITTED TO AND ABIDES BY THE FAIR HOUSING ACT AND EQUAL OPPORTUNITY ACT. READ REDFIN'S FAIR HOUSING POLICY AND THE NEW YORK STATE FAIR HOUSING NOTICE.
 United States
 Canada