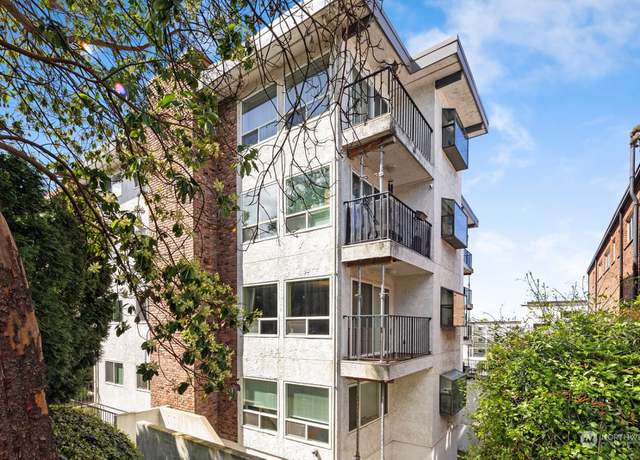
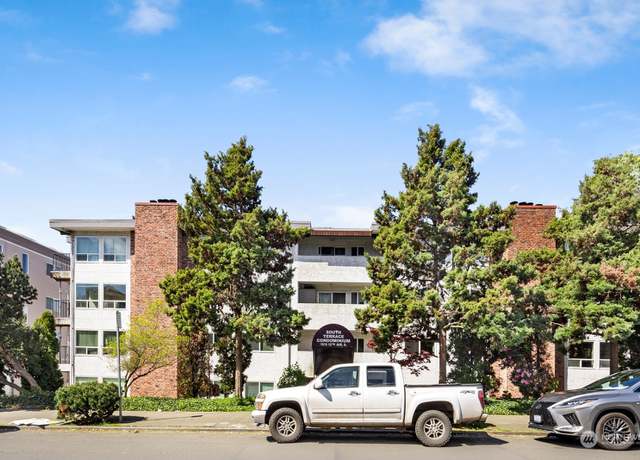
Industrial District, WA homes for sale
No homes in this area


Average home prices near Industrial District, WA
Cities
- Redmond homes for sale$1,156,995
- Seattle homes for sale$799,950
- Issaquah homes for sale$674,500
- Bellevue homes for sale$1,412,500
- Edmonds homes for sale$1,117,000
- Gig Harbor homes for sale$1,049,475
Neighborhoods
- Alki Point homes for sale$1,049,999
- Madrona homes for sale$1,695,000
- Capitol Hill homes for sale$532,000
- Downtown Seattle homes for sale$635,000
- Mount Baker homes for sale$1,085,000
- Columbia City homes for sale$1,000,000
More to explore in Industrial District, WA
Living in Industrial District, WA
- Schools
- Climate
- Things to do
- Transportation
Schools in Industrial District
Public, K-5
Popular Markets in Washington
- Seattle homes for sale$799,950
- Bellevue homes for sale$1,412,500
- Bothell homes for sale$1,199,975
- Tacoma homes for sale$525,000
- Kirkland homes for sale$1,599,975
- Redmond homes for sale$1,156,995
Frequently asked questions
What are some of the most popular neighborhoods in Industrial District?
How often does Redfin update their new listings?
Industrial District is a moderately walkable neighborhood in Seattle with a Walk Score of 68. Industrial District is home to approximately 530 people and 27,845 jobs. Find your dream home in Industrial District using the tools above. Use filters to narrow your search by price, square feet, beds, and baths to find homes that fit your criteria. Our top-rated real estate agents in Industrial District are local experts and are ready to answer your questions about properties, neighborhoods, schools, and the newest listings for sale in Industrial District. If you're looking to sell your home in the Industrial District area, our listing agents can help you get the best price. Redfin is redefining real estate and the home buying process in Industrial District with industry-leading technology, full-service agents, and lower fees that provide a better value for Redfin buyers and sellers.
About us
Find us
Subsidiaries
 United States
 Canada
Copyright: © 2024 Redfin. All rights reserved.
Updated January 2023: By searching, you agree to the Terms of Use, and Privacy Policy.
Do not sell or share my personal information.
REDFIN and all REDFIN variants, TITLE FORWARD, WALK SCORE, and the R logos, are trademarks of Redfin Corporation, registered or pending in the USPTO.
California DRE #01521930
Redfin is licensed to do business in New York as Redfin Real Estate. NY Standard Operating Procedures
New Mexico Real Estate Licenses
TREC: Info About Brokerage Services, Consumer Protection Notice
If you are using a screen reader, or having trouble reading this website, please call Redfin Customer Support for help at 1-844-759-7732.
 REDFIN IS COMMITTED TO AND ABIDES BY THE FAIR HOUSING ACT AND EQUAL OPPORTUNITY ACT. READ REDFIN'S FAIR HOUSING POLICY AND THE NEW YORK STATE FAIR HOUSING NOTICE.