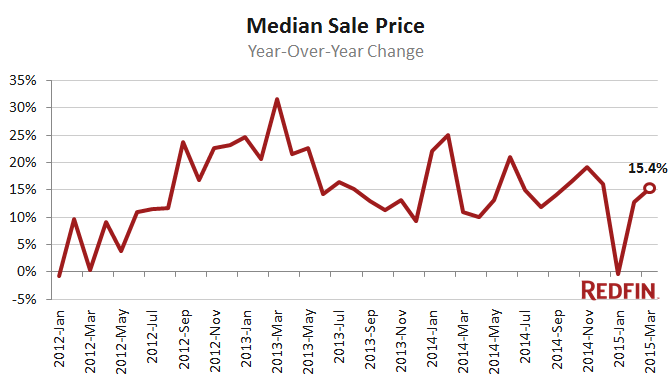
Home values rose 15.4 percent in March from a year ago and sales posted a meager year-over-year improvement after four straight months of decline.
The city’s median sale price was above $1 million for the second straight month, rising 15.4 percent from last March to $1.13 million. More than 75 percent of homes sold above their asking price. Pacific Heights and Telegraph Hill saw the biggest price gains year over year. In Pacific Heights, the median sale price reached $2 million, a 38 percent increase from March 2014.
Inventory — or the lack of it — continues to be a big challenge for buyers. Although more houses, condominiums and co-ops came on the market last month, it wasn’t enough to keep pace with demand. That’s particularly unusual for March, a month that traditionally posts an uptick in inventory as sellers prepare for the spring home-buying season. San Francisco bucked that trend last month, when total inventory actually fell. There were only 409 properties on the market at the end of March, fewer than in February and a 3.5 percent drop from a year earlier. For the third straight month, the number of new listings exceeded total inventory at month’s end.
“Even though San Francisco’s average list price is just shy of $1 million, most buyers ended up paying much more than that,” Redfin Chief Economist Nela Richardson said. “On average, homes sell for 12 percent more than what they’re listed at. In fact, 5 percent more sold above list last month than a year ago, setting the stage for another record-breaking year for prices.”
Last month the city had a single month’s supply of homes for sale, far below the six months of inventory that signals a balanced market. More than half of homes in the city sold in less than two weeks.
The lack of inventory is one reason the number of homes sold has been shrinking. After four months of year-over-year declines, the number of sales rose slightly — less than half a percentage point — in March from the same time in 2014. In all, there were 527 new listings in March; 426 properties sold. Of the 21 San Francisco neighborhoods analyzed, only nine had more new listings last month than they did in March 2014.
Bidding Wars
In all but three neighborhoods, homes went under contract for more than their asking price. Competition was most pronounced in Miraloma Park, where the average sale-to-list ratio was more than 128 percent. Lower Haight was a close second, with homes selling for just over 124 percent of asking. The ratio was about 99 percent in the Financial District, 93 percent in Twin Peaks, and just under 92 percent in Telegraph Hill.
“There has been a palpable decrease in inventory,” said Mark Colwell, a San Francisco real estate agent. “We were one of 30 offers on a property in the Outer Mission, a neighborhood pretty far from the city center. It went for 8 percent above the comparable homes we looked at, which is really substantial. The winning offer was also 40 percent above the list price, a number that is more arbitrary now than it ever was.”

| Neighborhood | Median Sale Price | Year-Over-Year | Homes sold | Year-Over-Year | Inventory | Year-Over-Year |
|---|---|---|---|---|---|---|
| Ashbury Heights | $2,084,000 | 67.0% | 6 | -33.0% | 2 | -33.0% |
| Bayview | $736,000 | 48.0% | 11 | -27.0% | 19 | 0.0% |
| Bernal Heights | $1,045,000 | 2.0% | 16 | 60.0% | 12 | 0.0% |
| Civic Center / Van Ness | $849,500 | 11.0% | 4 | -71.0% | 6 | 0.0% |
| Crocker-Amazon | $802,500 | 47.0% | 4 | 0.0% | 2 | -60.0% |
| Excelsior | $712,500 | 32.0% | 10 | 0.0% | 9 | -18.0% |
| Financial District | $1,775,000 | 13.0% | 4 | 100.0% | 4 | -56.0% |
| Forest Hill | $1,199,000 | -27.0% | 3 | -40.0% | 3 | 200.0% |
| Haight-Ashbury | $1,205,000 | 7.0% | 4 | 0.0% | 2 | -75.0% |
| Hayes Valley | $1,100,000 | 4.0% | 5 | 150.0% | 1 | 0.0% |
| Ingleside | $858,000 | 36.0% | 1 | -75.0% | 2 | -60.0% |
| Ingleside Heights | $635,000 | 24.0% | 5 | 25.0% | 5 | 67.0% |
| Inner Richmond | $1,175,000 | -23.0% | 2 | -33.0% | 4 | 100.0% |
| Inner Sunset | $1,250,000 | 27.0% | 5 | -17.0% | 5 | 25.0% |
| Lower Haight | $1,360,500 | 36.0% | 4 | -20.0% | 4 | -56.0% |
| Marina | $1,650,000 | 3.0% | 15 | 15.0% | 9 | 13.0% |
| Miraloma Park | $1,280,000 | 22.0% | 6 | -33.0% | 8 | -33.0% |
| Mission | $1,107,500 | 21.0% | 30 | 131.0% | 20 | 300.0% |
| Mission Bay | $1,140,000 | 14.0% | 7 | -53.0% | 13 | 30.0% |
| Nob Hill | $1,600,000 | 40.0% | 9 | -10.0% | 7 | -50.0% |
| Noe Valley | $1,475,000 | -3.0% | 21 | -5.0% | 8 | -47.0% |
| Outer Mission | $746,000 | 3.0% | 7 | 133.0% | 3 | -40.0% |
| Outer Richmond | $1,020,150 | 15.0% | 6 | 50.0% | 4 | -64.0% |
| Outer Sunset | $992,500 | 23.0% | 12 | 9.0% | 11 | 83.0% |
| Pacific Heights | $2,800,000 | 177.0% | 15 | 15.0% | 15 | -17.0% |
| Parkside | $1,100,000 | 13.0% | 5 | -17.0% | 7 | 0.0% |
| Portola | $635,000 | -15.0% | 3 | -40.0% | 6 | -33.0% |
| Potrero Hill | $1,170,000 | 16.0% | 14 | 27.0% | 4 | -78.0% |
| Rincon Hill | $1,069,000 | 10.0% | 8 | -27.0% | 9 | -10.0% |
| Russian Hill | $1,155,000 | 31.0% | 7 | -30.0% | 10 | -23.0% |
| South of Market | $1,125,000 | 14.0% | 53 | 0.0% | 52 | 6.0% |
| Sunnyside | $1,275,000 | 38.0% | 4 | -33.0% | 6 | -25.0% |
| Sunset District | $1,130,025 | 17.0% | 36 | -23.0% | 33 | 3.0% |
| Telegraph Hill | $2,300,000 | 100.0% | 4 | -20.0% | 5 | 25.0% |
| Tenderloin | $605,000 | -28.0% | 2 | -33.0% | 2 | 0.0% |
| Twin Peaks | $1,105,000 | -40.0% | 3 | 50.0% | 5 | -17.0% |
| Visitacion Valley | $755,500 | 19.0% | 6 | 200.0% | 12 | 9.0% |
| Western Addition | $855,000 | 19.0% | 4 | 33.0% | 4 | 33.0% |
| San Francisco, CA | $1,125,000 | 14.6% | 431 | 1.4% | 413 | -2.6% |
| Neighborhood | New Listings | Median Days on Market | Avg Sale-to-List | Months of Supply |
|---|---|---|---|---|
| Ashbury Heights | 9 | 10 | 126.0% | 0.3 |
| Bayview | 20 | 17 | 105.0% | 1.7 |
| Bernal Heights | 18 | 13 | 116.0% | 0.8 |
| Civic Center / Van Ness | 6 | 12 | 110.0% | 1.5 |
| Crocker-Amazon | 1 | 11 | 118.0% | 0.5 |
| Excelsior | 9 | 18 | 121.0% | 0.9 |
| Financial District | 1 | 20 | 99.0% | 1.0 |
| Forest Hill | 4 | 15 | 124.0% | 1.0 |
| Haight-Ashbury | 6 | 12 | 119.0% | 0.5 |
| Hayes Valley | 3 | 15 | 117.0% | 0.2 |
| Ingleside | 2 | 11 | 115.0% | 2.0 |
| Ingleside Heights | 4 | 8 | 110.0% | 1.0 |
| Inner Richmond | 4 | 16 | 124.0% | 2.0 |
| Inner Sunset | 5 | 16 | 108.0% | 1.0 |
| Lower Haight | 8 | 17 | 124.0% | 1.0 |
| Marina | 18 | 13 | 117.0% | 0.6 |
| Miraloma Park | 20 | 12 | 128.0% | 1.3 |
| Mission | 22 | 14 | 106.0% | 0.7 |
| Mission Bay | 15 | 12 | 103.0% | 1.9 |
| Nob Hill | 6 | 13 | 112.0% | 0.8 |
| Noe Valley | 17 | 13 | 115.0% | 0.4 |
| Outer Mission | 5 | 14 | 114.0% | 0.4 |
| Outer Richmond | 4 | 13 | 115.0% | 0.7 |
| Outer Sunset | 12 | 12 | 119.0% | 0.9 |
| Pacific Heights | 15 | 11 | 113.0% | 1.0 |
| Parkside | 8 | 15 | 115.0% | 1.4 |
| Portola | 6 | 16 | 112.0% | 2.0 |
| Potrero Hill | 8 | 14 | 109.0% | 0.3 |
| Rincon Hill | 9 | 14 | 103.0% | 1.1 |
| Russian Hill | 8 | 16 | 110.0% | 1.4 |
| South of Market | 73 | 11 | 105.0% | 1.0 |
| Sunnyside | 11 | 14 | 139.0% | 1.5 |
| Sunset District | 42 | 13 | 118.0% | 0.9 |
| Telegraph Hill | 5 | 39 | 92.0% | 1.3 |
| Tenderloin | 4 | 6 | 103.0% | 1.0 |
| Twin Peaks | 5 | 16 | 93.0% | 1.7 |
| Visitacion Valley | 8 | 18 | 111.0% | 2.0 |
| Western Addition | 4 | 8 | 116.0% | 1.0 |
| San Francisco, CA | 529 | 13 | 111.5% | 1.0 |
For more information, contact
Redfin Journalist Services
Phone: 206-588-6863
Email: press@redfin.com
 United States
 Canada