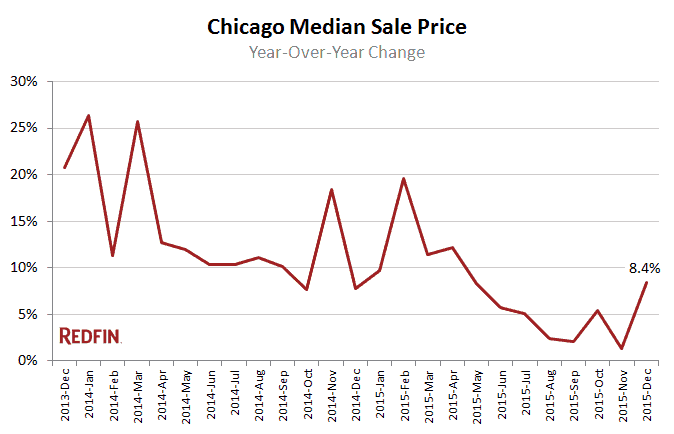
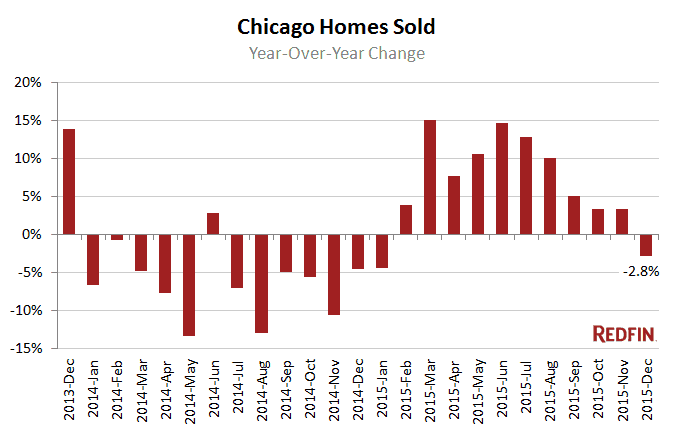
Chicago home prices were up 8.4 percent in December from a year earlier, with the typical home selling for $237,250. Sales fell 2.8 percent.
Prices soared in part because of a lack of inventory. The number of homes for sale fell 6.9 percent, the ninth-straight month of decline. Chicago had only 10,645 homes for sale last month, the fewest this decade.
A typical home sold in 30 days for 95 percent of the asking price. The supply of properties for sale dipped to 4.5 months, below the six months that signals a balanced market.
Hot Neighborhoods
Pullman had the sharpest price growth, up 117.5 percent, with a typical home selling for $87,000. The neighborhood had a banner year: it was formally designated a National Monument, businesses came to the area and plans are in the works for artists’ housing. Buyers are starting to notice: 32 percent of Pullman homes sold for more than list price.
The West Loop was the fastest market, with typical homes selling in 10 days for nearly exactly asking price. The tightest market for much of the year, a typical home in the condo-laden neighborhood runs for $365,000. Thirty-nine percent of West Loop homes sold for more than asking price.
Bucktown was the most expensive neighborhood, with a typical home selling at $569,500. Ukrainian Village, Lincoln Park and Roscoe Village were the only other neighborhoods with median home prices higher than $500,000.
See our city page for the most up-to-date data on Chicago home prices.
Here’s what’s happening in your neighborhood:
| Neighborhood | Median Sale Price | Year-Over-Year | Homes Sold | Year-Over-Year | Inventory | Year-Over-Year | New Listings | Median Days on Market | Avg Sale-to-List |
|---|---|---|---|---|---|---|---|---|---|
| Albany Park | $253,500 | 25.5% | 102 | 20.0% | 160 | -10.1% | 99 | 37 | 94.6% |
| Andersonville | $391,000 | -1.0% | 42 | 13.5% | 64 | -8.6% | 45 | 12 | 97.1% |
| Archer Heights | $178,900 | 12.9% | 28 | 0.0% | 35 | 34.6% | 30 | 15 | 96.4% |
| Austin | $85,000 | 9.7% | 117 | -5.6% | 255 | -9.6% | 190 | 28 | 98.8% |
| Avondale | $295,000 | -7.7% | 87 | -12.1% | 130 | -11.0% | 102 | 19 | 97.0% |
| Beverly | $250,662 | -7.2% | 52 | 18.2% | 120 | 13.2% | 79 | 27 | 92.7% |
| Bridgeport | $345,000 | 30.7% | 57 | -13.6% | 101 | -3.8% | 66 | 21 | 95.1% |
| Brighton Park | $143,500 | 13.9% | 61 | 24.5% | 79 | 21.5% | 57 | 35 | 93.8% |
| Bucktown | $569,500 | 15.8% | 76 | 5.6% | 72 | -20.9% | 76 | 16 | 96.8% |
| Clearing | $182,500 | 15.5% | 66 | -7.0% | 127 | 15.5% | 88 | 28 | 92.5% |
| Edgewater | $227,500 | 16.7% | 158 | 12.1% | 294 | -3.6% | 188 | 33 | 94.3% |
| Edison Park | $259,000 | -13.5% | 36 | 5.9% | 59 | -10.6% | 34 | 32 | 92.0% |
| Englewood | $20,000 | 5.3% | 39 | 14.7% | 181 | -17.4% | 91 | 36 | 101.2% |
| Garfield Ridge | $190,000 | 0.5% | 89 | -8.2% | 143 | -6.5% | 110 | 32 | 94.6% |
| Gold Coast | $287,000 | -1.9% | 138 | 4.5% | 284 | -6.0% | 171 | 30 | 94.2% |
| Humboldt Park | $221,500 | 18.2% | 154 | 6.9% | 258 | -1.1% | 195 | 19 | 97.4% |
| Hyde Park | $145,000 | -15.9% | 64 | 56.1% | 143 | -34.1% | 61 | 56 | 90.4% |
| Irving Park | $294,750 | 4.2% | 112 | -6.7% | 254 | 11.9% | 194 | 18 | 95.6% |
| Jefferson Park | $262,000 | 6.5% | 78 | -1.3% | 107 | -5.3% | 83 | 19 | 94.7% |
| Kenwood | $151,000 | 1.6% | 39 | -7.1% | 120 | -13.7% | 61 | 68 | 89.5% |
| Lincoln Park | $537,000 | 10.7% | 288 | -9.4% | 477 | -6.7% | 366 | 23 | 94.7% |
| Lincoln Square | $359,000 | 6.1% | 33 | -29.8% | 119 | 25.3% | 66 | 26 | 93.1% |
| Logan Square | $365,000 | 28.6% | 156 | 10.6% | 177 | -8.8% | 179 | 11 | 96.9% |
| McKinley Park | $166,450 | -0.3% | 26 | 36.8% | 44 | -6.4% | 30 | 38 | 91.9% |
| Montclare | $225,200 | 21.3% | 37 | -5.1% | 44 | -34.3% | 34 | 49 | 94.2% |
| Mount Greenwood | $193,000 | -7.7% | 44 | -13.7% | 76 | 0.0% | 55 | 33 | 94.5% |
| Near North Side | $403,531 | 3.1% | 568 | 7.8% | 1,083 | -0.8% | 661 | 34 | 95.5% |
| North Center | $475,000 | -15.8% | 71 | 42.0% | 94 | 1.1% | 81 | 13 | 96.0% |
| Old Town | $317,500 | -5.9% | 89 | 2.3% | 112 | -5.1% | 96 | 21 | 95.2% |
| Portage Park | $252,500 | 2.4% | 149 | -8.0% | 255 | 14.3% | 177 | 25 | 94.0% |
| Pullman | $87,000 | 117.5% | 19 | 0.0% | 29 | -31.0% | 22 | 29 | 100.5% |
| Ravenswood | $337,500 | -26.1% | 64 | 36.2% | 73 | 7.4% | 53 | 30 | 95.1% |
| Rogers Park | $164,700 | 7.5% | 108 | 1.9% | 237 | 11.3% | 143 | 28 | 93.7% |
| Roscoe Village | $535,000 | -0.9% | 67 | -17.3% | 120 | 36.4% | 111 | 14 | 96.2% |
| Sauganash | $405,000 | 26.0% | 32 | 33.3% | 73 | 58.7% | 50 | 33 | 93.1% |
| South Lawndale / Little Village | $99,000 | 23.8% | 40 | 17.6% | 81 | -5.8% | 56 | 34 | 98.6% |
| South Loop | $349,000 | -0.3% | 235 | 0.4% | 355 | 4.1% | 267 | 31 | 97.9% |
| South Shore | $60,977 | 34.0% | 85 | -18.3% | 258 | -17.6% | 122 | 42 | 94.9% |
| Streeterville | $490,000 | 16.0% | 131 | -13.2% | 320 | -10.1% | 159 | 54 | 94.5% |
| The Loop | $345,000 | -5.5% | 185 | 9.5% | 324 | -0.9% | 211 | 41 | 95.9% |
| Tri-Taylor | $248,000 | 70.1% | 15 | 36.4% | 28 | -24.3% | 15 | 51 | 91.9% |
| Ukrainian Village | $542,500 | 25.4% | 20 | -23.1% | 34 | -19.0% | 26 | 19 | 96.5% |
| Uptown | $233,500 | 15.9% | 142 | -6.6% | 270 | -23.5% | 172 | 27 | 94.1% |
| West Loop | $365,000 | 1.1% | 137 | 12.3% | 111 | -17.2% | 117 | 10 | 99.6% |
| West Town | $457,750 | 5.2% | 341 | -0.9% | 425 | -12.6% | 412 | 13 | 97.1% |
| Wicker Park | $480,300 | 0.7% | 105 | -6.3% | 122 | -17.6% | 118 | 12 | 96.8% |
| Chicago | $237,250 | 8.4% | 2,350 | -2.8% | 10,645 | -6.9% | 2,163 | 30 | 95.0% |
NOTE: Not all neighborhoods are listed, but totals for Chicago encompass entire city. Data is based on listing information and might not reflect all real estate activity in the market. Neighborhood-specific data is measured over the three months ended Dec. 31. Inventory measures listings active as of Dec. 31.
For more information, contact Redfin journalist services
Phone: 206-588-6863
Email: press@redfin.com
To be added to Redfin’s press release distribution list, please click here.
 United States
 Canada