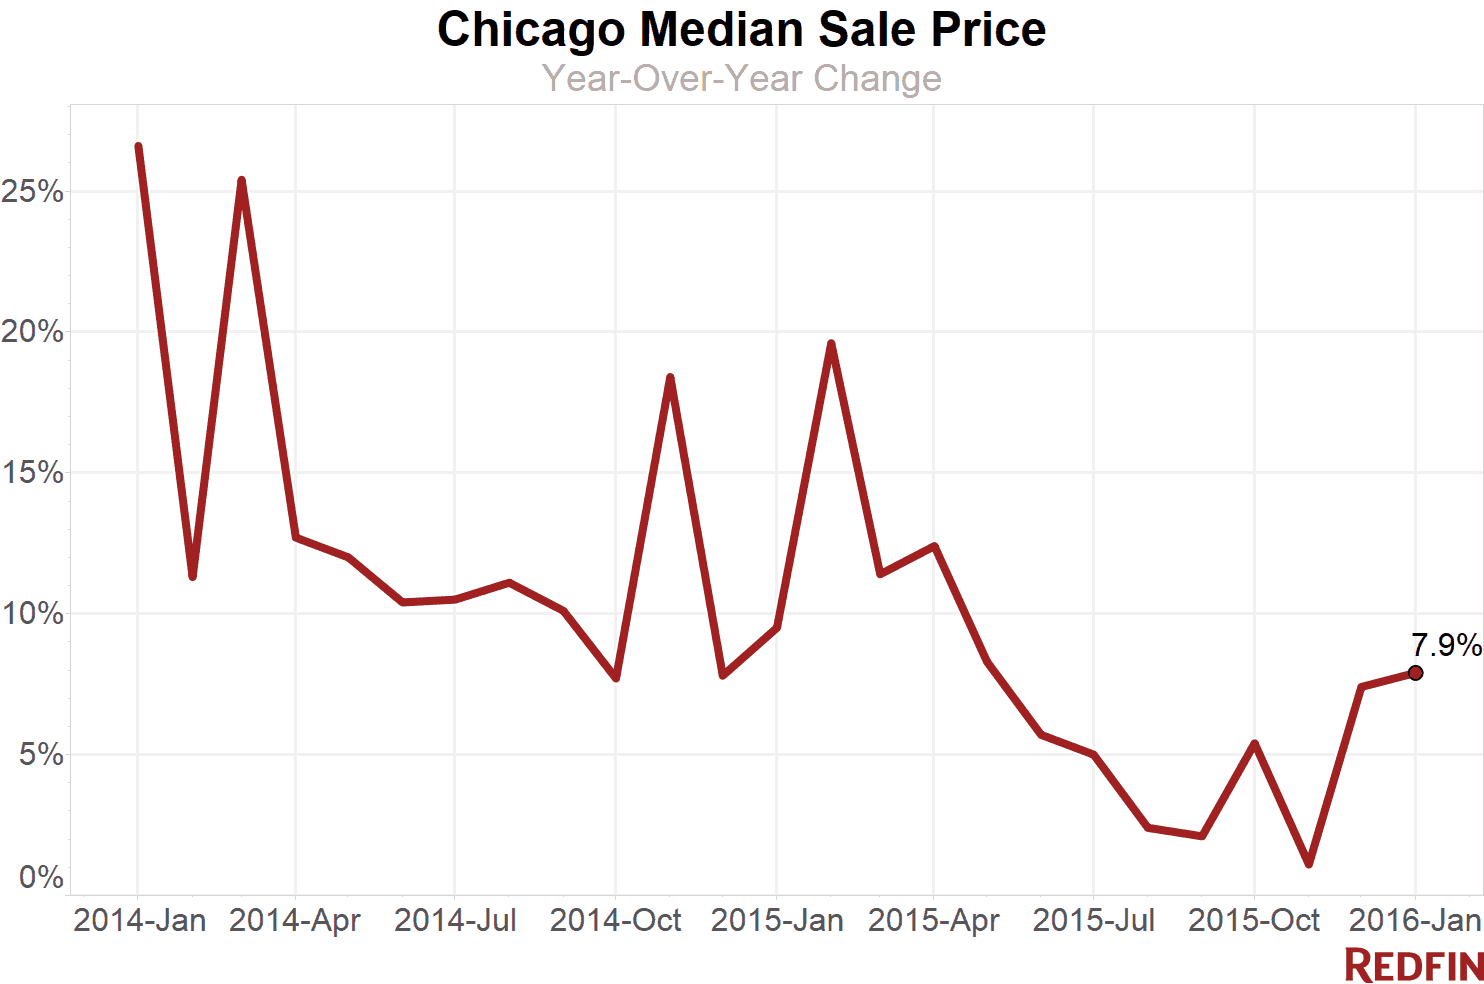
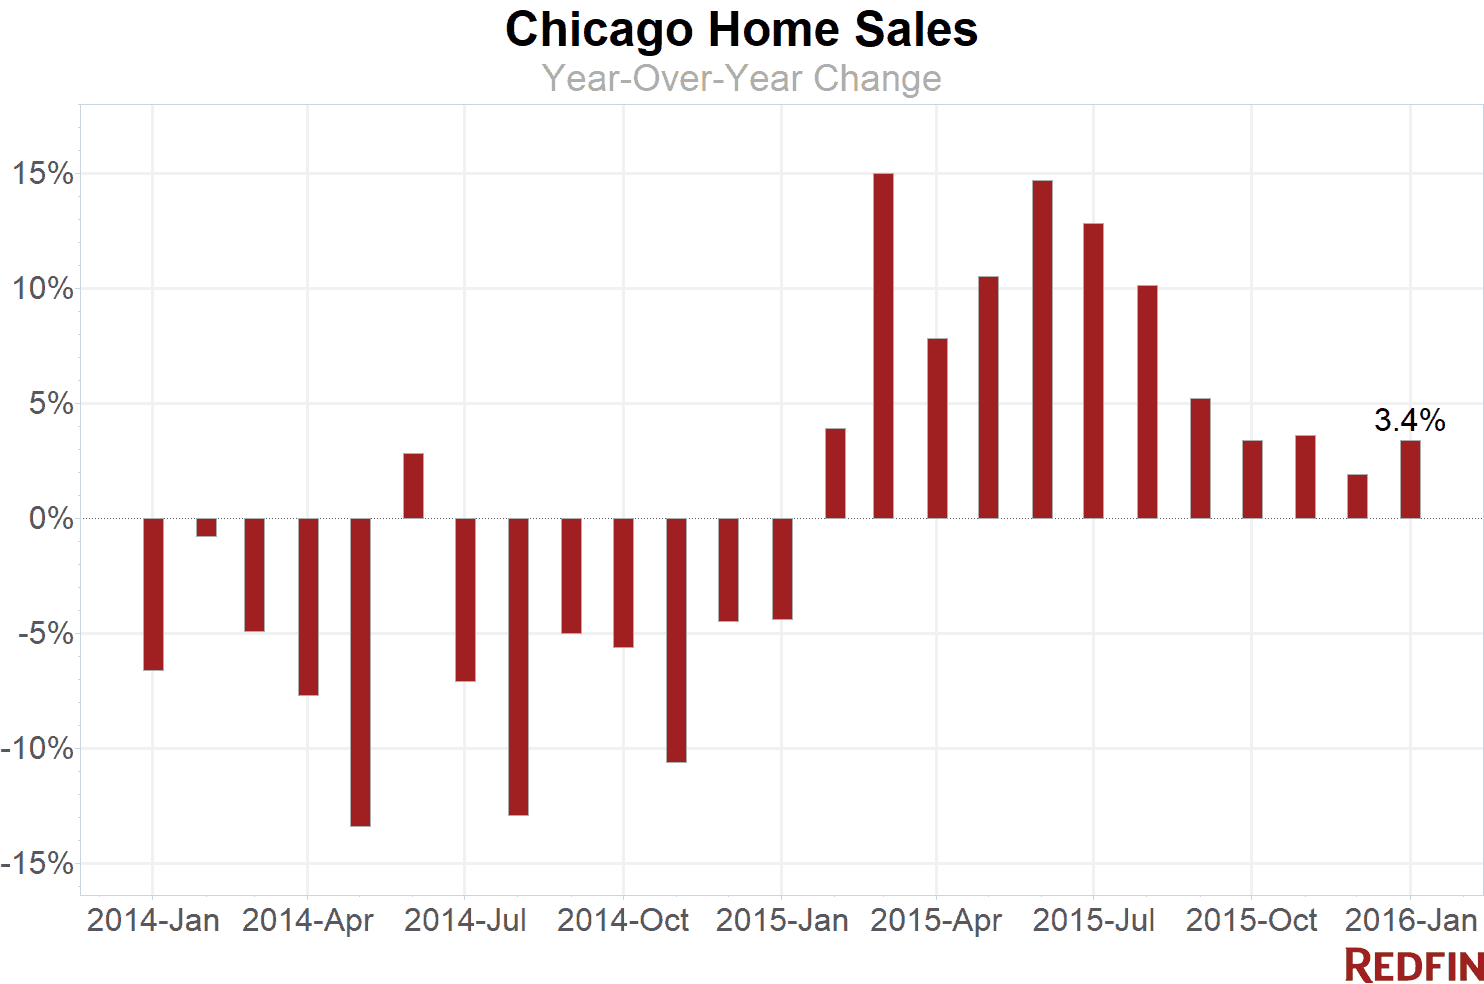
Chicago home prices were up 7.9 percent in January compared to last year, with the typical home selling for $224,500. Sales rose 3.4 percent.
The nearly six-month supply of homes for sale was the highest in a year and signaled a balance of power between buyers and sellers. That equilibrium might be short-lived, however. There were just 9,933 homes for sale in January, less than a 1 percent increase over a year ago. It was only the third time in 22 months that inventory has fallen below 10,000. The previous three Januaries have had similarly low inventory and balanced supply, only for supply to plummet by the middle of the year.
Already, agents are seeing steep competition and a shortage of high-quality choices. It’s not unusual for 20 buyers to make offers on a single home within days of it going up for sale.
“Sellers are pricing above what comparable recent sales would suggest is fair and they’re getting their price,” Redfin real estate agent Niko Voutsinas said. “Sellers of dilapidated homes are doing very well, since land in many cases is more valuable than the house and development in hotter neighborhoods is on the rise.”
In January, a typical Chicago home sold in 36 days. Sixteen percent of homes sold for more than sellers were asking.
Hot Neighborhoods
Continuing a trend set in 2015, Tri-Taylor had the sharpest year-over-year price growth last month, a whopping 91.1 percent, mostly due to new construction. A typical Tri-Taylor home sold for $290,000. Edgewater had the city’s second-biggest gain, 37.9 percent, to a median sale price of $245,550.
“Edgewater is the next step north from Andersonville, but more affordable with larger spaces,” said Redfin real estate agent Danielle Inendino. “First-time buyers who rented in the neighborhood are choosing to stay. The relatively low price point, fantastic access to Lake Michigan, several nearby Red Line stations and variety of dining options make it very appealing.”
Other neighborhoods with significant price gains include South Lawndale/Little Village (32.7%), Montclare (29.4%), Sauganash (27.6%) and Logan Square (27.2%).
Ravenswood showed the largest drop, with prices down 28.6 percent. West Loop was the fastest market, with homes selling in only 12 days. Roscoe Village was second, at 14 days.
Bucktown was the city’s most expensive neighborhood, with a median sale price of $560,000, followed by Roscoe Village at $535,000. Only two others–Ukranian Village and North Center–had median prices of more than $500,000.
See our city page for the most up-to-date data on Chicago home prices.
Here’s what’s happening in your neighborhood:
| Neighborhood | Median Sale Price | Year-Over-Year | Homes Sold | Year-Over-Year | Inventory | Year-Over-Year | New Listings | Median Days on Market | Avg Sale-to-List |
|---|---|---|---|---|---|---|---|---|---|
| Albany Park | $250,000 | 26.9% | 101 | 27.8% | 92 | -9.8% | 88 | 45 | 94.4% |
| Andersonville | $404,225 | -6.5% | 40 | 37.9% | 44 | -6.4% | 48 | 19 | 95.8% |
| Archer Heights | $165,000 | -1.5% | 27 | 12.5% | 23 | 53.3% | 22 | 15 | 96.8% |
| Austin | $80,000 | -3.0% | 127 | 13.4% | 143 | -5.3% | 183 | 33 | 96.7% |
| Avondale | $290,000 | -12.1% | 73 | -24.7% | 69 | -9.2% | 92 | 22 | 97.0% |
| Beverly | $231,750 | -0.3% | 56 | 64.7% | 80 | 23.1% | 71 | 28 | 93.5% |
| Bridgeport | $345,000 | 17.7% | 51 | -15.0% | 65 | 10.2% | 56 | 33 | 94.5% |
| Brighton Park | $143,750 | 7.7% | 54 | 28.6% | 40 | -11.1% | 56 | 28 | 93.8% |
| Bucktown | $560,000 | 13.4% | 71 | 6.0% | 56 | 5.7% | 69 | 21 | 96.2% |
| Clearing | $189,000 | 22.7% | 61 | -6.2% | 67 | -8.2% | 76 | 20 | 93.9% |
| Edgewater | $245,550 | 37.9% | 146 | 0.7% | 190 | 1.6% | 181 | 36 | 93.7% |
| Edison Park | $260,000 | -16.1% | 25 | -35.9% | 36 | -14.3% | 30 | 22 | 91.7% |
| Englewood | $20,000 | -5.4% | 36 | 28.6% | 93 | -19.8% | 91 | 58 | 94.8% |
| Garfield Ridge | $175,000 | -3.5% | 91 | 13.8% | 109 | 38.0% | 103 | 27 | 94.2% |
| Gold Coast | $342,500 | 26.3% | 117 | -0.8% | 180 | -6.7% | 152 | 34 | 92.9% |
| Humboldt Park | $185,000 | -8.6% | 131 | -4.4% | 162 | 7.3% | 185 | 25 | 98.6% |
| Hyde Park | $167,500 | 17.3% | 60 | 66.7% | 79 | -32.5% | 54 | 78 | 90.0% |
| Irving Park | $267,864 | -0.1% | 122 | 6.1% | 168 | 20.9% | 174 | 30 | 94.8% |
| Jefferson Park | $246,900 | 0.8% | 71 | 26.8% | 70 | 11.1% | 84 | 21 | 94.1% |
| Kenwood | $200,000 | 4.2% | 29 | 0.0% | 58 | -9.4% | 56 | 52 | 91.7% |
| Lincoln Park | $497,500 | -1.5% | 242 | -8.3% | 283 | -3.7% | 308 | 29 | 94.2% |
| Lincoln Square | $340,000 | -2.9% | 31 | -31.1% | 75 | 56.3% | 66 | 49 | 92.5% |
| Logan Square | $384,000 | 27.2% | 138 | 9.5% | 117 | 9.3% | 170 | 15 | 96.9% |
| McKinley Park | $188,000 | 20.9% | 31 | 93.8% | 22 | -8.3% | 36 | 43 | 96.5% |
| Montclare | $220,000 | 29.4% | 31 | -20.5% | 25 | -40.5% | 28 | 36 | 93.4% |
| Mount Greenwood | $194,611 | -6.9% | 36 | -16.3% | 55 | 31.0% | 54 | 28 | 95.1% |
| Near North Side | $410,000 | 0.0% | 501 | 5.9% | 710 | 3.6% | 689 | 42 | 94.8% |
| North Center | $512,500 | -1.9% | 56 | 24.4% | 77 | 28.3% | 78 | 15 | 96.2% |
| Old Town | $372,500 | 14.1% | 80 | 14.3% | 69 | 1.5% | 82 | 33 | 94.1% |
| Portage Park | $254,000 | 0.2% | 132 | -1.5% | 143 | 23.3% | 152 | 29 | 92.6% |
| Pullman | $59,000 | 21.6% | 15 | -11.8% | 18 | -21.7% | 20 | 18 | 101.8% |
| Ravenswood | $321,250 | -28.6% | 52 | 26.8% | 49 | 2.1% | 59 | 34 | 95.4% |
| Rogers Park | $159,750 | 6.5% | 98 | 16.7% | 149 | 14.6% | 138 | 32 | 94.1% |
| Roscoe Village | $535,000 | 12.6% | 57 | -12.3% | 104 | 92.6% | 114 | 14 | 96.2% |
| Sauganash | $405,000 | 27.6% | 28 | 33.3% | 45 | 80.0% | 39 | 37 | 92.4% |
| South Lawndale / Little Village | $91,750 | 32.7% | 40 | 5.3% | 46 | -9.8% | 48 | 34 | 97.3% |
| South Loop | $346,000 | 3.3% | 207 | 3.0% | 249 | 31.7% | 277 | 35 | 98.0% |
| South Shore | $56,000 | 11.0% | 67 | -29.5% | 136 | -6.2% | 126 | 56 | 92.7% |
| Streeterville | $480,000 | 5.5% | 121 | 3.4% | 205 | -7.2% | 160 | 63 | 94.3% |
| The Loop | $345,000 | 2.5% | 146 | -5.2% | 224 | 26.6% | 213 | 44 | 96.0% |
| Tri-taylor | $290,000 | 91.1% | 15 | 25.0% | 13 | -31.6% | 14 | 71 | 93.7% |
| Ukrainian Village | $534,000 | 2.4% | 22 | -8.3% | 23 | -20.7% | 27 | 15 | 95.9% |
| Uptown | $237,500 | 15.9% | 129 | -1.5% | 174 | -8.9% | 185 | 30 | 93.9% |
| West Loop | $362,750 | 0.8% | 112 | 5.7% | 96 | 3.2% | 140 | 12 | 99.2% |
| West Town | $460,000 | 3.7% | 290 | -6.1% | 315 | 24.0% | 408 | 16 | 97.2% |
| Wicker Park | $491,750 | -1.7% | 84 | -16.0% | 84 | 21.7% | 109 | 20 | 96.5% |
| Chicago, IL | $224,500 | 7.9% | 1,692 | 3.4% | 9,933 | 0.6% | 3,774 | 36 | 95.2% |
For more information, contact Redfin journalist services
Phone: 206-588-6863
Email: press@redfin.com
To be added to Redfin’s press release distribution list, subscribe here.
 United States
 Canada