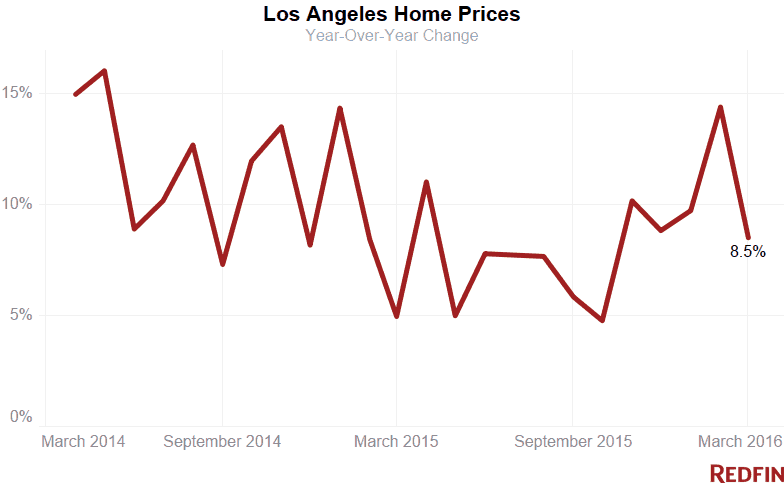
Home prices in the city of Los Angeles rose 8.5 percent in March from a year earlier, to a median $575,000. L.A. continues to have some of the strongest annual price growth in the country, coming in at nearly double the national median of 4.7 percent.
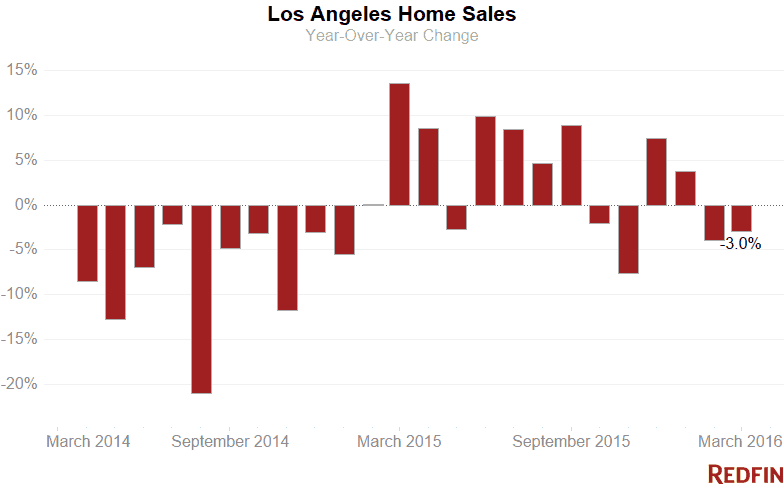
Year over year, L.A. home sales fell 3 percent, retreating from a two-year peak hit in March 2015. Compared to February, however, March sales spiked 38 percent, the biggest month-over-month increase in five years.
“February was the calm before the storm,” Redfin real estate agent Sylva Khayalian said. “I saw overwhelming activity from sellers and buyers in March. While fresh inventory is coming on line from confident sellers, it’s simply not enough to satisfy buyer demand. Intense bidding wars are once again the norm.”
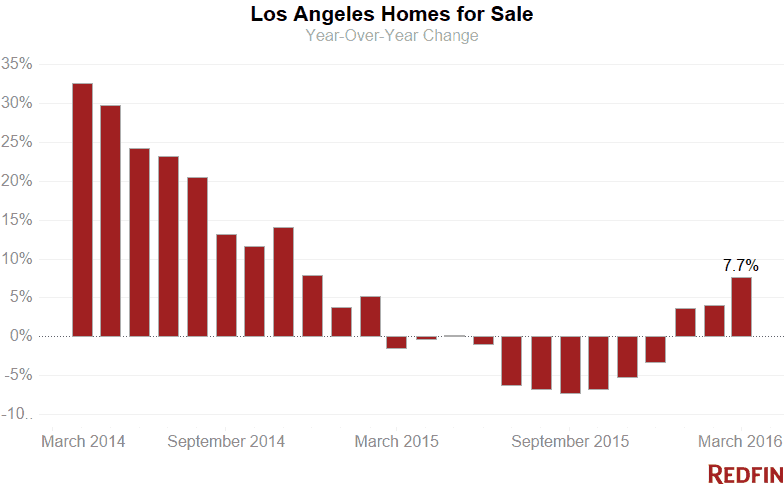
The stockpile of homes for sale grew for the third-straight month, up 7.7 percent from a year ago, buoyed by an 11 percent bump in new listings compared to last year. That wasn’t enough to meet buyer demand, however, as the supply of properties fell from 3.5 months in February to 2.6 in March, less than the six months of inventory that signals a balanced market.
Area Trends and Hot Neighborhoods
Up 17 percent from a year earlier, home prices on the Westside hit $1.2 million in March, making the Westside as expensive as San Francisco. The Westside’s price jump was driven by rapid gains in nearby Beverly Hills, Santa Monica and Venice, where sale prices were up by about 30 percent.
The most competitive neighborhoods were once again concentrated on the Eastside. Nearly 70 percent of sellers in Mount Washington fetched more than their asking price and the typical home sold in 23 days, almost twice as fast as a year ago.
In Eagle Rock and Silver Lake, more than half of homes sold for more than sellers were asking, sending median sale prices up by double digits.
The Valley had strong inventory gains, with affordable neighborhoods such as Pacoima, Northridge and North Hollywood adding significant numbers of homes for sale. That’s good news for first-time buyers who have been priced out of the East- and Westsides.
Closer to the urban core, the typical home in West Adams sold for just above $500,000, but competition was fierce. Homes sold in 17 days, with 65 percent going for more than the asking price.
Here’s what’s happening in your neighborhood:
| Place | Median Sale Price | Year-Over-Year | Homes Sold | Year-Over-Year | Inventory | Year-Over-Year | New Listings | Median Days on Market | Avg Sale-to-List |
|---|---|---|---|---|---|---|---|---|---|
| Beverly Glen | $1,475,000 | 34.1% | 11 | -21.4% | 20 | -16.7% | 28 | 60 | 97.1% |
| Beverly Hills Post Office | $1,942,500 | 34.2% | 32 | -27.3% | 82 | -1.2% | 88 | 40 | 97.4% |
| Brentwood | $1,325,000 | 12.3% | 100 | 19.1% | 115 | 0.9% | 162 | 37 | 99.8% |
| Central LA | $893,800 | 9.7% | 742 | -6.3% | 896 | 8.9% | 1,314 | 41 | 98.6% |
| Century City | $989,500 | 15.7% | 72 | 16.1% | 66 | -17.5% | 125 | 32.5 | 99.8% |
| Chatsworth | $510,000 | 6.7% | 85 | -19.8% | 87 | 11.5% | 148 | 38 | 98.8% |
| Cheviot Hills | $1,690,000 | 16.2% | 19 | -9.5% | 18 | 50.0% | 27 | 28 | 97.1% |
| Crenshaw | $642,000 | 38.8% | 34 | -10.5% | 19 | -5.0% | 41 | 26 | 99.1% |
| Downtown | $635,000 | 11.4% | 58 | -43.1% | 127 | 44.3% | 146 | 55 | 98.1% |
| Eagle Rock | $745,250 | 15.5% | 60 | 46.3% | 38 | 0.0% | 82 | 18 | 102.4% |
| East LA | $639,900 | 16.4% | 495 | 5.1% | 438 | 3.5% | 791 | 27 | 101.5% |
| Encino | $796,250 | 19.7% | 162 | 3.2% | 181 | 4.6% | 252 | 36 | 99.1% |
| Fox Hills | $432,000 | 0.7% | 20 | -35.5% | 8 | -20.0% | 22 | 21 | 99.6% |
| Glassell Park | $680,000 | 23.8% | 33 | -8.3% | 27 | -6.9% | 50 | 28 | 100.7% |
| Greater Echo Park Elysian | $870,000 | 15.2% | 55 | 41.0% | 54 | 3.8% | 80 | 37.5 | 101.5% |
| Hancock Park | $2,790,000 | 74.3% | 13 | 8.3% | 30 | 87.5% | 39 | 30 | 99.4% |
| Highland Park | $585,000 | -1.5% | 57 | -18.6% | 52 | -26.8% | 103 | 26 | 100.8% |
| Hollywood | $724,500 | -5.9% | 62 | 10.7% | 80 | 14.3% | 106 | 45 | 97.9% |
| Hollywood Hills West | $1,187,500 | 1.6% | 104 | 18.2% | 127 | -12.4% | 169 | 46 | 98.0% |
| Holmby Hills | $892,812 | -54.2% | 4 | -50.0% | 19 | 58.3% | 20 | 35.5 | 96.3% |
| Koreatown / Wilshire Center | $602,500 | 14.3% | 80 | -22.3% | 129 | 14.2% | 185 | 36 | 99.6% |
| Lake Balboa | $485,000 | 10.3% | 77 | 1.3% | 55 | 14.6% | 110 | 28 | 100.3% |
| Malibu | $1,777,000 | -15.9% | 29 | 11.5% | 200 | -8.3% | 59 | 112 | 95.3% |
| Marina del Rey | $793,000 | -4.8% | 62 | -6.1% | 55 | -24.7% | 99 | 45.5 | 98.6% |
| Mid-City | $850,000 | 18.1% | 111 | -14.0% | 121 | 7.1% | 215 | 29.5 | 99.7% |
| Mid-Wilshire | $850,000 | 7.4% | 319 | -8.9% | 406 | 16.3% | 627 | 35 | 99.3% |
| Mount Washington | $795,000 | 16.4% | 19 | -32.1% | 16 | -5.9% | 35 | 23 | 108.1% |
| North Hollywood | $485,000 | 12.0% | 126 | 8.6% | 111 | 27.6% | 199 | 33.5 | 99.7% |
| North Valley | $455,000 | 8.3% | 979 | -1.5% | 842 | 21.3% | 1,611 | 31 | 99.4% |
| Northridge | $580,000 | 17.2% | 111 | 15.6% | 91 | 33.8% | 158 | 27 | 98.0% |
| Northwest San Pedro | $499,000 | 13.0% | 69 | 4.5% | 60 | -21.1% | 92 | 54 | 98.5% |
| Pacific Palisades | $2,600,000 | 2.1% | 83 | 6.4% | 106 | 15.2% | 147 | 27 | 98.7% |
| Pacoima | $343,000 | 5.7% | 63 | 1.6% | 49 | 75.0% | 113 | 14 | 100.5% |
| Panorama City | $368,000 | 9.8% | 55 | -15.4% | 55 | 25.0% | 97 | 35.5 | 100.6% |
| Pasadena | $730,000 | 8.3% | 138 | -6.8% | 298 | -7.2% | 198 | 29 | 99.7% |
| Santa Monica | $1,602,485 | 31.4% | 54 | -22.9% | 145 | 2.8% | 85 | 22 | 100.3% |
| Sherman Oaks | $824,437 | 26.8% | 186 | -8.4% | 218 | 32.9% | 323 | 44 | 98.5% |
| Silver Lake | $1,005,000 | 12.3% | 59 | 5.4% | 43 | 65.4% | 79 | 25 | 102.3% |
| South Central LA | $359,450 | 10.6% | 190 | 24.2% | 200 | -18.4% | 315 | 40 | 100.0% |
| South LA | $386,000 | 10.6% | 801 | 9.0% | 848 | -4.5% | 1,301 | 37 | 99.7% |
| South Valley | $545,025 | 8.6% | 1,361 | -4.8% | 1,371 | 20.4% | 2,218 | 37 | 99.2% |
| Studio City | $900,000 | 22.2% | 123 | -1.6% | 145 | 31.8% | 193 | 55.5 | 98.1% |
| Sun Valley | $440,000 | 14.3% | 59 | -14.5% | 48 | 14.3% | 99 | 34 | 98.2% |
| Sylmar | $400,000 | 8.1% | 128 | 12.3% | 107 | 23.0% | 195 | 28 | 99.1% |
| Tarzana | $580,000 | 1.8% | 121 | -3.2% | 124 | 14.8% | 184 | 35 | 99.3% |
| Valley Village | $643,000 | -11.3% | 45 | -4.3% | 50 | 100.0% | 87 | 34 | 99.1% |
| Van Nuys | $478,900 | 12.7% | 85 | -20.6% | 91 | 7.1% | 146 | 43 | 99.0% |
| Venice | $1,825,000 | 25.9% | 81 | -16.5% | 109 | -3.5% | 138 | 40 | 98.1% |
| Watts | $287,500 | 15.0% | 58 | 13.7% | 77 | 2.7% | 113 | 47.5 | 98.6% |
| West Adams | $530,000 | 17.9% | 37 | 2.8% | 22 | -33.3% | 47 | 17 | 103.5% |
| West Long Beach | $355,100 | 5.2% | 35 | 9.4% | 27 | -18.2% | 47 | 43 | 98.9% |
| West Los Angeles | $1,200,000 | 16.8% | 1,220 | -6.6% | 1,349 | 1.4% | 2,052 | 29 | 99.3% |
| Westwood | $915,000 | 5.5% | 87 | -1.1% | 121 | 3.4% | 179 | 22 | 98.6% |
| Woodland Hills | $660,000 | 2.3% | 181 | -5.7% | 193 | 27.0% | 320 | 37 | 98.7% |
| Los Angeles, CA | $575,000 | 8.5% | 2,379 | -3.0% | 6,165 | 7.6% | 3,789 | 31 | 100.0% |
See Redfin’s data center to find out what’s happening in other cities.
NOTE: Not all neighborhoods are listed, but totals for L.A. encompass entire city. Data is based on listing information and might not reflect all real estate activity in the market. Neighborhood-specific data is measured over the three months ended March 31. Inventory measures listings active as of March 31.
For more information, contact Redfin journalist services
Phone: 206-588-6863
Email: press@redfin.com
To be added to Redfin’s press release distribution list, please click here.
 United States
 Canada