| Market Summary | April 2016 | Month-Over-Month | Year-Over-Year |
|---|---|---|---|
| Median sale price | $263,900 | 3.8% | 4.8% |
| Homes sold | 233,500 | 7.7% | 2.5% |
| New listings | 350,500 | 1.9% | -1.1% |
| All Homes for sale | 826,100 | 4.2% | -3.2% |
| Median days on market | 47 | -11 | -9 |
| Months of supply | 3.5 | -0.2 | -0.2 |
| Sold above list | 22.5% | 1.6% | 1.2% |
| Average Sale-to-list | 95.0% | -2.8% | -2.8% |
Home sales increased 2.5 percent and the median sale price increased 4.8 percent in April, the third month price growth trended below the 12-month average of 5.6 percent.
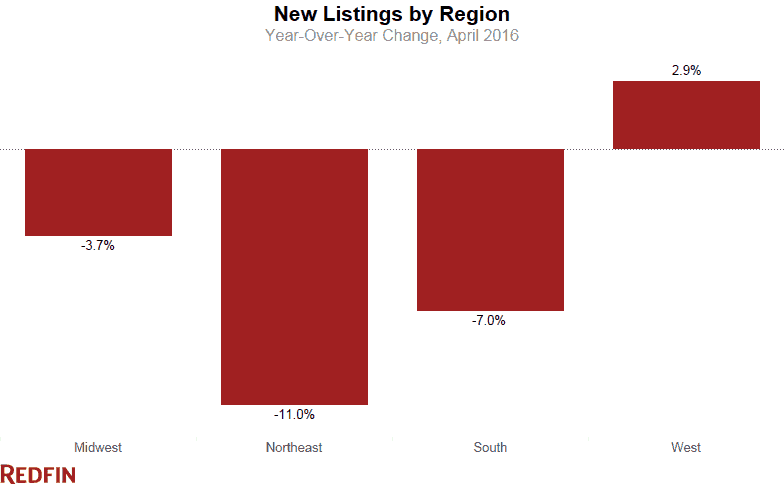
Overall home inventory continued to decline for the seventh month with a 3.2 percent year-over-year drop. What stood out in April was a 1.1 percent year-over-year decline in new listings for the first time since August 2014. The retreat in listings growth was widespread, with nearly two-thirds of Redfin markets seeing fewer new listings than the same time last year. The largest declines were concentrated in the Northeast, with Boston, New York and Philadelphia seeing year-over-year declines of more than 10 percent.
“Nearly all of Eastern Massachusetts is seeing bidding wars, and hot homes are scooped up two to three days after an open house. I can’t remember the last time we saw this across the board,” said Redfin agent Peter Phinney in Boston. “Competition is good for sellers in one way, but the other side of the coin is that sellers are afraid they can’t find something to move to. Moving up in the same geography is not the simple task it once was when you have to combat 10 other buyers for a desirable home. I think this situation is in large part what has caused the inventory shortage.”
In Philadelphia, Redfin agent Tom Lewis has noticed a similar trend among would-be sellers waiting to list until they find a home to buy.
“Trade-up buyers seem to be losing their mojo heading into the heart of the spring selling season,” said Redfin chief economist Nela Richardson. “Repeat buyers tend to list early because they are most often also looking for another home to buy in the near future. A slowdown in new listings reflects a lack of confidence on the part of the homeowner that they can find a desirable home to purchase. This triggers a domino effect down the supply chain that leads to lower sales in tight markets. West coast cities, like, Denver, Portland and Seattle were prime examples of this in April.”
Nearly Every Market in the West Saw a Decline in Home Sales
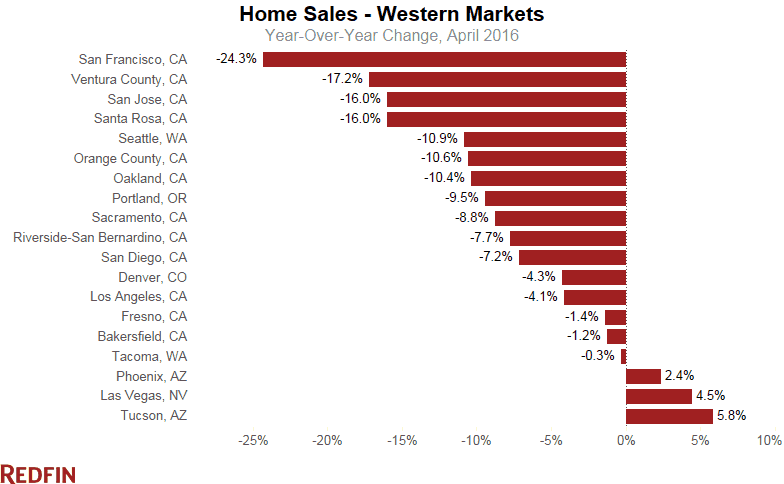
April home sales in many West Coast market saw a year-over-year decline. In Seattle, Portland and Denver, arguably the hottest housing markets in the country, overall inventory remains at historic lows and, while demand has continued to increase, new listings have not. This has led to the most competitive conditions we’ve tracked in these markets, with homes selling faster than anywhere else (8 days), and with the lowest months of supply (1.2) of any market in April. Bidding wars reached their highest level on record in Seattle in April with 77.9 percent of Redfin agents’ offers facing competition, while Portland surged from 58.1 to 68.5 percent, and Denver also ticked up to 66.7 percent. But the lack of growth in listings has begun to constrain sales even with demand as strong as it’s been in years.
With a shock to tech stocks in 2016 and homes priced well over a million dollars, we have started to see fewer buyers ready to do what it takes to buy a home in San Francisco, where home sales have fallen for the second month in a row. There we’ve seen some of the largest increases in inventory and lowest price growth in years, with the majority of that new inventory concentrated in new high-end condos that are now coming on the market. San Francisco homes are still the most expensive (the median sale price in April stood at $1.2 million) and sell for more above list than anywhere in the country, but each month in 2016 has seen year-over-year price increases of less than 10 percent, levels not seen since 2012. The rate of Redfin offers facing bidding wars in San Francisco also fell from 89 percent last year to 82 percent in April.
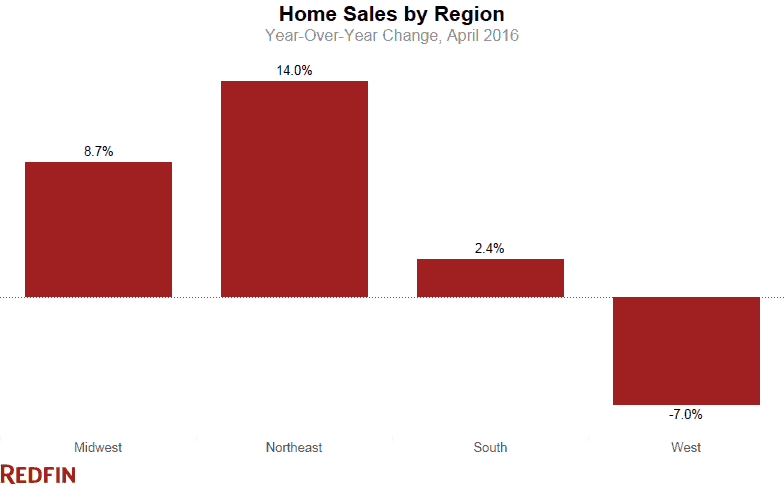
Despite the mixed picture in the West, sales in all other regions were up year over year, with the Northeast region including Boston (+17.5%,) Providence (+18.7%), and New York (+14.7% in Hudson Valley) seeing the highest growth.
Other April Highlights
Prices
- Providence, RI led the country in price growth, where the median sale price increased by 17.6% year over year to $226,000, followed by Akron, OH (+15.8% to $123,300) and Portland, OR (+15.1% to $337,000).
- In New York, prices fell by 5.1% to $195,000 in Poughkeepsie and 2.8% to $177,500 in Albany. Tulsa, OK was the only other metro region where prices declined year over year, by 4.2% to $145,600.
- Florida saw high price growth across the board, with Deltona, Fort Lauderdale, Fort Myers, Orlando, and West Palm Beach all seeing double-digit price growth averaging 13.9% year over year. Prices in Miami increased by 8.2% to $250,000.
Sales
- In Tennessee, both Memphis (+ 32.6%) and Nashville (+31.1%) saw the highest rates of home sales growth in the country.
- West Coast markets continued to see a notable decline in sales year over year, with San Francisco (-24.3%), Ventura County, CA (-17.2%), San Jose (-16%), Santa Rosa (-16%), Seattle (-10.9%), Orange County (-10.6%), Oakland (-10.4%), Portland (-9.5%), Sacramento (-8.8%), San Diego (-7.2%), Denver (-4.3%), and Los Angeles (-4.1%) seeing lower home sales year over year.
Inventory
- San Francisco saw the largest year-over-year increase in inventory since February of 2010, up 31.1% to 2,283.
- Active inventory in San Jose was 48.9% higher than the same time last year, the largest increase we’ve seen in the region.
- Months of supply was lowest in Seattle at 1.2, followed by Oakland and Denver at 1.3.
Competition
- Portland and Seattle were the fastest markets, with half of all new listings selling in 8 days or less. Denver was the third fastest where the median days on market was 10.
- San Francisco and San Jose had the highest sale-to-list percentage, with homes selling on average for 107% and 104.8% of the asking price. But both of these regions also had the largest year-over-year decline in that figure, indicating that the cooling trend in the Bay Area is continuing.
- Seattle saw the largest increase in the average sale-to-list percentage, up 1.9% to 102.9%, which was the highest level we’ve recorded in that market. Portland also reached a recorded high of 101.6% average sale-to-list price.
You can download data from the March Market Tracker in an Excel spreadsheet. The tables that follow feature Redfin’s largest metro regions. For all of our data coverage, visit the Data Center.
For additional local analysis, see: Chicago, Los Angeles, San Francisco, Miami and Washington, D.C.
Median Sale Price
| Redfin Metro | Median Sale Price | Month-Over-Month | Year-Over-Year |
|---|---|---|---|
| Atlanta, GA | $204,250 | 6.4% | 9.2% |
| Baltimore, MD | $245,000 | 2.1% | 6.7% |
| Boston, MA | $360,000 | 5.9% | 7.1% |
| Chicago, IL | $229,000 | 9.1% | 14.5% |
| Cleveland, OH | $127,500 | 10.9% | 10.9% |
| Dallas-Fort Worth, TX | $227,990 | 1.4% | 8.6% |
| Denver, CO | $345,000 | 0.6% | 9.5% |
| Detroit, MI | $151,500 | 8.2% | 10.6% |
| Edison, NJ | $270,000 | 3.8% | 0.0% |
| Houston, TX | $217,875 | 2.5% | 6.2% |
| Kansas City, MO | $180,950 | 5.3% | 3.4% |
| Las Vegas, NV | $205,000 | 2.5% | 5.1% |
| Long Island, NY | $375,000 | 1.4% | 0.3% |
| Los Angeles, CA | $530,000 | 2.7% | 7.2% |
| Miami, FL | $250,000 | 5.0% | 8.2% |
| Minneapolis-St. Paul, MN | $230,000 | 5.0% | 7.0% |
| Oakland, CA | $625,000 | 5.9% | 5.0% |
| Orange County, CA | $628,500 | 4.4% | 6.9% |
| Orlando, FL | $193,562 | 1.3% | 13.0% |
| Philadelphia, PA | $225,000 | 4.7% | 4.7% |
| Phoenix, AZ | $225,000 | 2.3% | 9.8% |
| Pittsburgh, PA | $145,750 | 8.0% | 5.7% |
| Portland, OR | $337,000 | 3.7% | 15.1% |
| Riverside-San Bernardino, CA | $314,000 | 1.3% | 6.8% |
| Sacramento, CA | $331,000 | 0.3% | 6.0% |
| San Antonio, TX | $195,000 | 0.0% | 5.4% |
| San Diego, CA | $500,000 | 2.7% | 8.7% |
| Seattle, WA | $429,950 | 2.3% | 7.5% |
| St. Louis, MO | $162,500 | 1.6% | 1.6% |
| Tampa, FL | $179,000 | 2.3% | 12.6% |
| Washington, DC | $369,000 | 2.5% | 0.5% |
| National | $263,900 | 3.8% | 4.8% |
Homes Sold
| Redfin Metro | Homes Sold | Month-Over-Month | Year-Over-Year |
|---|---|---|---|
| Atlanta, GA | 8,358 | 2.7% | 1.2% |
| Baltimore, MD | 3,336 | 12.0% | 4.2% |
| Boston, MA | 4,593 | 10.7% | 17.5% |
| Chicago, IL | 10,319 | 17.5% | 5.3% |
| Cleveland, OH | 2,270 | 8.1% | 13.3% |
| Dallas-Fort Worth, TX | 7,533 | 32.4% | 1.1% |
| Denver, CO | 4,409 | 5.0% | -4.3% |
| Detroit, MI | 5,277 | -1.5% | 11.0% |
| Edison, NJ | 2,042 | 23.2% | 31.8% |
| Houston, TX | 6,497 | -0.3% | 6.4% |
| Kansas City, MO | 2,846 | 9.5% | 4.2% |
| Las Vegas, NV | 3,471 | 2.3% | 4.5% |
| Long Island, NY | 1,658 | -13.4% | -1.1% |
| Los Angeles, CA | 6,412 | 4.1% | -4.1% |
| Miami, FL | 2,610 | 1.2% | -16.6% |
| Minneapolis-St. Paul, MN | 5,732 | 36.6% | 25.1% |
| Oakland, CA | 2,313 | 12.4% | -10.4% |
| Orange County, CA | 2,742 | 5.7% | -10.6% |
| Orlando, FL | 3,590 | 2.5% | -6.5% |
| Philadelphia, PA | 3,730 | 13.9% | 9.4% |
| Phoenix, AZ | 8,408 | 2.3% | 2.4% |
| Pittsburgh, PA | 1,927 | 22.0% | 13.5% |
| Portland, OR | 3,322 | -1.8% | -9.5% |
| Riverside-San Bernardino, CA | 4,719 | -0.9% | -7.7% |
| Sacramento, CA | 2,746 | 6.8% | -8.8% |
| San Antonio, TX | 2,153 | -5.8% | -5.7% |
| San Diego, CA | 3,334 | 8.7% | -7.2% |
| Seattle, WA | 3,940 | 3.1% | -10.9% |
| St. Louis, MO | 2,806 | 3.5% | 9.6% |
| Tampa, FL | 5,373 | 5.6% | 0.9% |
| Washington, DC | 7,264 | 17.3% | 7.1% |
| National | 233,500 | 7.7% | 2.5% |
New Listings
| Redfin Metro | New Listings | Month-Over-Month | Year-Over-Year |
|---|---|---|---|
| Atlanta, GA | 12,213 | -0.2% | 1.7% |
| Baltimore, MD | 5,882 | 4.1% | -0.2% |
| Boston, MA | 8,909 | -0.3% | -17.0% |
| Chicago, IL | 16,867 | -1.7% | -8.7% |
| Cleveland, OH | 3,449 | 2.3% | -9.3% |
| Dallas-Fort Worth, TX | 10,025 | 0.0% | -7.0% |
| Denver, CO | 6,115 | 11.9% | -8.1% |
| Detroit, MI | 7,565 | 14.0% | -7.4% |
| Edison, NJ | 4,982 | 1.5% | -5.2% |
| Houston, TX | 9,614 | -5.1% | 1.8% |
| Kansas City, MO | 4,392 | 15.8% | 11.2% |
| Las Vegas, NV | 4,386 | -4.2% | 3.3% |
| Long Island, NY | 3,965 | -0.3% | -15.1% |
| Los Angeles, CA | 9,686 | 6.7% | 8.3% |
| Miami, FL | 4,680 | -3.8% | 2.7% |
| Minneapolis-St. Paul, MN | 7,656 | 5.5% | -1.9% |
| Oakland, CA | 3,362 | 10.7% | -1.8% |
| Orange County, CA | 4,276 | 6.1% | 14.6% |
| Orlando, FL | 4,657 | -0.4% | -4.6% |
| Philadelphia, PA | 6,685 | -5.3% | -13.2% |
| Phoenix, AZ | 9,855 | -3.3% | 6.5% |
| Pittsburgh, PA | 2,638 | 11.7% | -2.7% |
| Portland, OR | 4,779 | 14.3% | 0.7% |
| Riverside-San Bernardino, CA | 7,530 | 8.3% | 14.1% |
| Sacramento, CA | 3,994 | 11.7% | -2.8% |
| San Antonio, TX | 3,109 | -8.5% | -3.8% |
| San Diego, CA | 4,278 | 1.8% | -4.1% |
| Seattle, WA | 5,752 | 10.5% | 0.3% |
| St. Louis, MO | 5,425 | 12.4% | 25.5% |
| Tampa, FL | 6,186 | -5.6% | -2.4% |
| Washington, DC | 12,606 | 1.5% | -3.1% |
| National | 350,500 | 1.9% | -1.1% |
All Homes for Sale
| Redfin Metro | All Homes for Sale | Month-Over-Month | Year-Over-Year |
|---|---|---|---|
| Atlanta, GA | 33,784 | 15.6% | 5.4% |
| Baltimore, MD | 11,770 | 2.6% | -12.1% |
| Boston, MA | 12,896 | 3.5% | -16.0% |
| Chicago, IL | 48,257 | 4.9% | -7.9% |
| Cleveland, OH | 10,042 | 0.4% | -11.2% |
| Dallas-Fort Worth, TX | 14,391 | -6.2% | -13.4% |
| Denver, CO | 5,545 | 4.5% | -20.1% |
| Detroit, MI | 13,303 | -1.1% | -19.2% |
| Edison, NJ | 15,298 | 3.2% | -7.0% |
| Houston, TX | 22,561 | -1.8% | 20.6% |
| Las Vegas, NV | 14,226 | -0.2% | -2.2% |
| Long Island, NY | 13,252 | 2.0% | -11.8% |
| Los Angeles, CA | 16,036 | 4.4% | 3.1% |
| Miami, FL | 18,087 | -1.9% | 2.8% |
| Minneapolis-St. Paul, MN | 12,384 | 6.4% | -16.1% |
| Oakland, CA | 2,978 | 17.6% | -8.8% |
| Orange County, CA | 7,888 | 8.9% | 8.5% |
| Orlando, FL | 10,972 | -6.1% | -19.9% |
| Philadelphia, PA | 17,761 | 2.9% | -12.4% |
| Phoenix, AZ | 23,923 | -4.5% | -0.7% |
| Portland, OR | 4,647 | 7.0% | -28.4% |
| Riverside-San Bernardino, CA | 17,184 | 2.7% | 6.5% |
| Sacramento, CA | 5,033 | 9.0% | -20.3% |
| San Antonio, TX | 6,881 | -5.2% | -3.3% |
| San Diego, CA | 6,252 | -0.2% | -16.0% |
| Seattle, WA | 4,697 | 13.0% | -25.9% |
| St. Louis, MO | 13,554 | 13.7% | 22.5% |
| Tampa, FL | 15,590 | -4.2% | -14.2% |
| Washington, DC | 19,258 | 7.4% | -10.8% |
| National | 826,100 | 4.2% | -3.2% |
For more information, contact Redfin journalist services:
Phone: 206-588-6863
Email: press@redfin.com
See Redfin’s data center to find out what’s happening in other cities.
To be added to Redfin’s press release distribution list, please click here.
 United States
 Canada