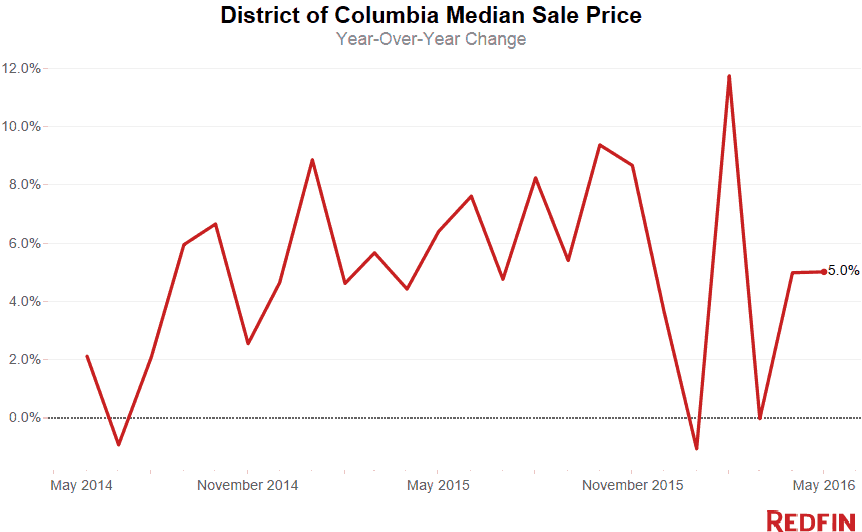
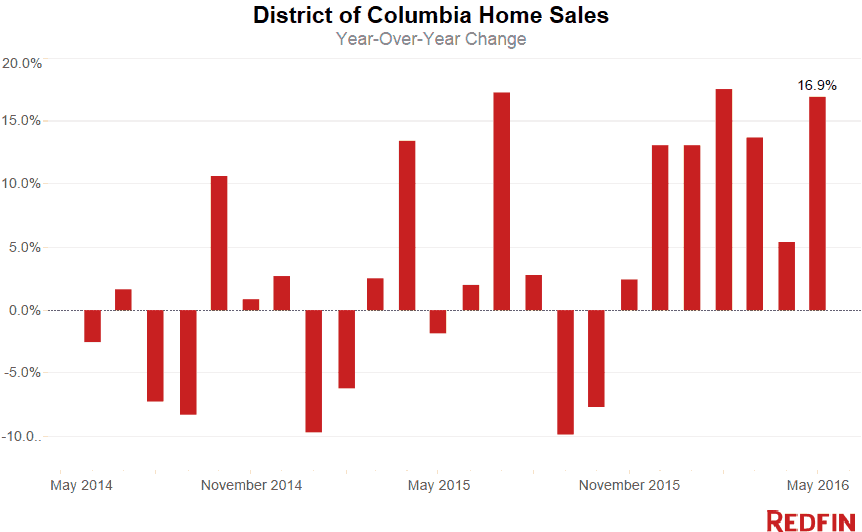
Washington, D.C., home prices rose 5 percent in May from a year earlier. The typical home sold for $570,000, the highest median sale price since Redfin began tracking sales data in 2009. Sales bounded up nearly 17 percent compared to last year.
It’s been a strong year for home sales with double-digit year-over-year growth in four of the first five months of 2016.
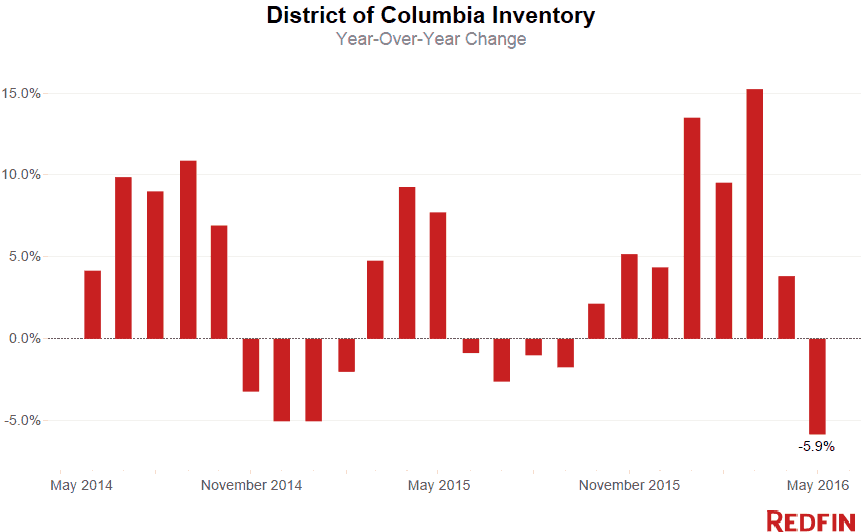
Sellers put 4.1 percent fewer homes on the market in May compared to a year ago, sending the overall number of properties for sale down nearly 6 percent. The city had a 1.6-month supply of homes for sale, far below the six months that signal a balance between buyers and sellers.
Buyers continued to face fierce competition, bidding up prices on nearly 40 percent of homes sold for the second month in a row. The typical home found a buyer in just 12 days.
“We’re seeing a continuation of trends that have been around at least for the last year and a half,” said Steve Centrella, a Redfin agent in Washington, D.C.
“The highest levels of competition are concentrated in the $500,000 and $750,000 price range,” Centrella said. “Single-family homes remain hot, as are condos that live like a single-family home in terms of square footage and bedrooms.”
What’s Happening in the D.C. Metro Region?
Across the broader D.C., Maryland and Virginia region, the median sale price fell 1.1 percent in May from a year earlier, to $375,000. Sales were up 12.7 percent year over year.
The number of homes listed in the region fell 13.8 percent, sending the total number of properties for sale tumbling 18.4 percent compared to last year. The region had a 2.3-month supply of homes for sale.
The typical home found a buyer in 19 days. Buyers paid more than the asking price on one in four homes.
Washington, D.C., Neighborhood Trends
Mount Pleasant continued its run as one of the most competitive neighborhoods in the city. Prices jumped 34.6 percent in May compared to a year prior. Sales soared 26.9 percent as buyers scooped up new listings, which increased 16 percent compared to last May.
The typical Mount Pleasant home stayed on the market just six days, making it the fastest-moving neighborhood, followed by American University Park/Tenleytown (seven days on market).
In AU Park/Tenleytown, nearly 60 percent of homes sold went for more than the seller’s asking price, with the typical home getting bid up 4.1 percent over asking price.
Pleasant Plains was hot in May. The median sale price was up 36.6 percent compared to last year with the typical come selling for $621,000. More than 55 percent of homes sold for more than their asking price.
See our city page for the most up-to-date data on Washington-area home prices.
Here’s what’s happening in your neighborhood:
| Place | Median Sale Price | Year-Over-Year | Homes Sold | Year-Over-Year | Inventory | Year-Over-Year | New Listings | Median Days on Market | Avg Sale-to-List |
|---|---|---|---|---|---|---|---|---|---|
| 16th Street Heights | $662,500 | 10.6% | 38 | -19.1% | 33 | 43.5% | 79 | 13 | 99.4% |
| Adams Morgan / Kalorama Heights / Lanier Heights | $465,000 | -4.1% | 101 | -1.9% | 67 | -9.5% | 146 | 17 | 99.4% |
| Alexandria | $485,000 | 2.1% | 569 | 6.6% | 1,146 | -12.9% | 677 | 16 | 99.2% |
| American University Park / Friendship Heights / Tenleytown | $950,000 | 0.9% | 42 | -12.5% | 16 | -23.8% | 75 | 7 | 104.1% |
| Arlington | $530,000 | -5.4% | 301 | 1.4% | 664 | -8.8% | 374 | 18 | 99.0% |
| Atlas District | $685,000 | -2.3% | 75 | 44.2% | 32 | 6.7% | 94 | 23 | 99.5% |
| Bellevue / Congress Heights / Highlands | $175,000 | -30.0% | 27 | -27.0% | 29 | -37.0% | 46 | 42 | 101.0% |
| Benning Heights / Capitol View / Marshall Heights | $275,000 | 46.7% | 53 | 26.2% | 21 | -50.0% | 70 | 22 | 101.9% |
| Bethesda | $733,000 | -6.6% | 72 | -27.3% | 355 | 2.0% | 103 | 21 | 99.1% |
| Bloomingdale | $667,500 | -9.1% | 40 | 11.1% | 13 | -13.3% | 62 | 13 | 101.3% |
| Capitol Hill | $780,000 | -4.2% | 117 | 27.2% | 48 | -5.9% | 158 | 8 | 101.8% |
| Chevy Chase-DC | $957,125 | -2.3% | 44 | -6.4% | 30 | 7.1% | 81 | 9 | 101.8% |
| Chinatown / Mount Vernon Square / Penn Quarter | $493,325 | 5.8% | 92 | 31.4% | 54 | -16.9% | 124 | 17 | 99.5% |
| Cleveland Park | $374,250 | -33.2% | 30 | 50.0% | 16 | -33.3% | 42 | 46 | 99.4% |
| College Park | $303,000 | 30.3% | 16 | 0.0% | 21 | -41.7% | 19 | 11 | 99.6% |
| Columbia Heights | $550,000 | -5.4% | 141 | 30.6% | 83 | 45.6% | 192 | 10 | 101.1% |
| Congress Heights | $290,000 | 13.3% | 8 | -61.9% | 17 | -32.0% | 21 | 34 | 99.7% |
| Deanwood | $230,000 | 7.0% | 29 | 38.1% | 23 | 43.8% | 38 | 23 | 98.1% |
| Dupont Circle | $403,500 | 1.1% | 110 | 3.8% | 67 | 19.6% | 173 | 14 | 99.7% |
| Eckington | $640,000 | 7.6% | 28 | 33.3% | 21 | 0.0% | 51 | 14 | 99.3% |
| Edgewood | $507,425 | -20.3% | 30 | 100.0% | 13 | -23.5% | 35 | 12 | 104.2% |
| Fairlawn / Twining / Randle Highlands / Penn Branch | $310,000 | 19.2% | 41 | 24.2% | 32 | -15.8% | 60 | 39 | 98.7% |
| Foggy Bottom / George University / West End | $382,500 | -21.9% | 59 | -10.6% | 47 | -9.6% | 84 | 22 | 99.9% |
| Fort Totten / Lamont Riggs / Pleasant Hill / Queens Chapel | $397,500 | -12.6% | 42 | 20.0% | 13 | -48.0% | 47 | 19 | 99.8% |
| Foxhall / Palisades / Spring Valley / Wesley Heights | $1,250,000 | -0.4% | 59 | 18.0% | 70 | 12.9% | 113 | 13 | 99.0% |
| Georgetown | $1,050,000 | 10.9% | 69 | 32.7% | 73 | 23.7% | 113 | 25 | 98.4% |
| Glover Park / Cathedral Heights / McLean Gardens | $456,000 | 23.2% | 116 | 23.4% | 77 | -12.5% | 165 | 20 | 98.8% |
| Greenway / Benning / Dupont Park / River Terrace | $283,000 | 22.5% | 17 | -5.6% | 11 | -50.0% | 34 | 15 | 100.7% |
| Hill East | $698,000 | 9.1% | 60 | -6.2% | 24 | -17.2% | 88 | 11 | 101.1% |
| Historic Anacostia | $336,000 | -8.0% | 19 | 533.3% | 5 | -16.7% | 13 | 28 | 100.8% |
| Howard University / Le Droit Park | $705,000 | 19.1% | 60 | -23.1% | 31 | 0.0% | 88 | 8 | 101.3% |
| Kingman Park | $505,000 | 13.7% | 52 | 4.0% | 15 | -21.1% | 51 | 31 | 99.8% |
| Logan Circle-Shaw | $699,000 | 1.7% | 97 | 15.5% | 42 | 35.5% | 134 | 8 | 102.7% |
| Logan Circle-Shaw | $701,000 | 4.6% | 111 | 5.7% | 47 | 23.7% | 154 | 9 | 102.3% |
| Massachusetts Avenue Heights | $650,000 | 83.1% | 47 | 80.8% | 22 | -40.5% | 54 | 21 | 99.4% |
| Mount Pleasant | $700,000 | 34.6% | 33 | 26.9% | 13 | 44.4% | 43 | 6 | 103.0% |
| Navy Yard | $455,000 | -12.9% | 11 | -38.9% | 4 | 100.0% | 18 | 18 | 99.5% |
| NoMa | $681,950 | 1.2% | 38 | 72.7% | 10 | -28.6% | 37 | 23 | 98.0% |
| Petworth | $650,000 | 10.7% | 76 | 0.0% | 38 | 8.6% | 121 | 12 | 101.2% |
| Pleasant Plains | $621,450 | 36.6% | 38 | 11.8% | 18 | 38.5% | 43 | 15 | 101.7% |
| Rockville | $430,000 | -19.6% | 165 | 13.8% | 420 | -18.4% | 211 | 9 | 99.5% |
| Silver Spring | $355,000 | -0.8% | 288 | 44.7% | 604 | -26.4% | 328 | 15 | 99.8% |
| Southwest / Waterfront | $319,950 | -3.0% | 58 | -1.7% | 29 | -9.4% | 73 | 12 | 100.0% |
| Stanton Park | $675,000 | -8.0% | 123 | 46.4% | 50 | 19.1% | 158 | 9 | 101.1% |
| Takoma | $411,250 | 0.3% | 10 | 25.0% | 2 | -33.3% | 15 | 11 | 101.2% |
| Trinidad / Arboretum / Ivy City | $416,500 | -3.7% | 48 | -20.0% | 40 | 2.6% | 76 | 40 | 99.3% |
| Truxton Circle | $722,450 | 20.4% | 14 | -33.3% | 5 | -28.6% | 20 | 83 | 99.4% |
| Union Station / Kingman Park / Stanton Park | $650,000 | 10.0% | 176 | 37.5% | 74 | 13.9% | 230 | 15 | 100.6% |
| Van Ness / Forest Hills / Wakefield | $542,500 | 1.3% | 36 | 12.5% | 23 | -17.9% | 48 | 19 | 99.2% |
| Woodley Park | $447,000 | -6.9% | 16 | 0.0% | 6 | -45.5% | 29 | 11 | 102.4% |
| Woodridge | $585,000 | NA | 2 | NA | NA | NA | NA | 151 | 98.5% |
| Woodridge-Fort Lincoln | $472,500 | -9.3% | 34 | -5.6% | 10 | -16.7% | 35 | 25 | 99.7% |
| Washington, DC | $570,000 | 5.0% | 870 | 16.9% | 1,355 | -5.9% | 1,015 | 12 | 100.6% |
NOTE: Not all neighborhoods are listed, but totals for Washington, D.C., encompass entire city. Data is based on listing information and might not reflect all real estate activity in the market. Neighborhood-specific data is measured over the three months ended May 31. Inventory measures listings active as of May 31.
For more information, contact Redfin journalist services:
Phone: 206-588-6863
Email: press@redfin.com
See Redfin’s data center to find out what’s happening in other cities.
To be added to Redfin’s press release distribution list, subscribe here.
 United States
 Canada