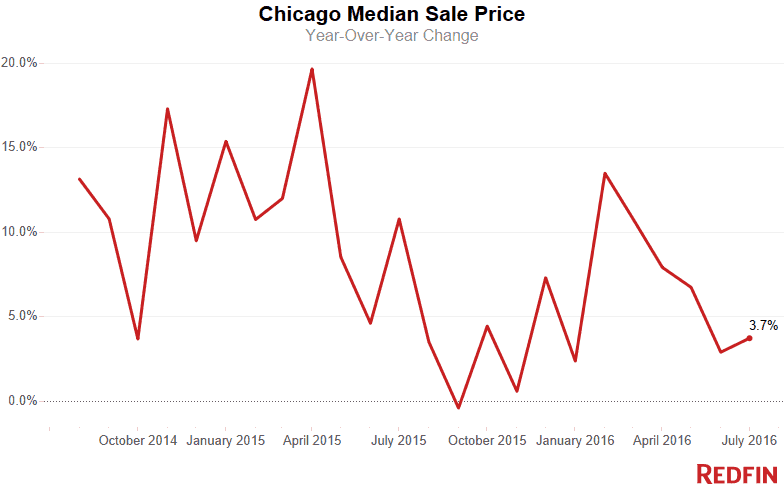
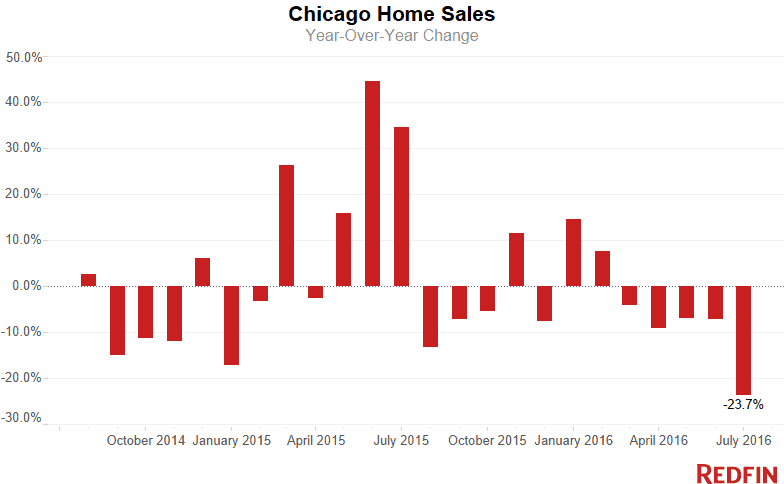
Chicago home prices increased 3.7 percent in July, as compared to last year, with a typical home selling for $285,000. A lack of sales was the big news, however, with the city seeing a precipitous 23.7 percent drop in homes sold in July.
Partially, the drop in sales can be chalked up to how the days fell on the calendar. July this year had a below-average number of business days, and last July had an above-average number, making for a significant difference in the number of days on which home sale closings could have taken place. Our analysts estimate this contributed a 7.5 percent drop in sales as compared to last July’s far more favorable closing schedule. Nationally, home sales dropped 11 percent, but that’s less than half the size of the Chicago drop.
In Chicago, there simply aren’t enough homes for interested buyers. New listings in July were down 18.8 percent compared to last year, while the total number of homes for sale was down 12.4 percent.
And, even with limited selection, buyer demand has tapered off, and those who are looking aren’t necessarily pressing to buy immediately, say Redfin agents. Yet the sellers who do come on the market often price their homes as if it was still the red-hot spring, said Redfin real estate agent Ali Donoghue.
Indeed, the median list price was up 9.8 percent this July, compared to only a 3.7 percent bump in the price of sold homes.
Among the homes that did sell, the median market time was 57 days, four fewer than last year, with homes closing at an average of 98.4 percent of list price. Twenty-seven percent of homes sold above their asking prices.
Hot Neighborhoods
Even with overall diminished buyer interest, certain neighborhoods and types of homes are selling fast.
“If you look at well-priced two or three-bedroom condos with two bathrooms in the West Loop, or multi-unit properties in Logan Square, we still see buyers lined up and sellers selecting from the best of multiple offers,” said Redfin real estate agent Greg Whelan.
Indeed, 45.6 percent of homes in the West Loop sold for over asking price, the second highest rate in the city behind Humboldt Park. Typical homes in the West Loop sold in 41 days, tied with Logan Square and West Town for fourth fastest in the city, trailing only Brighton Park, Humboldt Park and Ukrainian Village.
The Gold Coast had the most expensive market in July, with a typical residence selling for $520,000. It was the only neighborhood to crest half-a-million. Wicker Park, North Center, Lincoln Park and Bucktown rounded out the top five most-expensive neighborhoods in Chicago.
Brighton Park saw the largest year-over-year price increase, with sale prices jumping a whopping 73.3 percent, to a median of $208,000 – though the neighborhood as a whole only had 31 sales. South Shore had the second-highest appreciation, at 58.2 percent, across a more robust 63 sales, with a median sale price of $72,000. Austin, Little Village and Gold Coast rounded out the top five highest price appreciation in July.
See our city page for the most up-to-date data on Chicago home prices.
Here’s what’s happening in your neighborhood:
| Place | Median Sale Price | Year-Over-Year | Homes Sold | Year-Over-Year | Inventory | Year-Over-Year | New Listings | Median Days on Market | Avg Sale-to-List |
|---|---|---|---|---|---|---|---|---|---|
| Albany Park | $235,700 | -9.9% | 112 | -20.6% | 162 | -15.2% | 152 | 64 | 98.2% |
| Andersonville | $402,000 | 6.5% | 113 | 8.6% | 69 | -31.7% | 77 | 49 | 98.8% |
| Archer Heights | $173,950 | -4.4% | 30 | 11.1% | 33 | -8.3% | 30 | 55 | 98.2% |
| Austin | $135,000 | 38.5% | 112 | -36.4% | 190 | -26.4% | 135 | 70 | 100.2% |
| Avondale | $347,750 | 10.8% | 98 | -29.0% | 135 | -2.9% | 125 | 49 | 99.3% |
| Beverly | $295,000 | -5.1% | 57 | -24.0% | 147 | 10.5% | 115 | 78 | 96.5% |
| Bridgeport | $368,000 | 22.7% | 41 | -38.8% | 93 | -13.1% | 72 | 65 | 97.7% |
| Brighton Park | $208,000 | 73.3% | 31 | -20.5% | 52 | -41.6% | 39 | 34 | 99.8% |
| Bucktown | $474,250 | -6.2% | 170 | -20.6% | 136 | -9.9% | 174 | 42 | 99.3% |
| Clearing | $192,750 | 14.7% | 76 | 5.6% | 117 | 23.2% | 95 | 65 | 97.2% |
| Edgewater | $218,900 | -0.1% | 299 | -6.3% | 264 | -30.2% | 267 | 56 | 97.2% |
| Edison Park | $345,000 | -1.4% | 53 | -26.4% | 59 | -13.2% | 57 | 56 | 96.8% |
| Englewood | $14,250 | -37.0% | 14 | -72.0% | 123 | -9.6% | 34 | 54 | 101.7% |
| Evanston | $360,000 | -8.9% | 161 | 8.1% | 400 | -25.8% | 131 | 69 | 97.5% |
| Garfield Ridge | $210,000 | 8.9% | 135 | 7.1% | 138 | -13.8% | 152 | 64 | 97.7% |
| Gold Coast | $520,000 | 28.4% | 173 | 3.6% | 242 | -6.6% | 209 | 70 | 96.9% |
| Humboldt Park | $160,000 | 4.0% | 61 | -39.6% | 112 | -16.4% | 90 | 35 | 102.8% |
| Hyde Park | $242,500 | 5.4% | 82 | 2.5% | 65 | -30.9% | 80 | 68 | 95.2% |
| Irving Park | $295,500 | -6.5% | 207 | -5.1% | 247 | -9.2% | 243 | 58 | 98.1% |
| Jefferson Park | $276,750 | 6.4% | 96 | -6.8% | 126 | -14.3% | 111 | 53 | 98.1% |
| Joliet | $159,000 | 5.3% | 329 | 17.1% | 741 | -22.5% | 274 | 53 | 98.7% |
| Kenwood | $230,250 | 18.1% | 68 | 33.3% | 101 | -23.5% | 90 | 66 | 96.5% |
| Lakeview | $379,000 | 1.9% | 823 | -13.6% | 747 | -7.0% | 826 | 55 | 98.4% |
| Lincoln Park | $475,250 | -7.2% | 542 | -12.2% | 554 | -13.6% | 610 | 53 | 98.2% |
| Lincoln Square | $319,500 | -7.4% | 209 | -3.7% | 195 | -6.7% | 210 | 63 | 97.9% |
| Logan Square | $342,500 | -1.1% | 222 | -21.3% | 191 | -12.8% | 226 | 41 | 99.7% |
| McKinley Park | $242,500 | 11.5% | 20 | -28.6% | 24 | -42.9% | 22 | 66 | 99.5% |
| Montclare | $197,250 | -10.3% | 18 | -67.3% | 43 | -31.8% | 46 | 66 | 97.3% |
| Mount Greenwood | $210,000 | 1.3% | 84 | 31.2% | 95 | 23.4% | 100 | 63 | 97.6% |
| Naperville | $367,500 | 1.5% | 410 | 13.0% | 1,237 | -9.6% | 298 | 70 | 97.4% |
| Near North Side | $425,000 | 6.2% | 991 | -4.5% | 1,133 | -11.6% | 1,113 | 61 | 98.3% |
| North Center | $483,500 | -16.6% | 113 | -28.5% | 123 | -14.0% | 113 | 51 | 97.9% |
| Old Town | $410,000 | 23.1% | 103 | -11.2% | 84 | -20.0% | 107 | 49 | 98.7% |
| Portage Park | $260,500 | -5.3% | 196 | -3.9% | 206 | -23.7% | 204 | 54 | 99.1% |
| Pullman | $45,000 | -2.2% | 12 | -45.5% | 25 | -21.9% | 17 | 87 | 95.4% |
| Ravenswood | $373,750 | 8.3% | 234 | -0.8% | 171 | -8.1% | 211 | 54 | 98.6% |
| Rogers Park | $189,450 | 5.2% | 166 | -0.6% | 234 | -8.6% | 226 | 67 | 97.6% |
| Roscoe Village | $459,450 | -0.5% | 134 | 0.8% | 139 | -7.3% | 132 | 53 | 98.9% |
| Sauganash | $387,000 | 4.6% | 59 | -11.9% | 69 | -16.9% | 73 | 62 | 97.7% |
| South Lawndale / Little Village | $90,500 | 29.5% | 14 | -67.4% | 50 | -37.5% | 24 | 77 | 95.4% |
| South Loop | $356,750 | 7.1% | 430 | -11.2% | 375 | -15.0% | 474 | 54 | 100.5% |
| South Shore | $72,000 | 58.2% | 63 | -24.1% | 148 | -14.9% | 113 | 124 | 95.0% |
| Streeterville | $423,750 | -0.3% | 260 | -3.4% | 382 | -8.8% | 314 | 76 | 97.2% |
| The Loop | $361,500 | 3.6% | 308 | 5.8% | 323 | -11.0% | 390 | 62 | 99.0% |
| Tri-taylor | $280,000 | -4.2% | 21 | -4.5% | 18 | -47.1% | 26 | 52 | 97.6% |
| Ukrainian Village | $423,000 | -7.9% | 52 | 0.0% | 29 | -19.4% | 39 | 39 | 99.2% |
| Uptown | $245,000 | 2.1% | 294 | 22.5% | 269 | -16.7% | 322 | 51 | 97.6% |
| West Loop | $400,000 | 1.3% | 320 | -12.1% | 215 | 21.5% | 339 | 41 | 100.7% |
| West Town | $440,000 | 1.1% | 630 | -18.0% | 496 | -0.2% | 644 | 41 | 99.6% |
| Wicker Park | $486,000 | -8.3% | 65 | -30.1% | 65 | -12.2% | 84 | 44 | 99.8% |
| Chicago, IL | $285,000 | 3.7% | 3,060 | -23.7% | 12,241 | -12.4% | 3,568 | 57 | 98.4% |
For more information, contact Redfin journalist services
Phone: 206-588-6863
Email: press@redfin.com
See Redfin’s data center to find out what’s happening in other cities.
To be added to Redfin’s press release distribution list, subscribe here.
 United States
 Canada