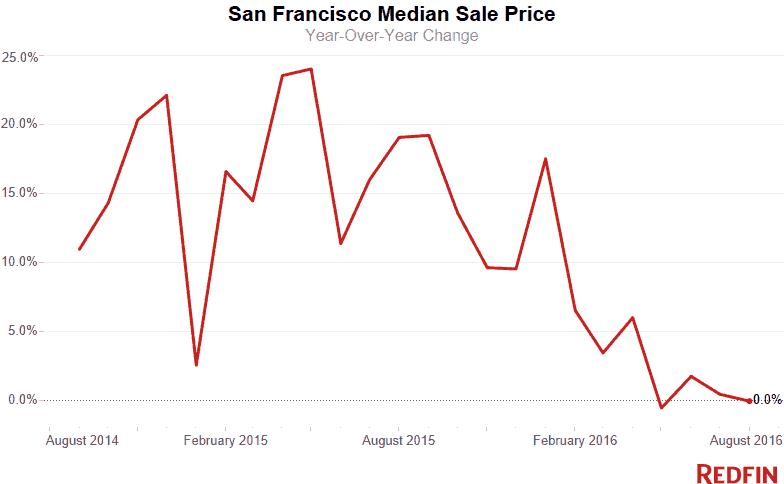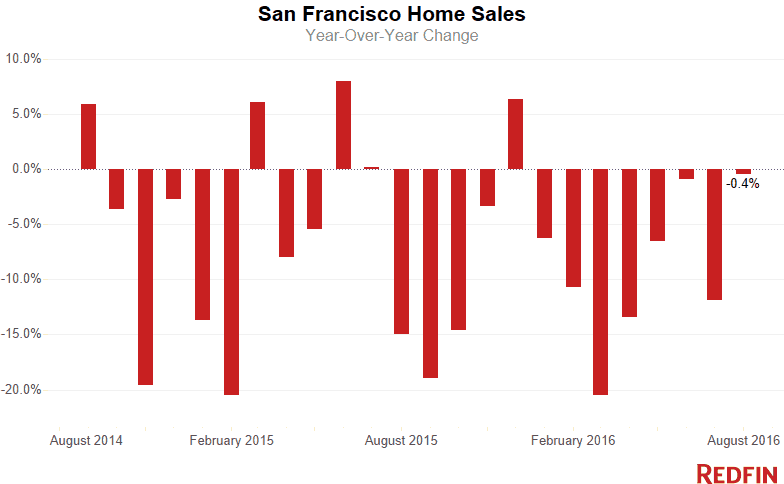
San Francisco home sales declined for the eighth-consecutive month, falling 0.4 percent in August from a year earlier. Prices were flat, showing zero growth compared to last year. At $1.19 million, the median sale price in August was the lowest it has been in the city since January.

Although there are more homes for sale in San Francisco than this time last year, the number of new listings added to the market declined 7 percent compared to August 2015. Much of the housing inventory that is on the market is stale. Sixty-one percent of the current inventory has been sitting for more than 30 days, which is the most stale inventory San Francisco has seen in four years for the month of August.

Since prices in the city have plateaued, bumping just above and below $1.2 million for nearly two years now, not as many homebuyers are able or willing to compete in the bidding wars that have led to the area’s soaring price growth. Multiple-offer situations have been on a continual decline for most of this year. This August, 63 percent of offers made by Redfin clients in the San Francisco metro area faced bidding wars. In March 2015, when buyers were breaking down doors, bidding wars soared to 94 percent, the highest level on record since Redfin began tracking this data in 2012.
“The tide is clearly turning in the San Francisco real estate market,” said Redfin San Francisco real estate agent Saleem Buqeileh. “There are still more well-heeled buyers in the city than there are homes for sale, so prices aren’t likely to plummet. But sellers now expect to list their homes for sale and receive a flood of offers, each one higher than the next. As they continue to be disappointed by the offers they receive, even when they are above the list price, homes are sitting on the market much longer.”
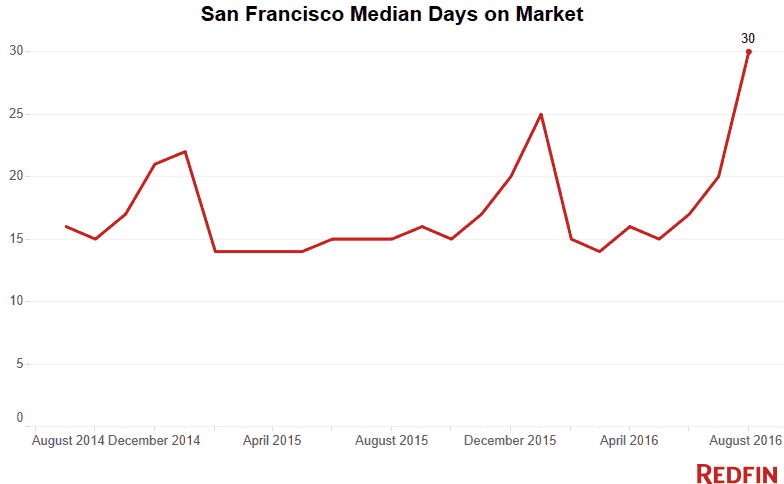
The chart below tells the tale. The typical San Francisco home sold in 30 days in August and time on market has steadily increased since May, when the typical home sold in just 15 days. With homes staying on the market twice as long, this August marks the slowest rate at which homes sold since February 2012. That was back in the days when the median sale price for a San Francisco home was under $700,000.

Neighborhood Trends
Sellers have been having the most trouble moving their homes in some of the exorbitantly-priced neighborhoods located near the Embarcadero. Of the markets we studied, the slowest was Rincon Hill, where the typical home sold within 48 days. The highly priced condos in the Financial District took 38 days to sell — 30 days longer than in the same period last year.
Russian Hill saw the most dramatic drop in median sale price, down 22 percent compared to last year. Buyers and sellers are at a disconnect in this ‘hood.The typical asking price for a Russian Hill home in August increased 8.6 percent over last year to $1.41 million, but the typical sale price was $1.28 million.
Still some neighborhoods kept the fire. Bernal Heights was a standout, with homes there selling in just 14 days and 81 percent going for more than asking. As buyers continue to be priced out of the urban core, Daly City has become more and more attractive. Prices increased in the southern ‘burb by 13.5 percent, home sales ticked-up 8.1 percent and 88 percent of homes sold for above list.
See our city page for the most up-to-date data on San Francisco home prices.
Here’s what’s happening in your neighborhood:
| Place | Median Sale Price | Year-Over-Year | Homes Sold | Year-Over-Year | Inventory | Year-Over-Year | New Listings | Median Days on Market | Avg Sale-to-List |
|---|---|---|---|---|---|---|---|---|---|
| Ashbury Heights | $1,630,000 | 30.4% | 15 | -11.8% | 4 | 0.0% | 13 | 18 | 107.2% |
| Bernal Heights | $1,350,000 | 8.7% | 67 | 4.7% | 30 | 15.4% | 74 | 14 | 115.3% |
| Civic Center / Van Ness | $803,763 | 1.7% | 26 | -23.5% | 25 | 92.3% | 49 | 35 | 104.0% |
| Crocker Amazon | $908,000 | 9.5% | 19 | 35.7% | 11 | 0.0% | 21 | 24 | 106.7% |
| Daly City | $830,000 | 13.5% | 67 | 8.1% | 108 | 11.3% | 70 | 25 | 107.1% |
| Excelsior | $833,000 | -0.2% | 25 | 4.2% | 14 | 16.7% | 30 | 16 | 110.3% |
| Financial District | $1,500,000 | -16.8% | 5 | -37.5% | 9 | 0.0% | 12 | 38 | 99.1% |
| Forest Hill | $2,285,000 | 23.5% | 5 | -44.4% | 1 | NA | 5 | 13 | 109.8% |
| Haight Ashbury | $1,269,000 | -0.5% | 7 | 40.0% | 3 | NA | 6 | 20 | 104.3% |
| Hayes Valley | $1,300,000 | -7.3% | 13 | 116.7% | 11 | 22.2% | 19 | 15 | 105.7% |
| Ingleside | $853,000 | -3.1% | 17 | 112.5% | 2 | -50.0% | 16 | 15 | 113.9% |
| Inner Richmond | $2,065,000 | 30.5% | 16 | -60.0% | 8 | -27.3% | 20 | 14 | 110.8% |
| Inner Sunset | $1,355,000 | -3.2% | 22 | -21.4% | 14 | 75.0% | 22 | 19 | 108.5% |
| Lower Haight | $1,433,000 | 9.2% | 15 | 7.1% | 2 | 100.0% | 10 | 27 | 108.0% |
| Merced Heights | $670,000 | 9.8% | 14 | 7.7% | 4 | -50.0% | 12 | 26 | 106.7% |
| Miraloma Park | $1,300,100 | -8.3% | 43 | 4.9% | 20 | 122.2% | 35 | 22 | 107.0% |
| Mission | $1,185,000 | -1.7% | 39 | -11.4% | 19 | -9.5% | 41 | 24 | 107.4% |
| Mission Bay | $1,220,000 | 3.4% | 27 | -10.0% | 23 | 666.7% | 39 | 36 | 99.2% |
| Nob Hill | $1,480,000 | 6.6% | 20 | -25.9% | 17 | 70.0% | 24 | 32 | 99.2% |
| Noe Valley | $1,650,000 | -10.2% | 69 | 1.5% | 21 | 50.0% | 66 | 25 | 105.3% |
| Pacific Heights | $1,497,500 | 0.5% | 66 | 40.4% | 27 | 50.0% | 60 | 22 | 103.2% |
| Parkside | $1,250,000 | 5.3% | 19 | -47.2% | 8 | 0.0% | 25 | 15 | 117.1% |
| Portola | $850,000 | 5.5% | 9 | -55.0% | 6 | -40.0% | 10 | 44 | 103.2% |
| Potrero Hill | $1,150,000 | -18.0% | 45 | 21.6% | 14 | 180.0% | 32 | 25 | 105.5% |
| Rincon Hill | $1,225,000 | 7.5% | 33 | -15.4% | 38 | 65.2% | 52 | 48 | 99.4% |
| Russian Hill | $1,285,000 | -22.1% | 30 | 11.1% | 15 | 114.3% | 28 | 29 | 100.9% |
| South of Market | $849,500 | -10.6% | 68 | -22.7% | 78 | 169.0% | 110 | 33 | 102.0% |
| South San Francisco | $811,250 | 5.9% | 44 | 22.2% | 80 | 60.0% | 51 | 18 | 106.0% |
| Sunnyside | $1,060,000 | -1.4% | 15 | -11.8% | 8 | 300.0% | 12 | 20 | 110.7% |
| Sunset District | $1,250,000 | -0.4% | 138 | -18.8% | 54 | -6.9% | 136 | 15 | 115.7% |
| Telegraph Hill | $1,500,000 | 30.4% | 10 | 0.0% | 4 | 300.0% | 9 | 30 | 101.4% |
| Tenderloin | $654,000 | -18.2% | 8 | 60.0% | 5 | 66.7% | 5 | 40 | 104.2% |
| Twin Peaks | $1,833,500 | 101.5% | 4 | -63.6% | 3 | 200.0% | 5 | 18 | 101.1% |
| Visitacion Valley | $760,000 | 4.8% | 11 | -8.3% | 8 | -27.3% | 12 | 17 | 108.4% |
| Western Addition | $1,020,000 | -20.9% | 16 | -27.3% | 11 | 120.0% | 22 | 14 | 106.5% |
| San Francisco, CA | $1,199,500 | -0.0% | 460 | -0.4% | 790 | 47.9% | 427 | 30 | 106.6% |
NOTE: Not all neighborhoods are listed, but totals for San Francisco encompass the entire city. Data is based on listing information and might not reflect all real estate activity in the market. Neighborhood-specific data is measured over a three-month span that ended August 31. Inventory measures listings active as of August 31.
For more information, contact Redfin journalist services
Phone: 206-588-6863
Email: press@redfin.com
See Redfin’s data center to find out what’s happening in other cities.
To be added to Redfin’s press release distribution list, subscribe here.

 United States
 Canada