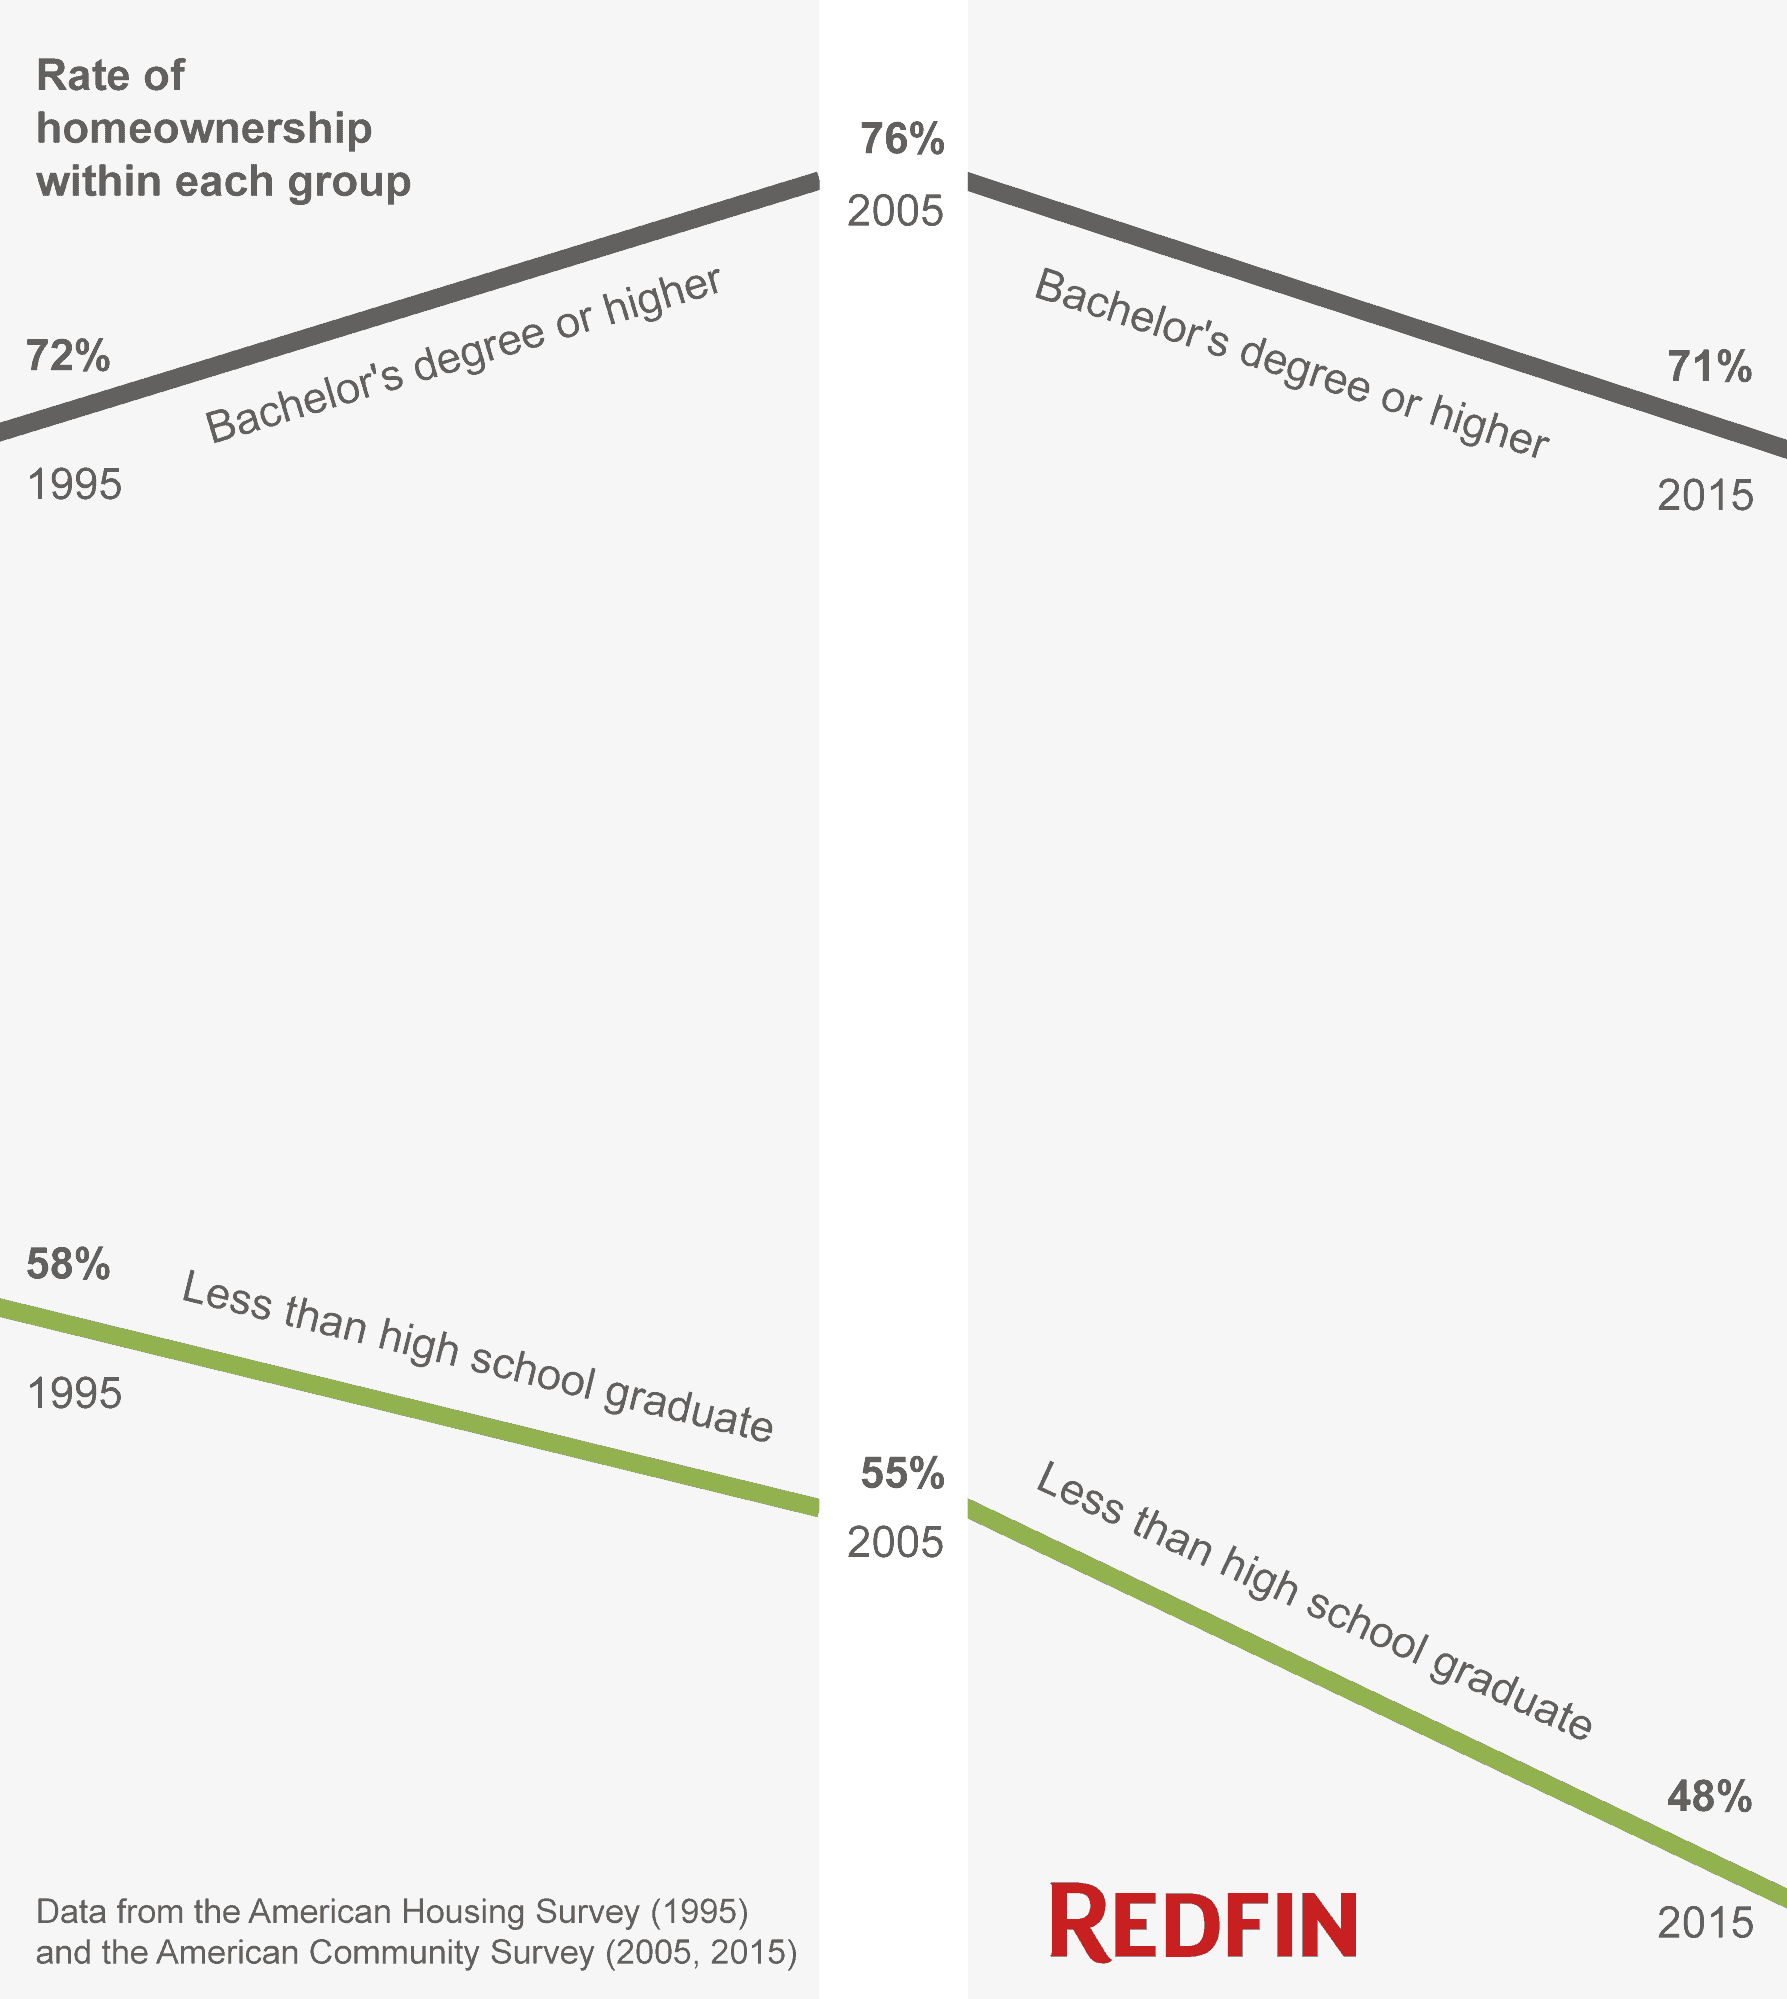
- The gap between the rates of homeownership among the most educated and the least educated widened between 1995 and 2005, and then held steady from 2005 to 2015.
- The portion of Americans who own their homes fell nationwide for all education levels over the last 10 years, even among the most educated households.
- High school graduates have the same rate of homeownership–61 percent–as households headed by people who went to college but didn’t finish, even though the high school graduates have a significantly lower median household income.
The homeownership rate is shrinking and signs of a massive decline that spans education levels are becoming clearer. Over the last 10 years, the national rate has fallen by four percent to 63 percent of Americans owning homes. One driver is home prices moving faster than incomes, so something big has to shift for this pattern to reverse. In the most recent data, incomes increased the most they have in decades, but the homeownership rate still didn’t keep pace.
It hasn’t always been this way: The education-homeownership gap widened between 1995 and 2005
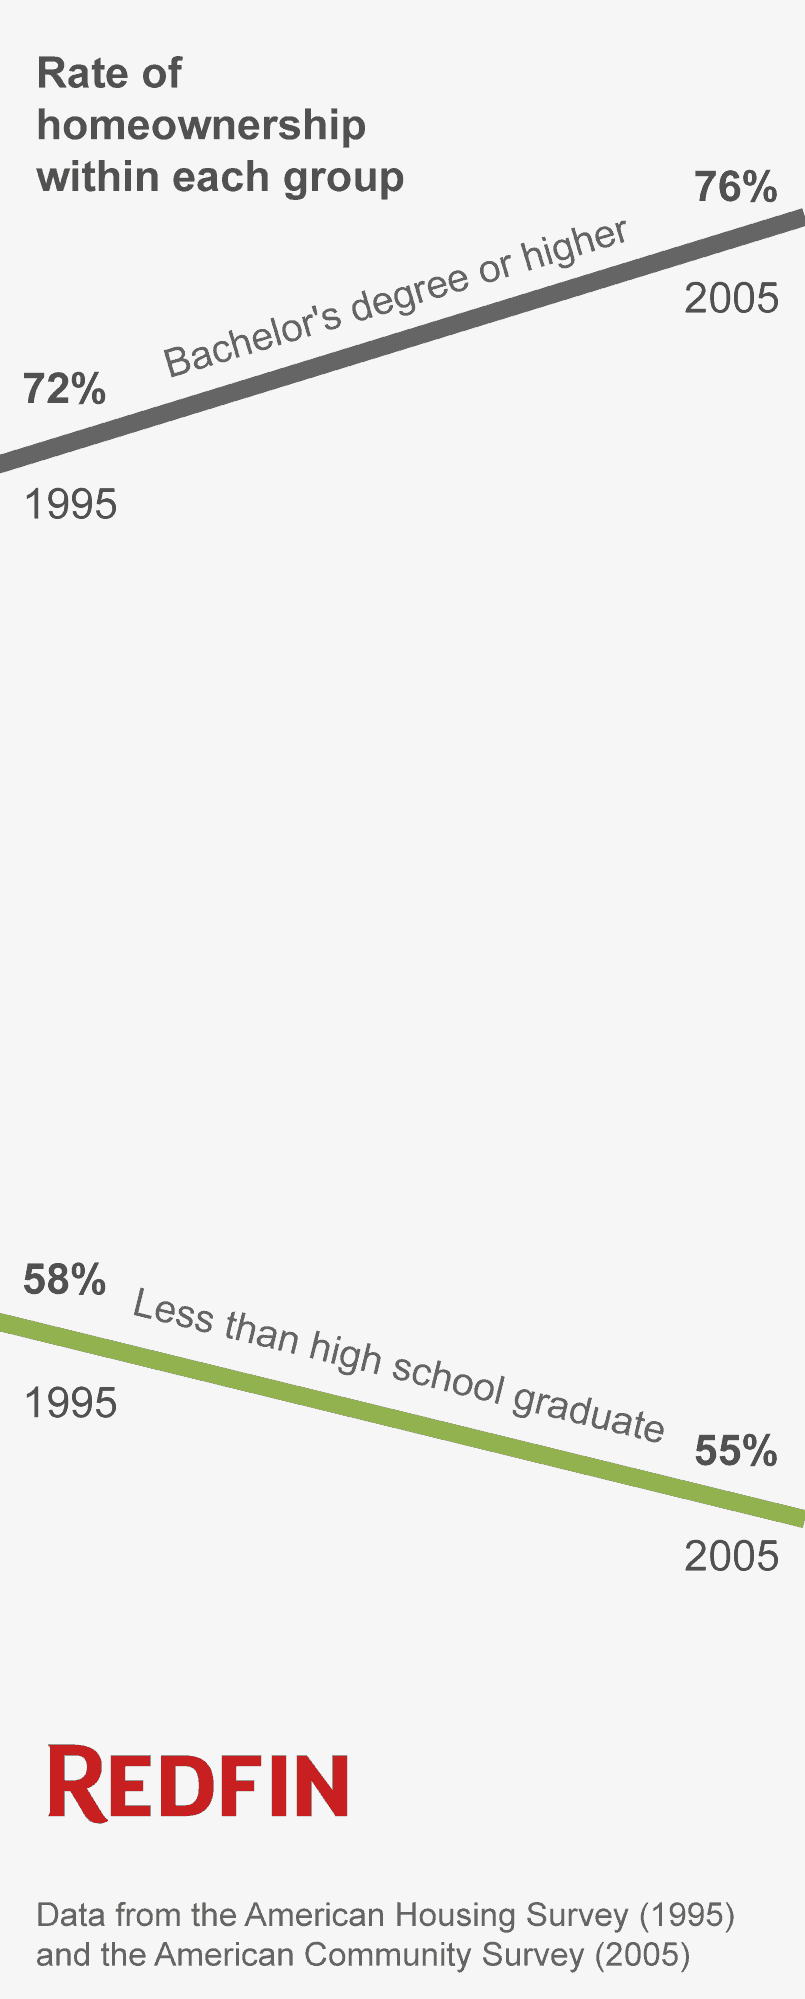
The gap in the rate of homeownership between households with a bachelor’s degree or higher and those that didn’t graduate high school widened nationwide from 14 percent to 21 percent between 1995 and 2005. This was due to the college-educated group increasing their rate of homeownership while the group that didn’t graduate high school decreased their rate of homeownership.
In the last 10 years the declining rate of homeownership in the U.S. has been steady across levels of education
After the gap set in, it held steady for the last 10 years, even as the rate declined in lockstep across education levels. It’s as if the architects and the carpet installers have been running down a hill holding hands; they’re both getting closer to renting and further from buying at about the same pace.
The cities where the gap is widest and narrowest
The homeownership and education gap is wider in some cities. Here are the top 10 cities in the analysis where the homeownership gap is the widest, comparing the rate of homeownership within each group for households with a bachelor’s degree or higher to those who didn’t finish high school.
| Rank | City | Homeownership rate among households headed by a bachelor’s or higher degree-holder | Homeownership rate among households headed by someone without a high school degree | Ownership gap between bachelor’s degree householders and those who did not finish high school |
| 1 | Frisco, Texas | 83% | 35% | 48% |
| 2 | Cary, North Carolina | 76% | 29% | 47% |
| 3 | Bellevue, Washington | 56% | 11% | 46% |
| 4 | Santa Rosa, California | 67% | 25% | 42% |
| 5 | St. Paul, Minnesota | 64% | 22% | 42% |
| 6 | Charleston, South Carolina | 64% | 23% | 41% |
| 7 | Aurora, Colorado | 73% | 33% | 40% |
| 8 | Minneapolis, Minnesota | 57% | 17% | 40% |
| 9 | Aurora, Illinois | 82% | 43% | 39% |
| 10 | Raleigh, North Carolina | 64% | 25% | 39% |
Table, top 10 cities where the education-homeownership gap is the widest; data from the American Community Survey
This issue is not just affecting the least advantaged Americans. The next table lists the 10 cities with the narrowest homeownership gap between education groups. Notice that in some of these cities, like Pittsburgh, even the most highly educated households are more likely to rent than buy.
| Rank | City | Homeownership rate among households headed by a bachelor’s or higher degree-holder | Homeownership rate among households headed by someone without a high school degree | Ownership gap between bachelor’s degree householders and those that did not finish high school |
| 1 | Spring Valley, Nevada | 46% | 51% | -5% |
| 2 | Irving, Texas | 41% | 40% | 1% |
| 3 | Clarksville, Tennessee | 55% | 54% | 1% |
| 4 | Pembroke Pines, Florida | 72% | 70% | 2% |
| 5 | Moreno Valley, California | 74% | 71% | 3% |
| 6 | Pittsburgh, Pennsylvania | 46% | 43% | 4% |
| 7 | Hialeah, Florida | 53% | 49% | 4% |
| 8 | Sunnyvale, California | 45% | 40% | 5% |
| 9 | Philadelphia, Pennsylvania | 52% | 46% | 6% |
| 10 | Fremont, California | 66% | 60% | 6% |
Table, top 10 cities where the education-homeownership gap is the narrowest; data from the 2015 one-year American Community Survey
The surprise and the outlook
Overall, more educated people are more likely to be homeowners. There’s one exception to that rule – high school grads versus households without a bachelor’s degree that took some college courses. Despite having a 19 percent higher median household income, households headed by people who went to college but didn’t finish have about the same rate of homeownership nationwide as those with high school diplomas and no college experience, and even at the city level. This shows up in the next chart that covers cities with a population of at least 300,000. Notice that the blue dots (some college) and the red dots (high school grads) are about the same height, or have about the same rate of home ownership, even though the blue dots are further to the right, with higher incomes.
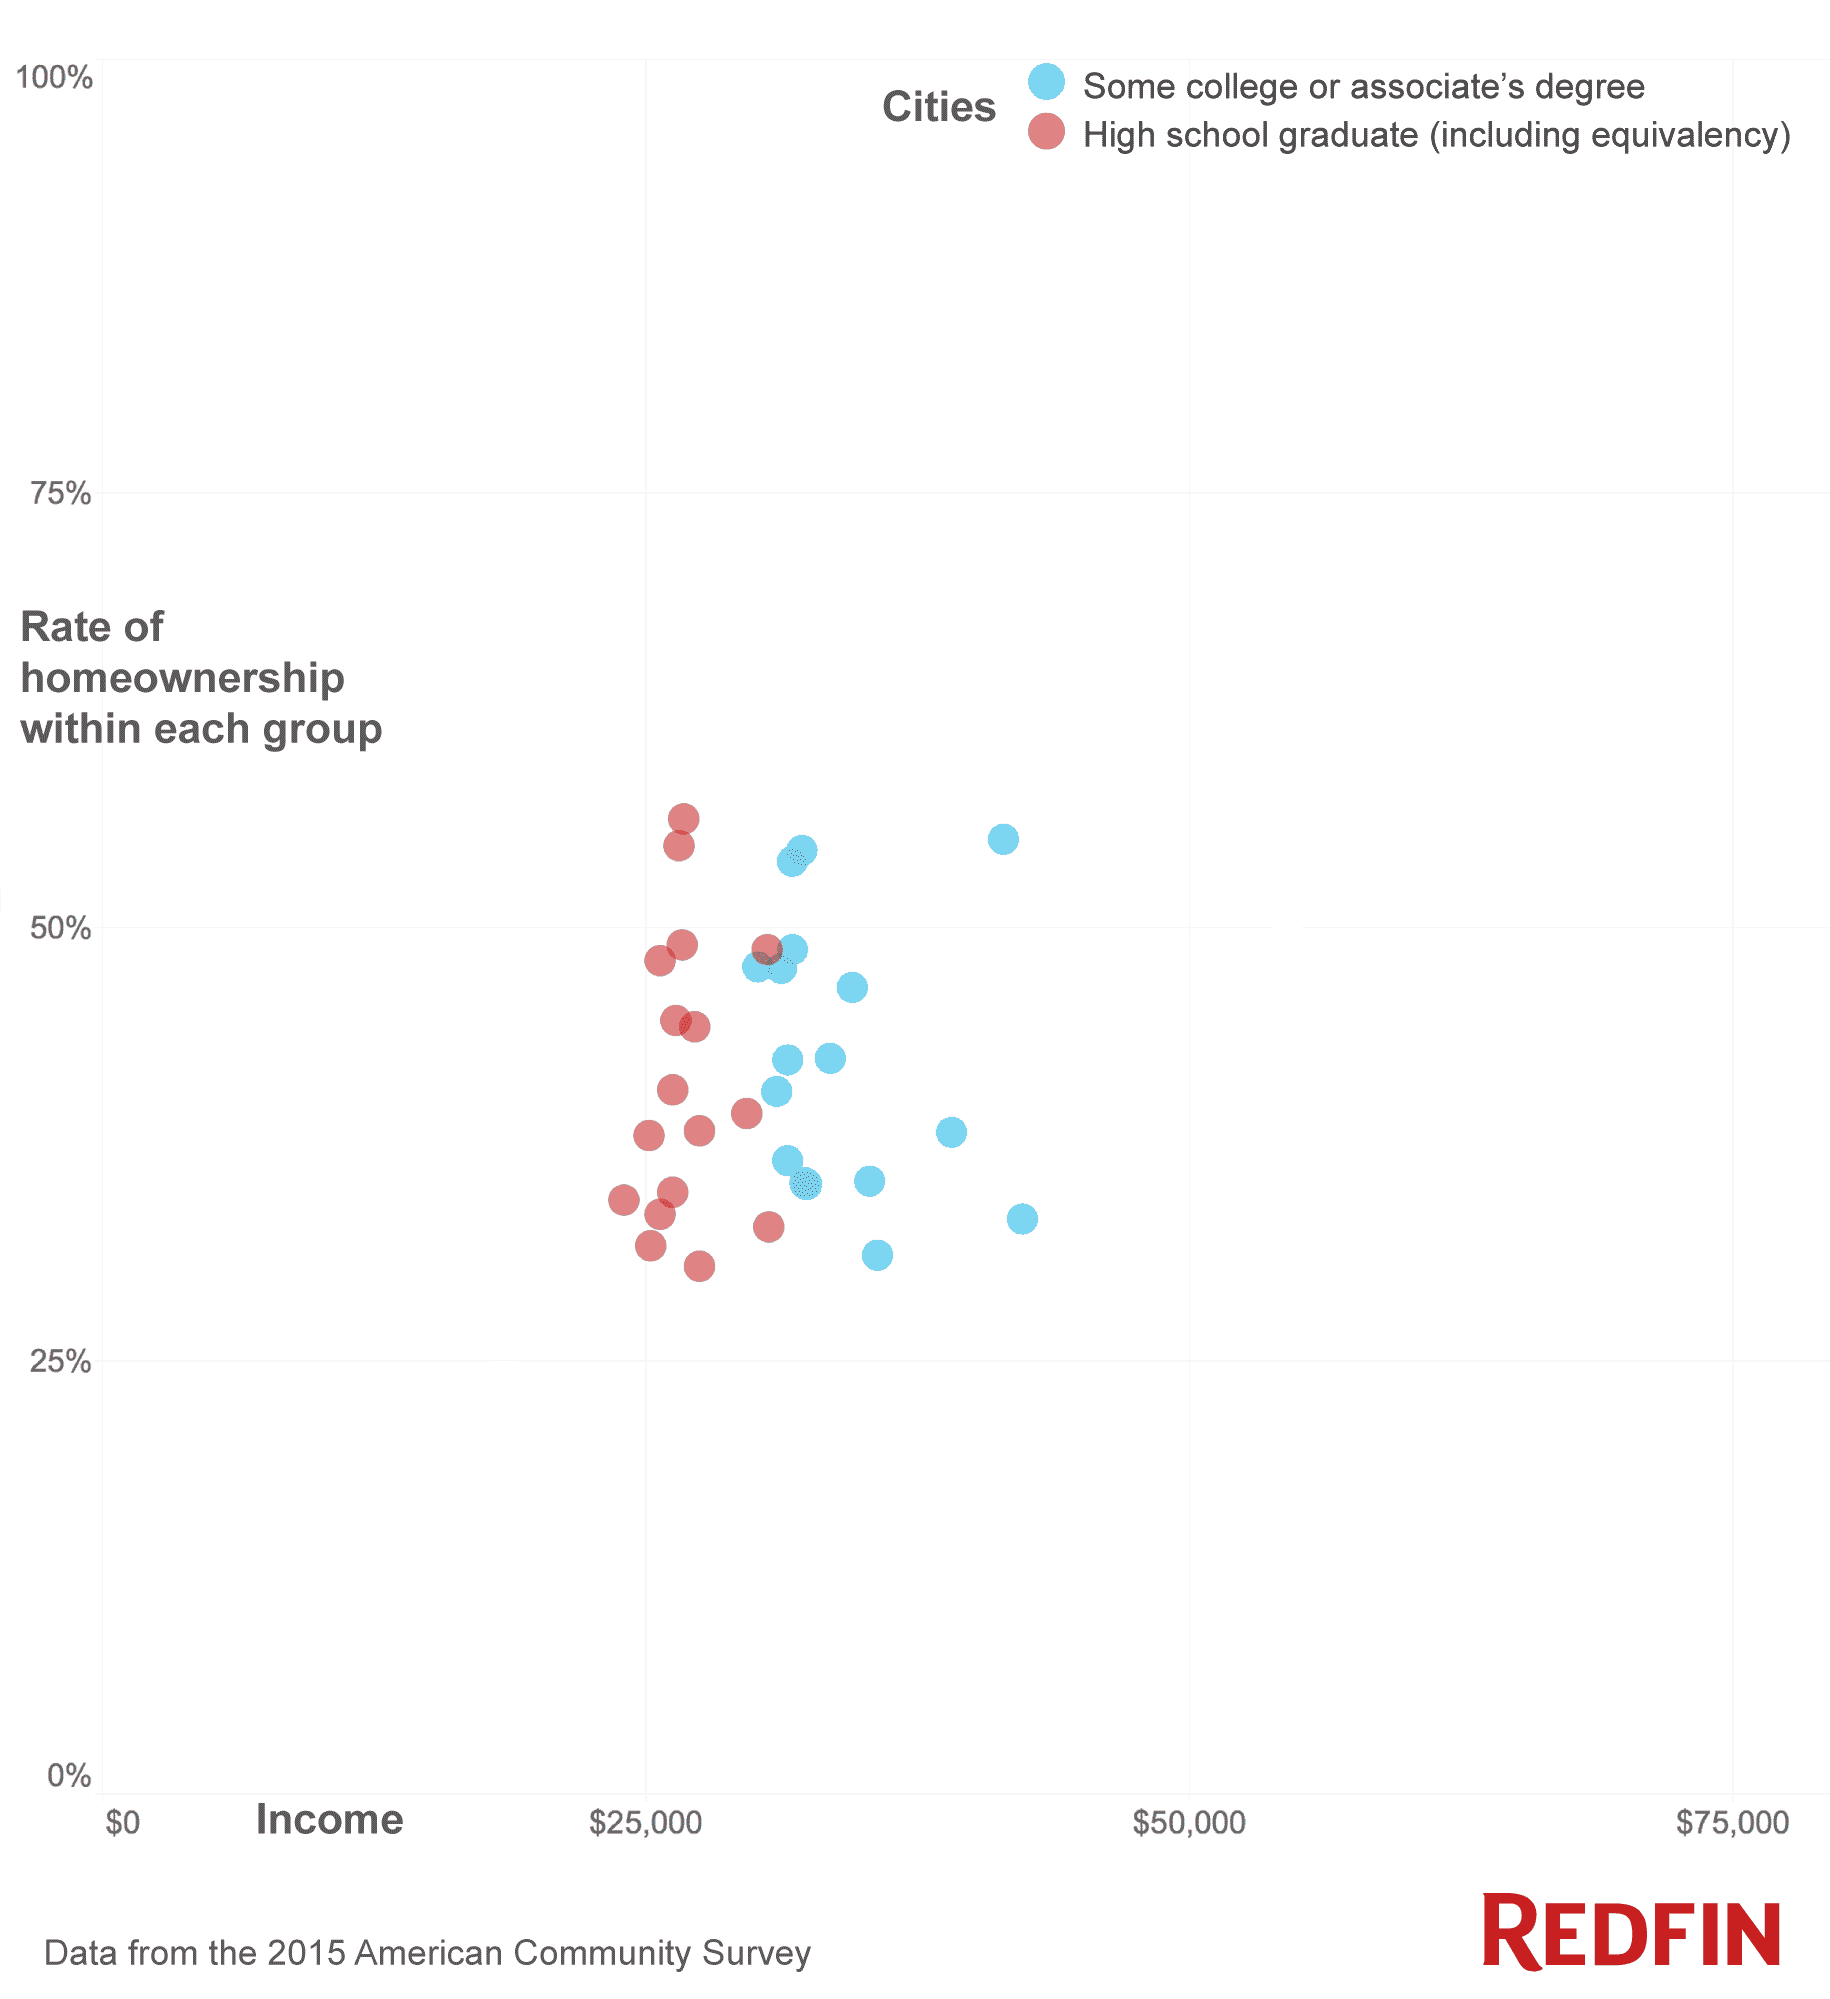
One possible explanation could be student loans, which create an extra monthly payment that trims leverage off a home loan application. Even though the some-college group makes more money than the high school graduates, the average monthly payoff of $242 for student loans cuts $57,000 off of the top of a home loan, and this moves a whole basket of homes out of reach.
The shared declines are only part of the picture. The most educated households are less vulnerable to foreclosures than the least educated, probably because the most educated households tend to make more money. This could mean the current sorting will remain the same until a future economic shock–like a another housing or job crisis–will further widen the gap.
Data
Data came from the American Community Survey and the American Housing Survey.
Other popular posts:
1. How Parents Can Grant Teens Privacy While Overseeing Their Well-Being at Home
2. How to Create the Ultimate Hobby Room for Kids
3. The Senior’s Guide to Moving in with a Roommate
 United States
 Canada