The median home sale price increased 6.8 percent in May to $288,000. Sales increased 7.5 percent compared to last year, a strong gain despite a severe shortage in the number of homes for sale.
| Market Summary | May 2017 | Month-Over-Month | Year-Over-Year |
|---|---|---|---|
| Median sale price | $288,000 | 2.9% | 6.8% |
| Homes sold | 287,000 | 19.5% | 7.5% |
| New listings | 360,800 | 9.6% | 3.0% |
| All Homes for sale | 769,200 | 2.4% | -10.9% |
| Median days on market | 37 | -4 | -7 |
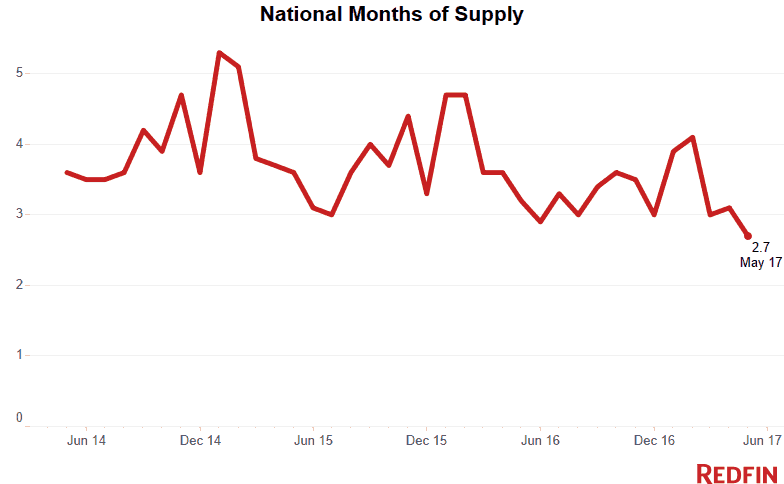
| Months of supply | 2.7 | -0.4 | -0.5 |
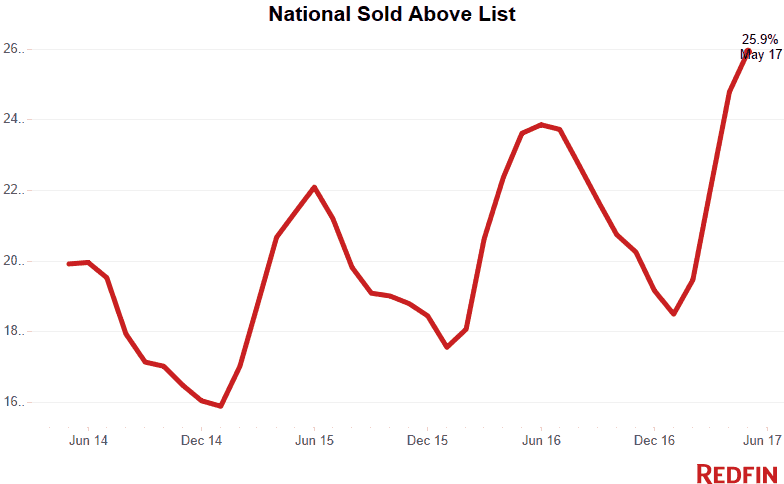
| Sold above list | 25.9% | 1.1% | 2.3% |
| Average Sale-to-list | 95.4% | 0.5% | 0.5% |
The number of homes for sale fell 10.9 percent, marking 20 straight months of year-over-year declines. The number of homes newly listed for sale in May increased 3 percent, but buyers tore through the small but welcome bump in fresh inventory before it could begin to make a dent in the long-standing supply shortage. There was a 2.7-month supply of homes left in May—the lowest Redfin has recorded since we began tracking the market in 2010—well below the six months that represents a market balanced between buyers and sellers.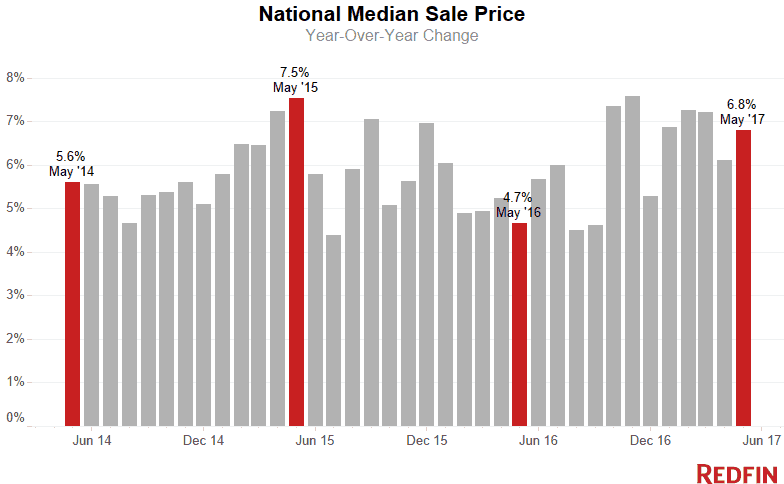
The typical home went under contract in 37 days, setting a new record for home-selling speeds. More than a quarter (25.9%) of homes sold above their list price, the highest percentage Redfin has recorded. The median sale-to-list price ratio set yet another record, hitting 95.4 percent in May.
“There is still a lot of momentum in home prices in many metros, not only on the coasts but also in places like Buffalo, Grand Rapids and Omaha,” said Redfin chief economist Nela Richardson. “Strong local economic growth and burgeoning demand from older millennials are accelerating home-price growth in this very competitive, low-inventory pre-summer market. The Federal Reserve’s announcement yesterday to raise short-term rates will have very little effect on buyer demand or the overall housing market. If anything, it may motivate buyers to make their purchases sooner rather than later.”
In a Redfin-commissioned survey conducted last month, more than 1,000 homebuyers responded to a question about the effect a hypothetical rate hike above 5 percent would have on their home-buying plans. A quarter said it would have no impact, while nearly as many (23%) said they would increase their urgency to buy before rates went up further. Twenty-nine percent said they would slow down their search and see if rates came back down, 18 percent said their urgency wouldn’t change, but they would look in other areas or buy a smaller home. Just 5 percent said they would cancel their home-buying plans all together.
Denver was the fastest-moving market for the third month in a row, with the typical home finding a buyer in just six days. Denver home sales were strong in May, up 18.9 percent compared to last year, despite the fact that the region had just a one month supply of homes for sale. Prices in the metro area rose 5.3 percent.
In the other markets that made up the top-five fastest–Seattle, Grand Rapids, Portland and Omaha–homes spent fewer than 10 days on the market before finding a buyer.
Redfin agent Dakotah Smith was not surprised to see Omaha among the fastest housing markets in the nation. “Omaha is seeing increased interest from buyers from more expensive coastal cities, who recognize that our city offers the rare combination of livability, a thriving jobs market and low cost of living.”
The median sale price in Omaha was $187,000 in May, 9.9 percent higher than a year ago, but still far below that of many coastal cities. A dearth of homes for sale has created competitive conditions for buyers. Smith says that well-priced homes are often off the market in the first weekend and competitive escalation clauses are common. Inventory in Omaha fell 22.5 percent in May and more than 30 percent of homes sold for more than the listing price.
Smith explains Omaha is part of the emerging “Silicon Prairie,” a cluster of Midwestern cities with blossoming tech sectors. “Not too many years ago, it was rare for someone to move to Omaha unless they had family here or were stationed in the military. Today I frequently work with buyers who are moving here from other states. Startups are taking advantage of lower overhead costs and pulling tech talent from the universities in the region. As many Millennials begin to start families, they are looking for cities where they can afford to buy a home and raise a family.”
Other May Highlights
Competition
- Denver, CO was the fastest market for the third month in a row, with nearly half of all homes pending sale in just 6 days. Seattle, WA was the next fastest markets with 7 median days on market, followed by Grand Rapids, MI (8) Portland, OR (8) and Omaha, NE (9).
- The most competitive market in May was San Jose, CA where 74.1% of homes sold above list price, followed by 70.9% in Oakland, CA, 70.1% in San Francisco, CA, 64.1% in Seattle, WA, and 51.8% in Tacoma, WA.
Prices
- Seattle, WA had the nation’s highest price growth, rising 15.9% since last year to $510,000. Lakeland, FL had the second highest growth at 15.1% year-over-year price growth, followed by Tampa, FL (13.2%), Memphis, TN (13%), and Manchester, NH (12.2%).
- Two metros saw slight price declines in May including Albany, NY (-0.9%), and Baton Rouge, LA (-0.6%).
Sales
- In 29 out of 89 metros, sales surged by double digits from last year. Poughkeepsie, NY led the nation in year-over-year sales growth, up 44.4%, followed by Memphis, TN, up 40.2%. Philadelphia, PA rounded out the top three with sales up 28.3% from a year ago.
- Rochester, NY had the largest decline in sales since last year, falling 14.3%. Home sales in Santa Rosa, CA and Buffalo, NY declined by 11.2% and 10.3%, respectively.
Inventory
- Rochester, NY had the largest decrease in overall inventory, falling 35.7% since last May. Buffalo, NY (-31.9%), San Jose, CA (-31.0%), and Seattle, WA (-27.1%) also had far fewer homes available on the market than a year ago.
- Ogden, UT had the highest increase in the number of homes for sale, up 41.4% year over year, followed by Provo, UT (34.9%) and Fort Myers, FL (27.3%).
Below are market-by-market breakdowns for prices, inventory, new listings and sales for markets with populations of 1.5 million or more. For downloadable data on all of the markets Redfin tracks, visit the Redfin Data Center.
| Month-Over-Month | Year-Over-Year | ||
|---|---|---|---|
| Atlanta, GA | $220,000 | 1.4% | 4.8% |
| Austin, TX | $310,000 | 2.5% | 8.8% |
| Baltimore, MD | $272,000 | 6.7% | 8.8% |
| Boston, MA | $400,000 | 5.3% | 8.1% |
| Charlotte, NC | $229,000 | -0.9% | 9.1% |
| Chicago, IL | $244,000 | 1.9% | 6.6% |
| Cincinnati, OH | $164,000 | -0.6% | 1.9% |
| Cleveland, OH | $143,000 | 5.9% | 7.9% |
| Columbus, OH | $196,000 | 7.0% | 8.9% |
| Dallas-Fort Worth, TX | $266,000 | 3.9% | 11.3% |
| Denver, CO | $378,000 | -0.5% | 5.3% |
| Detroit, MI | $172,000 | 6.2% | 8.9% |
| Edison, NJ | $287,000 | -0.7% | 0.7% |
| Fort Lauderdale, FL | $243,000 | 6.8% | 10.5% |
| Hampton Roads, VA | $223,000 | 2.3% | 1.4% |
| Houston, TX | $235,000 | 3.1% | 4.4% |
| Indianapolis, IN | $170,000 | 3.1% | 6.2% |
| Kansas City, MO | $198,200 | 6.7% | 4.4% |
| Las Vegas, NV | $235,000 | 2.2% | 10.3% |
| Long Island, NY | $401,800 | 0.4% | 8.4% |
| Los Angeles, CA | $575,000 | 2.7% | 6.5% |
| Miami, FL | $275,000 | -1.5% | 10.0% |
| Milwaukee, WI | $198,500 | -4.1% | 7.3% |
| Minneapolis-St. Paul, MN | $250,000 | 2.0% | 6.4% |
| Nashville, TN | $270,000 | 2.2% | 8.0% |
| Oakland, CA | $700,000 | 2.9% | 8.5% |
| Orange County, CA | $675,000 | 2.3% | 6.4% |
| Orlando, FL | $223,000 | 1.4% | 11.6% |
| Philadelphia, PA | $250,100 | 5.6% | 6.4% |
| Phoenix, AZ | $242,000 | 2.7% | 5.7% |
| Pittsburgh, PA | $160,000 | 7.5% | 4.6% |
| Portland, OR | $371,900 | 1.9% | 10.0% |
| Riverside-San Bernardino, CA | $340,000 | 1.5% | 7.9% |
| Sacramento, CA | $375,000 | 5.6% | 8.1% |
| San Antonio, TX | $212,000 | 1.0% | 3.4% |
| San Diego, CA | $540,000 | 1.9% | 8.0% |
| San Francisco, CA | $1,290,000 | 3.2% | 8.6% |
| San Jose, CA | $983,500 | 2.4% | 5.2% |
| Seattle, WA | $510,000 | 1.0% | 15.9% |
| St. Louis, MO | $174,000 | 4.0% | 2.9% |
| Tampa, FL | $210,000 | 3.4% | 13.2% |
| Washington, DC | $405,000 | 3.1% | 5.2% |
| National | $288,000 | 2.9% | 6.8% |
Homes Sold
| Redfin Metro | Homes Sold | Month-Over-Month | Year-Over-Year |
|---|---|---|---|
| Atlanta, GA | 11,677 | 25.2% | 11.4% |
| Austin, TX | 3,187 | 19.5% | 0.8% |
| Baltimore, MD | 4,245 | 4.5% | 15.0% |
| Boston, MA | 6,014 | 35.7% | -0.5% |
| Charlotte, NC | 3,273 | 16.3% | 3.1% |
| Chicago, IL | 14,232 | 32.2% | 24.1% |
| Cincinnati, OH | 2,601 | 24.3% | -2.8% |
| Cleveland, OH | 2,787 | 28.6% | 4.2% |
| Columbus, OH | 3,081 | 26.5% | 10.8% |
| Dallas-Fort Worth, TX | 9,059 | 17.0% | 1.4% |
| Denver, CO | 5,911 | 20.3% | 18.9% |
| Detroit, MI | 5,977 | 7.2% | 8.8% |
| Edison, NJ | 3,203 | 23.2% | 26.5% |
| Fort Lauderdale, FL | 3,604 | 17.4% | -0.6% |
| Hampton Roads, VA | 2,557 | 33.1% | 16.9% |
| Houston, TX | 8,283 | 21.0% | 7.7% |
| Indianapolis, IN | 3,195 | 17.0% | -3.7% |
| Kansas City, MO | 3,542 | 25.6% | -4.1% |
| Las Vegas, NV | 4,229 | 20.5% | 11.6% |
| Long Island, NY | 2,232 | 9.1% | 12.7% |
| Los Angeles, CA | 6,972 | 18.2% | 3.2% |
| Miami, FL | 2,967 | 12.9% | 6.2% |
| Milwaukee, WI | 1,975 | 16.8% | -3.8% |
| Minneapolis-St. Paul, MN | 6,628 | 21.5% | 14.8% |
| Nashville, TN | 3,513 | 23.4% | 16.5% |
| Oakland, CA | 2,580 | 14.9% | -0.5% |
| Orange County, CA | 3,123 | 16.4% | 1.5% |
| Orlando, FL | 4,756 | 15.5% | 26.1% |
| Philadelphia, PA | 5,716 | 40.5% | 28.3% |
| Phoenix, AZ | 9,719 | 13.2% | 12.8% |
| Pittsburgh, PA | 2,521 | 16.3% | 11.9% |
| Portland, OR | 3,808 | 26.3% | -3.9% |
| Riverside-San Bernardino, CA | 5,722 | 15.1% | 9.3% |
| Sacramento, CA | 3,025 | 14.5% | -1.7% |
| San Antonio, TX | 2,749 | 23.6% | 0.6% |
| San Diego, CA | 3,554 | 9.8% | -1.6% |
| San Francisco, CA | 1,373 | 16.7% | 1.9% |
| San Jose, CA | 1,612 | 19.4% | 2.2% |
| Seattle, WA | 4,914 | 30.6% | 5.2% |
| St. Louis, MO | 4,124 | 15.9% | 2.0% |
| Tampa, FL | 6,425 | 11.1% | 16.3% |
| Washington, DC | 9,690 | 20.9% | 11.4% |
| National | 287,000 | 19.5% | 7.5% |
All Homes for Sale
| Redfin Metro | All Homes for Sale | Month-Over-Month | Year-Over-Year |
|---|---|---|---|
| Atlanta, GA | 34,096 | 13.6% | -2.3% |
| Austin, TX | 7,398 | 5.0% | 18.3% |
| Baltimore, MD | 10,402 | -0.9% | -19.1% |
| Boston, MA | 11,439 | 3.9% | -19.7% |
| Charlotte, NC | 10,697 | 5.0% | -7.4% |
| Chicago, IL | 44,354 | 2.2% | -14.8% |
| Cincinnati, OH | 8,328 | 3.1% | -16.8% |
| Cleveland, OH | 8,715 | -0.9% | -19.6% |
| Columbus, OH | 6,854 | 3.2% | -12.6% |
| Dallas-Fort Worth, TX | 16,956 | -3.2% | -5.2% |
| Denver, CO | 5,993 | 5.2% | -4.8% |
| Detroit, MI | 10,892 | 4.2% | -25.0% |
| Edison, NJ | 13,696 | -5.1% | -14.7% |
| Fort Lauderdale, FL | 14,509 | 2.4% | -4.5% |
| Hampton Roads, VA | 7,805 | 0.0% | -11.9% |
| Houston, TX | 26,153 | 2.1% | 6.3% |
| Indianapolis, IN | 6,536 | -1.5% | -23.1% |
| Las Vegas, NV | 10,786 | -3.9% | -25.5% |
| Long Island, NY | 11,260 | 1.9% | -20.2% |
| Los Angeles, CA | 15,767 | -1.9% | -3.8% |
| Miami, FL | 17,646 | -0.9% | -4.8% |
| Milwaukee, WI | 6,522 | 3.9% | -12.2% |
| Minneapolis-St. Paul, MN | 11,565 | 4.8% | -14.3% |
| Nashville, TN | 9,289 | 4.6% | 9.8% |
| Oakland, CA | 2,744 | -3.7% | -18.6% |
| Orange County, CA | 7,497 | 0.1% | -9.2% |
| Orlando, FL | 9,655 | -3.5% | -22.9% |
| Philadelphia, PA | 15,306 | 3.3% | -16.5% |
| Phoenix, AZ | 20,534 | -8.3% | -15.2% |
| Pittsburgh, PA | 10,351 | 1.9% | -12.1% |
| Portland, OR | 5,136 | 11.0% | -5.1% |
| Riverside-San Bernardino, CA | 14,910 | -4.7% | -10.3% |
| Sacramento, CA | 4,483 | 7.5% | -23.6% |
| San Antonio, TX | 7,477 | -1.2% | -10.3% |
| San Diego, CA | 5,362 | -1.2% | -22.7% |
| San Francisco, CA | 1,979 | -6.4% | -15.6% |
| San Jose, CA | 1,650 | -2.3% | -31.0% |
| Seattle, WA | 3,883 | 11.3% | -27.1% |
| St. Louis, MO | 14,709 | 15.4% | 2.7% |
| Tampa, FL | 12,271 | -5.8% | -26.8% |
| Washington, DC | 17,096 | -0.5% | -19.0% |
| National | 769,200 | 2.4% | -10.9% |
New Listings
| Redfin Metro | New Listings | Month-Over-Month | Year-Over-Year |
|---|---|---|---|
| Atlanta, GA | 13,207 | 9.5% | 3.3% |
| Austin, TX | 4,479 | 10.9% | 15.6% |
| Baltimore, MD | 5,436 | 0.5% | 1.4% |
| Boston, MA | 9,769 | 17.7% | 6.0% |
| Charlotte, NC | 3,946 | 6.5% | 2.1% |
| Chicago, IL | 16,588 | 7.2% | -4.8% |
| Cincinnati, OH | 3,035 | 8.5% | -1.8% |
| Cleveland, OH | 3,565 | 7.3% | 0.2% |
| Columbus, OH | 3,683 | 12.5% | 7.1% |
| Dallas-Fort Worth, TX | 11,846 | 14.0% | 12.5% |
| Denver, CO | 6,500 | 8.1% | 0.0% |
| Detroit, MI | 8,244 | 22.9% | -0.2% |
| Edison, NJ | 4,922 | 8.8% | 5.1% |
| Fort Lauderdale, FL | 4,311 | 8.5% | 2.0% |
| Hampton Roads, VA | 3,037 | 13.7% | 10.6% |
| Houston, TX | 11,561 | 7.9% | 12.5% |
| Indianapolis, IN | 3,507 | 5.0% | -2.0% |
| Kansas City, MO | 3,939 | 2.3% | -2.4% |
| Las Vegas, NV | 4,379 | 7.1% | 0.2% |
| Long Island, NY | 4,222 | 8.6% | -2.3% |
| Los Angeles, CA | 9,042 | 8.5% | 2.9% |
| Miami, FL | 4,565 | 14.0% | 5.4% |
| Milwaukee, WI | 2,516 | 8.6% | -2.7% |
| Minneapolis-St. Paul, MN | 7,905 | 10.8% | -1.3% |
| Nashville, TN | 4,285 | 12.9% | 5.6% |
| Oakland, CA | 3,260 | 7.9% | -1.8% |
| Orange County, CA | 3,837 | 5.3% | -2.8% |
| Orlando, FL | 5,135 | 8.4% | 7.9% |
| Philadelphia, PA | 6,712 | 2.8% | 3.1% |
| Phoenix, AZ | 9,530 | 1.6% | 5.7% |
| Pittsburgh, PA | 2,981 | 4.2% | 1.1% |
| Portland, OR | 4,859 | 17.9% | 0.4% |
| Riverside-San Bernardino, CA | 6,793 | 7.3% | -1.1% |
| Sacramento, CA | 4,100 | 18.2% | 1.0% |
| San Antonio, TX | 3,808 | 18.6% | 15.6% |
| San Diego, CA | 4,310 | 10.5% | 0.1% |
| San Francisco, CA | 1,544 | 7.9% | -7.3% |
| San Jose, CA | 1,796 | 8.3% | -4.8% |
| Seattle, WA | 6,223 | 26.7% | 5.9% |
| St. Louis, MO | 5,244 | 8.9% | 7.2% |
| Tampa, FL | 6,603 | 6.2% | 6.9% |
| Washington, DC | 11,695 | 1.5% | 5.7% |
| National | 360,800 | 9.6% | 3.0% |
 United States
 Canada