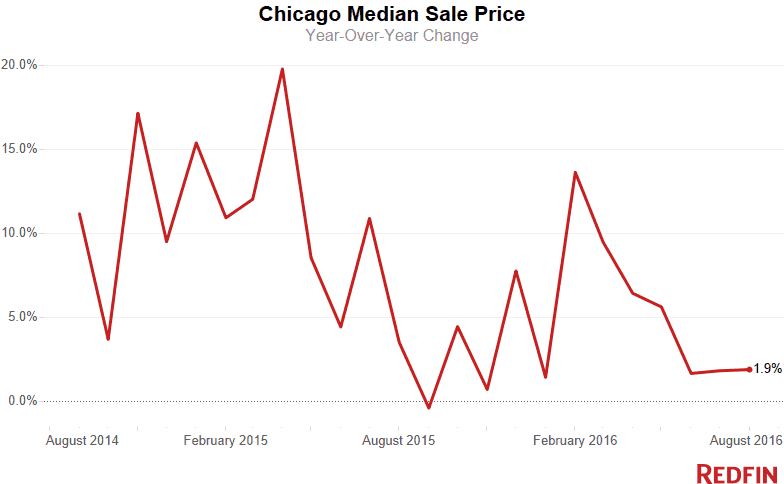
Chicago home prices increased almost two percent in August, as compared to last year, with a typical home selling for $270,000.
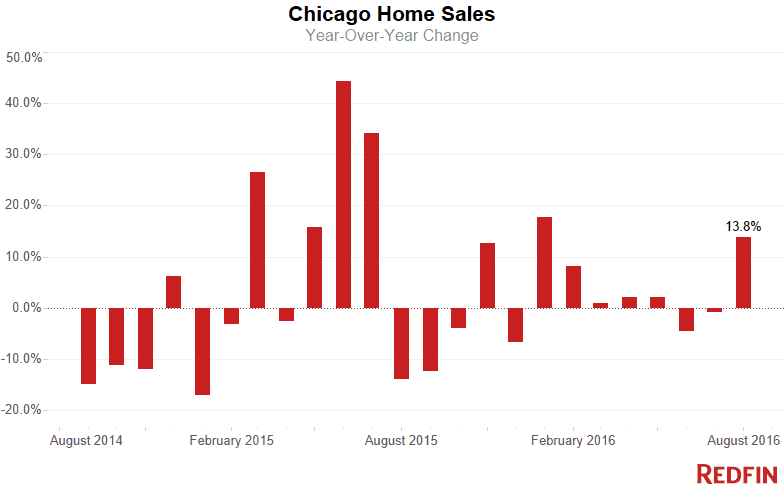
The city saw a nearly 14 percent increase in sales, the largest increase since January.
“August was the last big month of the year for home sales,” said Redfin real estate agent Niko Voutsinas. “A lot of serious spring market buyers moved aggressively to secure properties after failing to move quickly enough on other opportunities, or losing out on multiple offer situations one or more times earlier in the year.”
Serious buyers needed to be aggressive because, like much of the nation, Chicago continues to be plagued by a lack of selection. The number of homes available for purchase dropped nearly 9 percent in August, the twelfth-consecutive month of year-over-year declines. At the end of August, there were approximately 12,400 homes for sale in Chicago, fewer than the nearly 14,000 on the market during the height of last summer.
New listings in August ticked up half a percent compared to last year, while the median days on market declined slightly to 62. Chicago homes sold for an average of 98.4 percent of the list price, with nearly one in four selling for over asking.
Hot Neighborhoods
Among neighborhoods with at least 100 sales in the past three months, Austin showed the highest price increases, with the median sale price rising 23.3 percent to $130,000. Jefferson Park saw prices rise 19.7 percent, to a median sale price of $311,250. Logan Square, Andersonville and Ravenswood rounded out the top five, with all three seeing price increases between 10 and 15 percent.
Brighton Park was the fastest market, with the typical home going under contract in 28 days. Next fastest were Ukrainian Village and the West Loop, which saw market times of 37 and 41 days, respectively. More than half of buyers paid over list price in Humboldt Park, the only neighborhood in Chicago with that distinction, though eight neighborhoods had an average sale-to-list price ratio over 100 percent.
North Center, with its highly rated schools, was the most expensive market in August, with a typical home selling for $611,000. Wicker Park was the next most expensive, with a typical home selling for $544,500. The Gold Coast, Bucktown, Lincoln Park and Roscoe Village all had median sale prices just north of $500,000.
See our city page for the most up-to-date data on Chicago home prices.
Here’s what’s happening in your neighborhood:
| Place | Median Sale Price | Year-Over-Year | Homes Sold | Year-Over-Year | Inventory | Year-Over-Year | New Listings | Median Days on Market | Avg Sale-to-List |
|---|---|---|---|---|---|---|---|---|---|
| Albany Park | $250,000 | -8.9% | 164 | 21.5% | 146 | -19.3% | 163 | 67 | 97.8% |
| Andersonville | $437,500 | 13.4% | 121 | 21.0% | 84 | -8.7% | 92 | 50 | 98.4% |
| Archer Heights | $176,000 | -3.3% | 37 | 42.3% | 27 | -41.3% | 36 | 66 | 99.5% |
| Austin | $130,000 | 23.3% | 193 | 10.9% | 221 | -18.1% | 239 | 55 | 101.2% |
| Avondale | $339,000 | 4.3% | 153 | 17.7% | 124 | -7.5% | 169 | 50 | 98.8% |
| Beverly | $275,000 | -10.7% | 67 | -14.1% | 139 | 6.9% | 111 | 64 | 96.5% |
| Bridgeport | $345,000 | 6.3% | 69 | -1.4% | 100 | -6.5% | 114 | 78 | 96.9% |
| Brighton Park | $168,544 | 29.6% | 61 | 45.2% | 78 | -18.8% | 99 | 28 | 103.0% |
| Bucktown | $515,050 | -4.0% | 206 | 0.0% | 124 | -0.8% | 170 | 43 | 99.3% |
| Clearing | $192,500 | 18.1% | 87 | 16.0% | 101 | -4.7% | 104 | 72 | 97.7% |
| Edgewater | $226,000 | -1.7% | 311 | -3.1% | 263 | -29.5% | 274 | 57 | 96.9% |
| Edison Park | $357,500 | 0.0% | 58 | 0.0% | 56 | -26.3% | 62 | 58 | 96.3% |
| Englewood | $19,000 | -13.9% | 39 | -22.0% | 124 | -10.1% | 83 | 72 | 103.2% |
| Evanston | $315,500 | 12.7% | 146 | 20.7% | 371 | -25.9% | 116 | 67 | 96.6% |
| Garfield Ridge | $210,000 | 9.1% | 146 | 14.1% | 138 | -10.4% | 160 | 67 | 97.4% |
| Gold Coast | $517,750 | 4.6% | 168 | 12.8% | 235 | -8.9% | 171 | 71 | 97.1% |
| Humboldt Park | $160,000 | -8.6% | 108 | 16.1% | 153 | -1.3% | 178 | 47 | 103.8% |
| Hyde Park | $245,000 | 1.7% | 95 | 11.8% | 73 | -21.5% | 79 | 68 | 96.6% |
| Irving Park | $334,000 | 7.7% | 242 | 10.0% | 248 | -11.1% | 258 | 58 | 98.0% |
| Jefferson Park | $311,250 | 19.7% | 128 | 12.3% | 132 | -4.3% | 149 | 58 | 97.7% |
| Joliet | $156,000 | 0.7% | 285 | 0.7% | 774 | -18.7% | 293 | 60 | 98.7% |
| Kenwood | $245,000 | 14.0% | 73 | 37.7% | 96 | -14.3% | 84 | 71 | 95.6% |
| Lakeview | $386,500 | 5.4% | 843 | -5.7% | 694 | -8.1% | 769 | 58 | 98.2% |
| Lincoln Park | $515,000 | 0.6% | 597 | -9.9% | 574 | -10.3% | 585 | 55 | 98.1% |
| Lincoln Square | $372,500 | 8.0% | 223 | 4.2% | 187 | -5.6% | 217 | 62 | 98.0% |
| Logan Square | $374,000 | 13.5% | 279 | 6.5% | 199 | -2.5% | 267 | 43 | 100.5% |
| McKinley Park | $215,000 | 2.4% | 25 | 4.2% | 43 | -2.3% | 45 | 63 | 99.0% |
| Montclare | $189,950 | -14.6% | 28 | -46.2% | 47 | -11.3% | 59 | 62 | 97.9% |
| Mount Greenwood | $209,000 | -2.3% | 100 | 81.8% | 94 | 19.0% | 88 | 63 | 97.4% |
| Naperville | $364,500 | -2.8% | 410 | 37.6% | 1,156 | -10.7% | 268 | 76 | 97.0% |
| Near North Side | $420,000 | 5.0% | 966 | -5.8% | 1,110 | -10.7% | 1,020 | 64 | 98.1% |
| North Center | $611,000 | -0.2% | 133 | -14.2% | 126 | -2.3% | 135 | 57 | 98.1% |
| Old Town | $355,000 | 7.7% | 111 | 1.8% | 83 | -18.6% | 114 | 46 | 98.5% |
| Portage Park | $285,000 | 5.6% | 242 | 18.1% | 210 | -22.5% | 239 | 53 | 99.3% |
| Pullman | $41,000 | -12.8% | 13 | -43.5% | 22 | -26.7% | 24 | 56 | 89.3% |
| Ravenswood | $375,000 | 11.5% | 243 | 0.4% | 179 | 2.9% | 213 | 54 | 98.4% |
| Rogers Park | $182,500 | 1.6% | 182 | 13.8% | 220 | -10.2% | 206 | 66 | 97.8% |
| Roscoe Village | $504,500 | 9.9% | 138 | 5.3% | 126 | -0.8% | 145 | 60 | 98.7% |
| Sauganash | $389,000 | 1.6% | 59 | -19.2% | 66 | -10.8% | 64 | 69 | 97.8% |
| South Lawndale / Little Village | $104,500 | 57.1% | 58 | 31.8% | 62 | -28.7% | 71 | 53 | 98.9% |
| South Loop | $340,000 | 2.7% | 437 | -11.5% | 340 | -15.8% | 441 | 55 | 100.3% |
| South Shore | $95,000 | 58.3% | 78 | 13.0% | 160 | -4.8% | 142 | 82 | 98.7% |
| Streeterville | $440,000 | 2.9% | 261 | -3.3% | 380 | -2.6% | 280 | 83 | 97.2% |
| The Loop | $345,000 | 4.9% | 313 | 4.3% | 315 | -12.0% | 310 | 62 | 98.9% |
| Tri-taylor | $400,000 | 90.6% | 23 | 21.1% | 23 | -37.8% | 34 | 43 | 96.5% |
| Ukrainian Village | $443,000 | -3.3% | 51 | 2.0% | 30 | -21.1% | 36 | 37 | 99.1% |
| Uptown | $249,900 | 8.9% | 301 | 19.4% | 262 | -7.4% | 304 | 52 | 97.6% |
| West Loop | $405,000 | 6.9% | 302 | -14.2% | 201 | 15.5% | 304 | 41 | 100.6% |
| West Town | $460,000 | 4.5% | 672 | -6.9% | 505 | 6.1% | 668 | 42 | 99.3% |
| Wicker Park | $544,500 | -0.5% | 80 | -11.1% | 71 | 6.0% | 88 | 47 | 100.5% |
| Chicago, IL | $270,000 | 1.9% | 3,471 | 13.8% | 12,433 | -8.8% | 3,938 | 62 | 98.4% |
 United States
 Canada