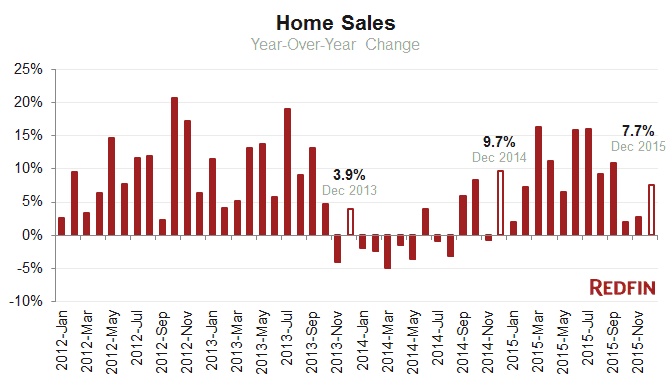
Home prices rose 8.8 percent in December from a year ago, the biggest increase in 22 months. Sales were strong too, up 7.7 percent despite a lack of supply that’s challenging homebuyers. There were fewer homes for sale in December than in any month of 2015.
| Market Summary | December 2015 | Month-Over-Month | Year-Over-Year |
|---|---|---|---|
| Median sale price | $267,500 | 1.6% | 8.8% |
| Homes sold | 164,300 | 22.7% | 7.7% |
| New listings | 130,300 | -21.8% | 3.3% |
| All Homes for sale | 488,600 | -10.3% | -5.4% |
| Median days on market | 41 | 0 | -7 |
| Off market in 2 weeks | 25.9% | -0.9% | 4.5% |
| Months of supply | 3 | -1.1 | -0.4 |
| Sold above list | 17.3% | -0.8% | 2.1% |
| Average Sale-to-list | 91.1% | -0.3% | 0.1% |
Typically, home prices slow along with sales in December. Last month, however, prices spiked due to a dearth of properties on the market. In December, there was a three-month supply of homes for sale, a steep slide from the 4.1 months reported in November. The lack of inventory supported a fast market, where the typical home sold in 41 days, a week faster than a year ago.
“In early December, I had five new listings, all of which received offers within about the first week,” said Christy Alwin, a Redfin agent in Naperville, Ill. “Four had multiple offers. In the end, they were all under contract in less than 18 days. Inventory is low and buyers pounce on new listings as soon as they are available.”
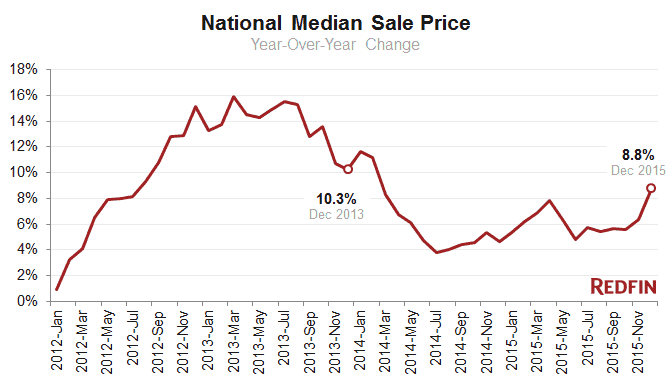
Sales rose 7.7 percent year-over-year, compared to 2.8 percent the previous month, continuing a recent pattern of sales rebounding in December from November. In 2014, December sales grew 9.7 percent after dropping 0.7 percent in November. This seasonal trend casts doubt on the theory that a new mortgage rule, known as TRID or Know Before You Owe, had a significant impact on November or December sales volume.
In total, there were nearly 2 million homes sold (1,969,814 to be exact) in 68 markets tracked by Redfin in 2015, leading to a strong 9.6 percent increase from 2014.
Other December Highlights
Prices
- The median sale price in Hudson Valley, NY, climbed 15.1% from November, posting the biggest gains of any market. Year over year, prices were up 6.3%.
- Twenty-two metro areas continued their double-digit, year-over-year price growth in December, including San Jose (19%), Tacoma, WA, (13.9%), and San Antonio, TX, (11%).
- Only three of 69 metros saw year-over-year price declines in December. In Tulsa, OK, prices fell by 4.4% to $142,000 in December, the largest year-over-year decline of any city that month. Washington, D.C., (-2.8%) and Little Rock, AR, (-2.6%), also posted year-over-year declines.
Sales
- Sales rebounded across the country in December from November, with 64 of 68 markets posting double digit, month-over-month increases. San Jose (71%), San Francisco (29.7%) and, and Nashville (20.2%) had the biggest increase compared to last year.
- Only eight cities saw sales declines in December from a year ago. The largest year-over-year decreases were in Dayton, OH, (-10.7%), Buffalo, NY, (-7.2%) and Miami (-6.8%).
Competition and Speed
- Denver and Oakland tied for the fastest markets, with half of all new listings selling in 18 days or less, followed closely by Seattle where the typical home sold in less than three weeks.
- Bay Area metros San Francisco, Oakland and San Jose were the only cities where, on average, homes sold above list in December. In San Jose, 80% of Redfin offers faced competition. In Oakland 78.6% had multiple offers and in San Francisco the number was 70.6%.
Homes For Sale
- New listings surged at year end in Miami (58.3%) and Fort Lauderdale (26.9%), where sellers see demand from vacation homebuyers. New for-sale listings were up an astounding 80.4% in Miami from a year ago; sellers put more properties on the market in December than in any other month of 2015. Inventory in Miami is up 11.3% year-over-year.
- Houston and the Hudson Valley had the largest increase in homes for sale compared to last year. Inventory was up 32.8% and 26.5% in these metros, respectively
- Two metros had less than a month of supply, Oakland (0.7) and San Francisco (0.9). Eight additional metros had less than two months of supply, including San Jose, Seattle, Denver, Portland, San Diego, Dallas, Ventura County and Tacoma.
You can download data from the November Market Tracker in an Excel Spreadsheet.
For additional local analysis, see: Chicago | Los Angeles | San Francisco | Washington, D.C.
Median Sale Price
| Redfin Metro | Median Sale Price | Month-Over-Month | Year-Over-Year |
|---|---|---|---|
| Akron, OH | $117,750 | -0.2% | 7.0% |
| Albany, NY | $199,000 | -0.5% | 5.3% |
| Allentown, PA | $169,900 | -0.9% | 6.2% |
| Atlanta, GA | $195,000 | 1.0% | 6.0% |
| Austin, TX | $272,000 | -0.4% | 9.3% |
| Baltimore, MD | $235,000 | 2.0% | 2.2% |
| Boston, MA | $335,000 | -0.3% | 2.8% |
| Buffalo, NY | $130,000 | 2.2% | 4.0% |
| Charleston, SC | $243,845 | -2.5% | 9.3% |
| Charlotte, NC | $195,000 | -2.5% | 3.4% |
| Chicago, IL | $197,500 | 1.5% | 9.3% |
| Cincinnati, OH | $146,000 | 4.3% | 5.8% |
| Cleveland, OH | $125,000 | 6.4% | 2.9% |
| Columbus, OH | $158,000 | 0.0% | 4.3% |
| Dallas-Fort Worth, TX | $219,000 | 4.3% | 7.4% |
| Dayton, OH | $104,950 | 22.4% | 39.5% |
| Denver, CO | $312,000 | 0.6% | 9.5% |
| Detroit-Warren, MI | $133,000 | 6.4% | 10.8% |
| Fort Lauderdale, FL | $211,025 | 8.2% | 11.1% |
| Fresno, CA | $225,000 | -2.2% | 10.8% |
| Grand Rapids, MI | $137,000 | 3.4% | 8.7% |
| Greenville, SC | $166,000 | -5.9% | 3.2% |
| Hampton Roads, VA | $210,100 | 2.5% | 5.5% |
| Honolulu, HI | $525,000 | 2.9% | 7.1% |
| Houston, TX | $216,807 | 8.1% | 3.6% |
| Hudson Valley, NY | $420,000 | 15.1% | 6.3% |
| Indianapolis, IN | $142,000 | -2.1% | 5.2% |
| Jacksonville, FL | $178,000 | 6.0% | 3.0% |
| Las Vegas, NV | $200,000 | -1.1% | 5.8% |
| Little Rock, AR | $142,250 | -4.5% | -2.6% |
| Long Island, NY | $375,000 | -1.3% | 1.8% |
| Los Angeles, CA | $498,000 | 3.8% | 9.4% |
| Louisville, KY | $163,000 | 3.2% | 6.5% |
| Memphis, TN | $152,250 | 3.4% | 5.8% |
| Miami, FL | $235,000 | 0.0% | 4.4% |
| Minneapolis-St. Paul, MN | $216,000 | 0.5% | 9.6% |
| Nashville, TN | $231,010 | 1.3% | 7.9% |
| New Orleans, LA | $191,500 | 4.6% | 5.2% |
| North Port, FL | $234,000 | 2.9% | 17.0% |
| Oakland, CA | $579,000 | -3.3% | 10.3% |
| Omaha, NE | $162,500 | 0.3% | 10.5% |
| Orange County, CA | $600,000 | 0.0% | 8.1% |
| Orlando, FL | $189,500 | 3.6% | 11.5% |
| Philadelphia, PA | $226,500 | 0.7% | 1.8% |
| Phoenix, AZ | $219,552 | 3.1% | 9.8% |
| Portland, OR | $308,512 | 2.8% | 10.6% |
| Providence, RI | $215,000 | 3.9% | 12.6% |
| Raleigh-Durham, NC | $228,000 | -1.7% | 9.4% |
| Richmond, VA | $214,950 | 2.4% | 4.9% |
| Riverside-San Bernardino, CA | $306,000 | 2.0% | 5.5% |
| Rochester, NY | $132,500 | 6.0% | 10.4% |
| Sacramento, CA | $320,000 | 0.5% | 8.5% |
| San Antonio, TX | $197,000 | 6.5% | 11.0% |
| San Diego, CA | $470,000 | -0.4% | 6.8% |
| San Francisco, CA | $1,000,000 | -2.9% | 14.9% |
| San Jose, CA | $815,000 | -2.4% | 19.0% |
| Seattle, WA | $399,998 | -0.9% | 10.8% |
| Tacoma, WA | $257,500 | 5.1% | 13.9% |
| Tampa, FL | $172,000 | 3.9% | 11.0% |
| Tucson, AZ | $179,850 | 3.7% | 6.7% |
| Tulsa, OK | $142,000 | -5.3% | -4.4% |
| Ventura County, CA | $515,000 | -2.8% | 6.2% |
| Washington, DC | $349,900 | -2.8% | -2.8% |
| West Palm Beach, FL | $237,500 | 3.3% | 14.2% |
| Wilmington, DE | $208,000 | 4.0% | 10.1% |
| National | $267,500 | 1.6% | 8.8% |
Homes Sold
| Redfin Metro | Homes Sold | Month-Over-Month | Year-Over-Year |
|---|---|---|---|
| Akron, OH | 723 | 25.7% | 0.8% |
| Albany, NY | 678 | 11.7% | 4.1% |
| Allentown, PA | 601 | 9.9% | -2.6% |
| Atlanta, GA | 7,892 | 27.8% | 10.6% |
| Austin, TX | 2,308 | 29.4% | 0.7% |
| Baltimore, MD | 3,067 | 24.4% | 8.4% |
| Boston, MA | 6,228 | 20.3% | 14.7% |
| Buffalo, NY | 803 | 0.4% | -7.2% |
| Charleston, SC | 1,253 | 33.9% | 17.3% |
| Charlotte, NC | 2,499 | 24.3% | 5.5% |
| Chicago, IL | 8,151 | 20.6% | 3.2% |
| Cincinnati, OH | 1,661 | 19.0% | 10.5% |
| Cleveland, OH | 1,971 | 17.9% | 13.2% |
| Columbus, OH | 1,840 | 14.1% | 7.8% |
| Dallas-Fort Worth, TX | 7,315 | 27.4% | 9.9% |
| Dayton, OH | 50 | 31.6% | -10.7% |
| Denver, CO | 4,268 | 22.5% | 9.2% |
| Detroit-Warren, MI | 5,084 | 9.9% | 4.4% |
| Fort Lauderdale, FL | 2,759 | 14.9% | -0.6% |
| Fresno, CA | 704 | 26.2% | 2.2% |
| Grand Rapids, MI | 855 | 16.5% | 10.8% |
| Greenville, SC | 687 | 32.4% | 5.2% |
| Hampton Roads, VA | 1,541 | 16.8% | 1.0% |
| Honolulu, HI | 729 | 17.4% | 3.8% |
| Houston, TX | 6,430 | 34.0% | 2.5% |
| Hudson Valley, NY | 1,139 | 19.9% | 10.6% |
| Indianapolis, IN | 2,179 | 21.1% | 3.3% |
| Jacksonville, FL | 1,843 | 20.3% | 0.0% |
| Las Vegas, NV | 3,202 | 32.4% | 19.3% |
| Little Rock, AR | 680 | 18.3% | 14.3% |
| Long Island, NY | 2,200 | 6.6% | 9.9% |
| Los Angeles, CA | 5,934 | 34.3% | 7.9% |
| Louisville, KY | 1,101 | 18.6% | 10.3% |
| Memphis, TN | 886 | 22.7% | 3.3% |
| Miami, FL | 2,363 | 2.9% | -6.8% |
| Minneapolis-St. Paul, MN | 3,751 | 15.8% | 12.7% |
| Nashville, TN | 2,740 | 29.5% | 20.2% |
| New Orleans, LA | 1,023 | 12.5% | 4.0% |
| North Port, FL | 1,569 | 24.8% | -4.6% |
| Oakland, CA | 2,301 | 17.0% | 8.1% |
| Omaha, NE | 895 | 17.8% | 11.0% |
| Orange County, CA | 2,382 | 26.8% | 8.8% |
| Orlando, FL | 3,389 | 24.1% | 0.3% |
| Philadelphia, PA | 3,740 | 22.7% | 6.4% |
| Phoenix, AZ | 6,373 | 26.9% | 3.9% |
| Portland, OR | 3,234 | 19.2% | 14.8% |
| Providence, RI | 815 | 15.9% | 6.0% |
| Raleigh-Durham, NC | 2,350 | 33.4% | 13.4% |
| Richmond, VA | 1,218 | 23.4% | 18.0% |
| Riverside-San Bernardino, CA | 4,377 | 29.2% | 9.1% |
| Rochester, NY | 840 | 4.5% | -3.4% |
| Sacramento, CA | 2,603 | 24.5% | 12.3% |
| San Antonio, TX | 2,060 | 26.4% | 16.3% |
| San Diego, CA | 2,914 | 30.7% | 6.4% |
| San Francisco, CA | 1,135 | 11.3% | 29.7% |
| San Jose, CA | 1,278 | 21.5% | 71.1% |
| Seattle, WA | 3,589 | 19.3% | 10.2% |
| Tacoma, WA | 1,103 | 23.8% | 18.3% |
| Tampa, FL | 4,745 | 24.4% | 2.6% |
| Tucson, AZ | 1,167 | 40.6% | 14.9% |
| Tulsa, OK | 934 | 13.8% | 0.8% |
| Ventura County, CA | 692 | 30.6% | 6.0% |
| Washington, DC | 6,265 | 25.0% | 10.3% |
| West Palm Beach, FL | 2,580 | 26.3% | -4.4% |
| Wilmington, DE | 626 | 13.0% | 7.6% |
| National | 164,300 | 22.7% | 7.7% |
New Listings
| Redfin Metro | New Listings | Month-Over-Month | Year-Over-Year |
|---|---|---|---|
| Akron, OH | 609 | -21.4% | -4.2% |
| Albany, NY | 616 | -20.2% | 9.6% |
| Allentown, PA | 697 | -23.7% | 5.3% |
| Atlanta, GA | 5,289 | -18.1% | -1.2% |
| Austin, TX | 1,567 | -24.7% | 6.0% |
| Baltimore, MD | 2,684 | -24.2% | 4.1% |
| Boston, MA | 3,516 | -33.4% | 9.1% |
| Buffalo, NY | 670 | -24.9% | 13.0% |
| Charleston, SC | 1,043 | -19.6% | 5.9% |
| Chicago, IL | 6,999 | -29.2% | -7.5% |
| Cincinnati, OH | 1,449 | -24.4% | -0.4% |
| Cleveland, OH | 1,676 | -23.9% | 0.2% |
| Columbus, OH | 1,230 | -28.8% | -4.2% |
| Dallas-Fort Worth, TX | 5,385 | -22.8% | 7.9% |
| Dayton, OH | 693 | -28.3% | -11.7% |
| Denver, CO | 2,115 | -34.9% | -4.9% |
| Detroit-Warren, MI | 5,299 | -21.8% | -7.6% |
| Fort Lauderdale, FL | 1,631 | 26.9% | 55.8% |
| Fresno, CA | 543 | -30.7% | -15.7% |
| Grand Rapids, MI | 636 | -29.0% | -5.8% |
| Greenville, SC | 618 | -16.6% | 12.6% |
| Hampton Roads, VA | 1,773 | -11.3% | 9.4% |
| Honolulu, HI | 704 | -16.3% | 6.8% |
| Houston, TX | 6,003 | -18.0% | 10.1% |
| Hudson Valley, NY | 720 | -34.5% | 8.8% |
| Indianapolis, IN | 1,970 | -23.7% | 0.4% |
| Jacksonville, FL | 1,755 | -15.0% | -0.2% |
| Las Vegas, NV | 2,899 | -15.1% | 2.4% |
| Little Rock, AR | 788 | -13.1% | 1.2% |
| Long Island, NY | 1,846 | -29.8% | 1.2% |
| Los Angeles, CA | 4,672 | -24.7% | 7.0% |
| Louisville, KY | 889 | -23.6% | -12.5% |
| Memphis, TN | 944 | -6.0% | 9.9% |
| Miami, FL | 3,002 | 58.3% | 80.4% |
| Minneapolis-St. Paul, MN | 2,467 | -32.3% | 1.3% |
| Nashville, TN | 2,562 | -14.8% | 18.0% |
| New Orleans, LA | 1,046 | -22.4% | -7.3% |
| North Port, FL | 1,830 | -17.0% | 1.0% |
| Oakland, CA | 1,072 | -36.7% | -2.5% |
| Omaha, NE | 700 | -27.9% | 1.6% |
| Orange County, CA | 1,882 | -22.9% | 15.0% |
| Orlando, FL | 3,198 | -14.2% | -3.3% |
| Philadelphia, PA | 3,170 | -26.1% | 3.6% |
| Phoenix, AZ | 5,730 | -23.9% | 4.1% |
| Portland, OR | 1,813 | -28.1% | -4.5% |
| Providence, RI | 723 | -25.6% | 9.5% |
| Raleigh-Durham, NC | 1,492 | -26.6% | -8.1% |
| Richmond, VA | 976 | -25.1% | -8.1% |
| Riverside-San Bernardino, CA | 4,829 | -19.7% | 12.9% |
| Rochester, NY | 799 | -20.9% | 11.7% |
| San Antonio, TX | 1,913 | -18.1% | 14.8% |
| San Diego, CA | 2,143 | -29.3% | -3.6% |
| San Francisco, CA | 426 | -49.8% | -0.9% |
| San Jose, CA | 587 | -38.3% | 8.5% |
| Seattle, WA | 1,873 | -24.1% | -2.1% |
| Tacoma, WA | 659 | -30.4% | -12.9% |
| Tampa, FL | 4,419 | -11.8% | -2.8% |
| Tucson, AZ | 1,180 | -18.8% | 4.9% |
| Tulsa, OK | 1,087 | -17.8% | -5.1% |
| Ventura County, CA | 472 | -30.4% | -6.3% |
| Washington, DC | 4,677 | -21.7% | 7.0% |
| West Palm Beach, FL | 3,050 | -12.2% | -2.7% |
| Wilmington, DE | 574 | -27.6% | 1.2% |
| National | 130,300 | -21.8% | 3.3% |
All Homes for Sale
| Redfin Metro | All Homes for Sale | Month-Over-Month | Year-Over-Year |
|---|---|---|---|
| Akron, OH | 2,945 | -10.7% | -8.4% |
| Albany, NY | 3,999 | -10.2% | -5.2% |
| Allentown, PA | 3,585 | -25.2% | -12.3% |
| Atlanta, GA | 20,579 | -10.7% | -9.2% |
| Austin, TX | 4,820 | -14.9% | -3.0% |
| Baltimore, MD | 11,620 | -12.0% | -7.1% |
| Boston, MA | 14,626 | -23.7% | -14.6% |
| Buffalo, NY | 3,503 | -15.1% | -40.3% |
| Charleston, SC | 5,535 | -9.0% | -17.0% |
| Chicago, IL | 36,362 | -6.6% | 2.5% |
| Cincinnati, OH | 8,048 | -12.7% | -11.5% |
| Cleveland, OH | 9,283 | -9.7% | -6.1% |
| Columbus, OH | 5,624 | -1.4% | -4.1% |
| Dallas-Fort Worth, TX | 13,749 | -11.6% | -0.7% |
| Dayton, OH | 4,004 | -10.4% | -7.4% |
| Denver, CO | 5,446 | -12.9% | 24.2% |
| Detroit-Warren, MI | 22,764 | -8.8% | 20.7% |
| Fresno, CA | 1,851 | -12.9% | -9.3% |
| Grand Rapids, MI | 2,363 | -17.2% | -50.3% |
| Greenville, SC | 2,892 | 2.8% | -4.7% |
| Hampton Roads, VA | 8,038 | -7.2% | -5.8% |
| Honolulu, HI | 2,836 | -11.2% | -5.9% |
| Houston, TX | 20,885 | -7.6% | 32.8% |
| Hudson Valley, NY | 7,130 | -5.0% | 26.5% |
| Indianapolis, IN | 8,400 | -12.6% | -20.6% |
| Jacksonville, FL | 6,841 | -8.8% | -17.1% |
| Las Vegas, NV | 13,116 | -9.7% | -5.8% |
| Little Rock, AR | 4,049 | -2.6% | -7.4% |
| Long Island, NY | 12,602 | -10.7% | -8.7% |
| Los Angeles, CA | 11,671 | -15.8% | -13.3% |
| Louisville, KY | 3,443 | -14.3% | -36.6% |
| Miami, FL | 7,394 | 19.9% | 11.3% |
| Minneapolis-St. Paul, MN | 9,869 | -22.7% | -18.3% |
| Nashville, TN | 7,610 | -14.1% | -2.3% |
| North Port, FL | 6,461 | 1.9% | -2.1% |
| Oakland, CA | 1,619 | -35.3% | -25.0% |
| Omaha, NE | 2,292 | -11.5% | -17.3% |
| Orange County, CA | 5,358 | -12.6% | 9.1% |
| Orlando, FL | 11,620 | -6.5% | -16.8% |
| Philadelphia, PA | 16,980 | -15.0% | -9.2% |
| Phoenix, AZ | 20,167 | -1.3% | -6.0% |
| Portland, OR | 4,396 | -20.3% | -36.6% |
| Providence, RI | 3,412 | -15.6% | 0.2% |
| Raleigh-Durham, NC | 7,221 | -3.2% | -0.8% |
| Richmond, VA | 3,952 | -16.4% | -15.5% |
| Riverside-San Bernardino, CA | 15,678 | -5.5% | 9.0% |
| San Antonio, TX | 6,872 | -5.5% | 5.6% |
| San Diego, CA | 5,358 | -16.3% | -19.9% |
| San Francisco, CA | 1,067 | -41.9% | -9.8% |
| San Jose, CA | 1,298 | -36.7% | -25.6% |
| Seattle, WA | 3,616 | -22.2% | -40.9% |
| Tacoma, WA | 2,143 | -19.9% | -33.6% |
| Tampa, FL | 14,955 | -4.6% | -15.2% |
| Tucson, AZ | 5,063 | 3.0% | -3.6% |
| Tulsa, OK | 4,495 | -9.6% | -4.6% |
| Ventura County, CA | 1,318 | -18.3% | -15.3% |
| Washington, DC | 16,226 | -17.1% | -3.0% |
| West Palm Beach, FL | 12,178 | 5.4% | 1.0% |
| Wilmington, DE | 3,374 | -11.4% | -5.5% |
| National | 488,600 | -10.3% | -5.4% |
Other popular posts:
1. Simple Soundproofing Tips for the Musician’s Home
 United States
 Canada