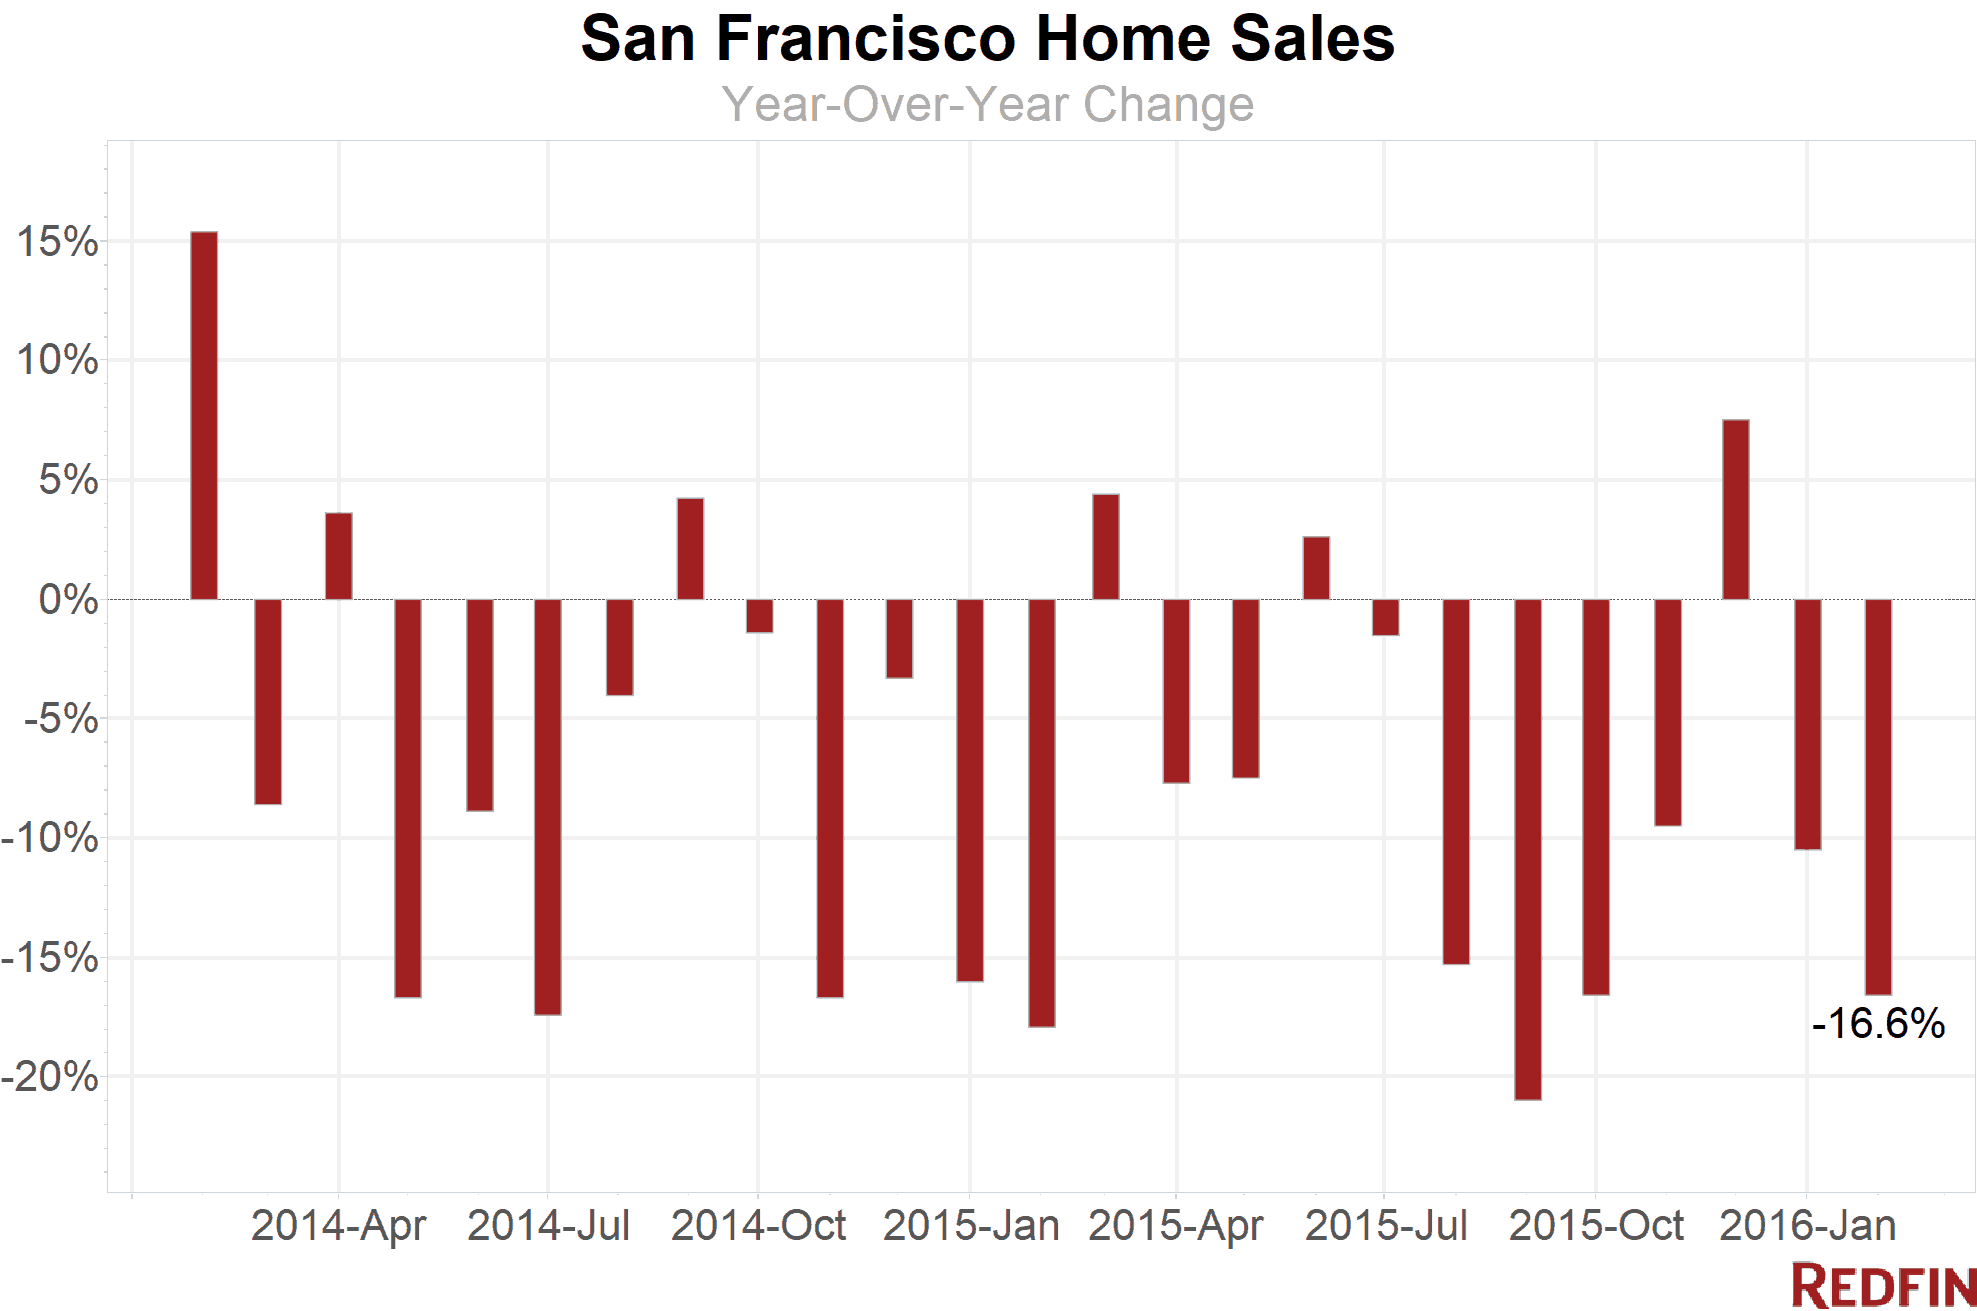
San Francisco sale prices rose 5.9 percent in February from a year earlier to a median $1.2 million. Sales fell for the second straight month, tumbling 16.6 percent amid a shortage of homes on the market.
While the city remains a seller’s market, buyers got good news last month in the form of inventory, which might have had a check on prices. Year over year, the number of homes for sale rose for the sixth-straight month, up 18 percent. That’s the first sustained increase in inventory since 2010.
The city had a 2.1-month supply of homes at the end of the month, the highest since September. Still, San Francisco is a long way from hitting a balance of power between buyers and sellers, which typically is marked by a six-month supply of houses for sale. New listings ticked up slightly compared to the same time last year, the second month of improvement.
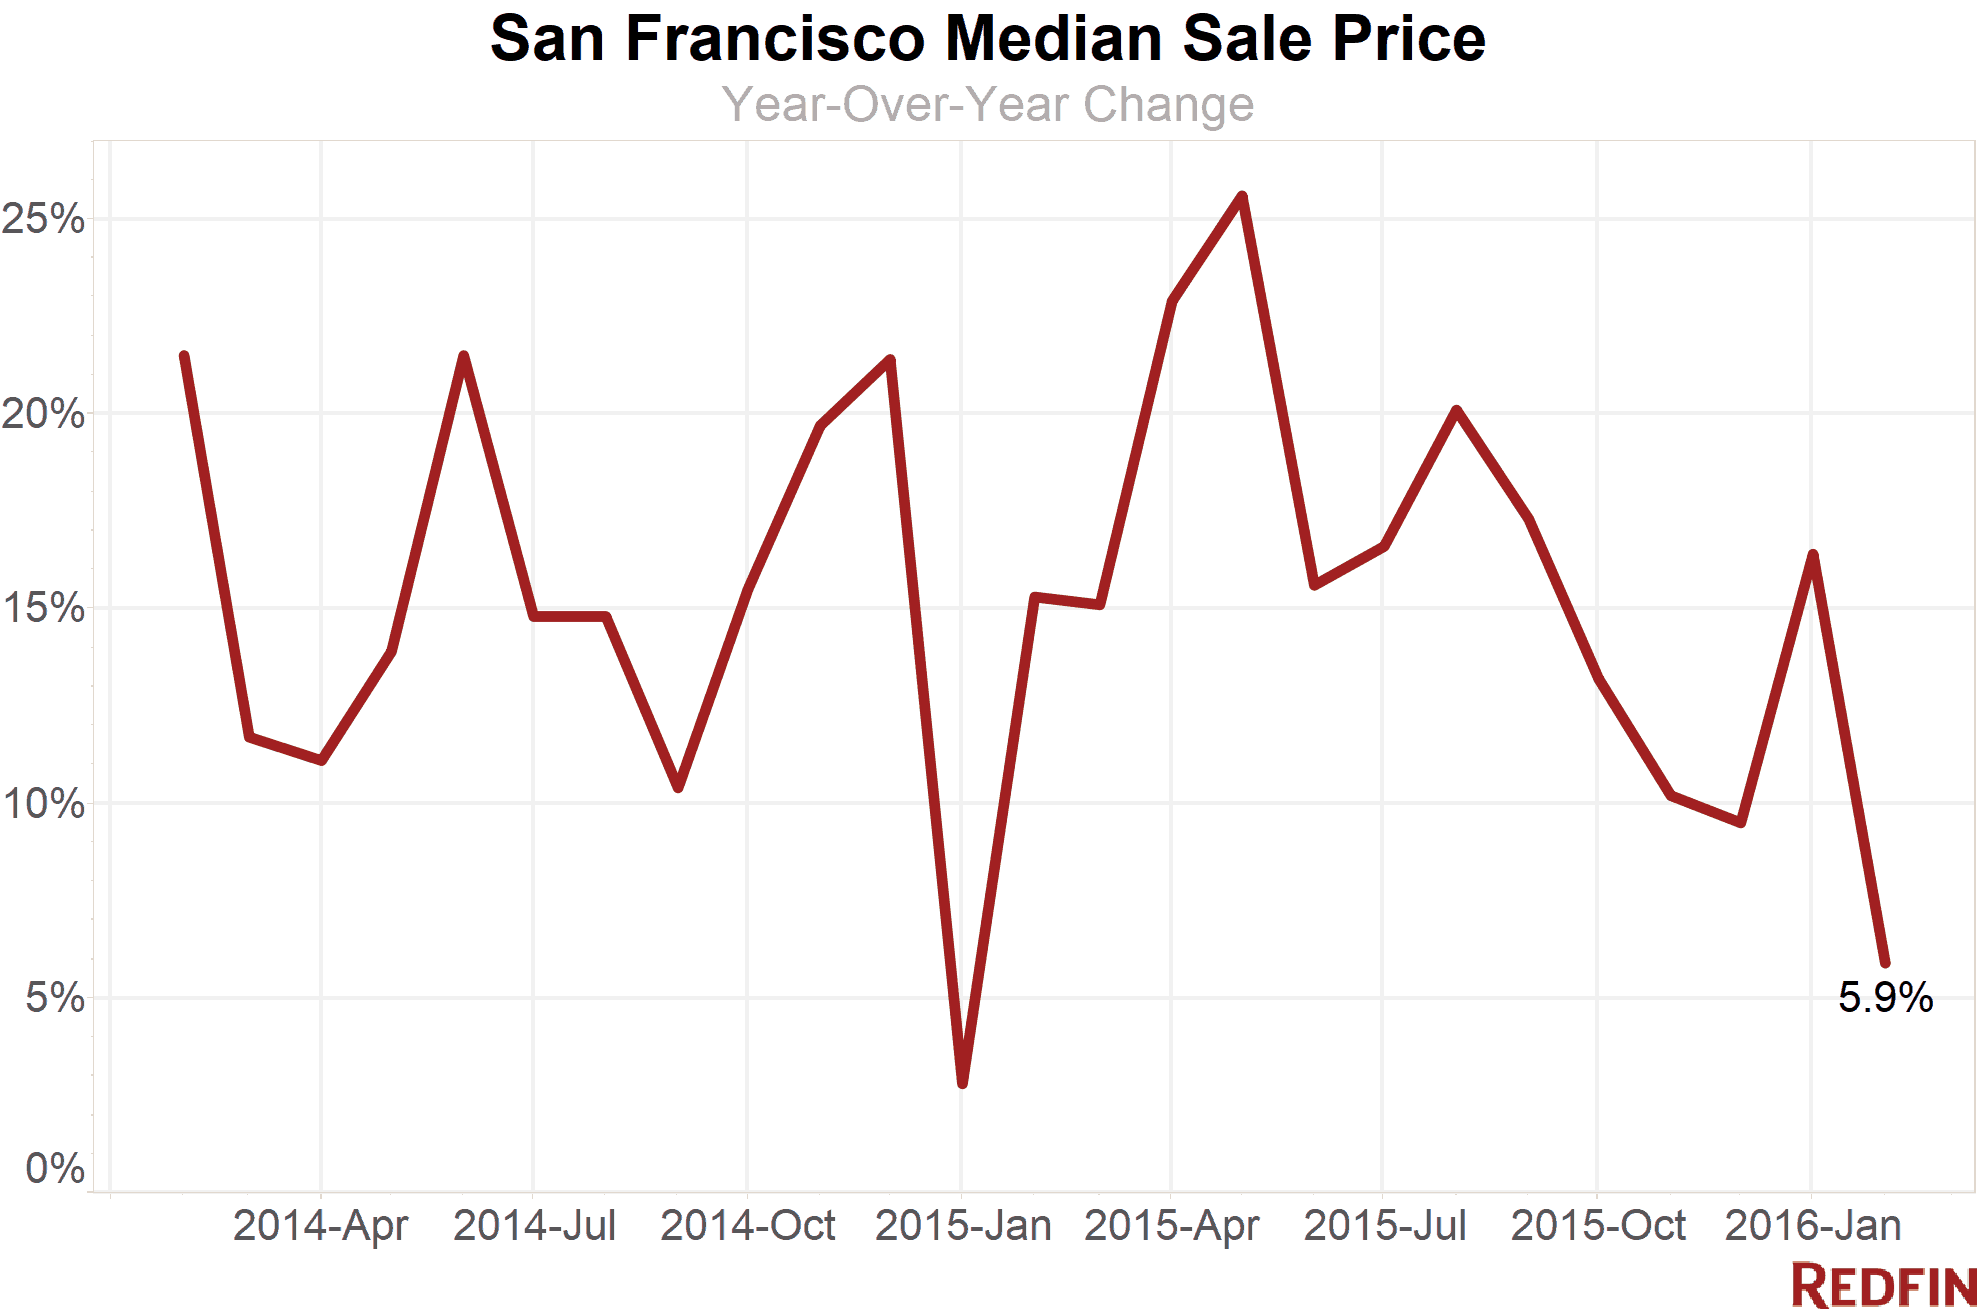
And while prices continue to rise, last month they advanced at the slowest pace in more than a year. About 68 percent of sellers got more than their asking price in February, down from nearly 74 percent a year earlier. The number of competitive offers on a given home is ticking down, Redfin agent Mark Colwell said.
“Increases in inventory are being felt across the market in subtle ways. We’re starting to see price reductions, which is very different from a year ago,” Colwell said. “It used to be that sellers could stretch what the market would handle because buyers were so competitive, but these days that strategy doesn’t work as well.”
Bay Area
Across the greater Bay Area, the median sale price rose 9.6 percent year over year to almost $1.07 million. Sales slumped, down 23.5 percent compared to a year earlier.
Hot Neighborhoods
Pacific Heights reclaimed top billing as the city’s priciest community, with a median sale price of more than $2.06 million, and cash buyers snapped up more than half the homes in the three-month period that ended Feb. 29. Russian Hill fell to second place for cost, with a $2.025 million median sale price.
Mission Bay and Sunnyside, where the typical home sold for almost $1.3 million, had the biggest jump in prices, rising more than 46 percent from a year ago. Lower Haight and Excelsior both had price gains of more than 31 percent.
In some neighborhoods, inventory more than doubled from a year ago. In Potrero Hill, Pacific Heights, Civic Center / Van Ness, and Mission Bay, there were more than twice as many homes for sale as there were a year ago as more sellers put properties on the market.
The Tenderloin continued its streak as the city’s most-affordable neighborhood, with a median sale price of $507,500. Merced Heights, at $622,600, was a distant second.
See our city page for the most up-to-date data on San Francisco home prices.
Here’s what’s happening in your neighborhood:
| Neighborhood | Median Sale Price | Year-Over-Year | Homes Sold | Year-Over-Year | Inventory | Year-Over-Year | New Listings | Median Days on Market | Avg Sale-to-List |
|---|---|---|---|---|---|---|---|---|---|
| Ashbury Heights | $1,272,000 | -10.7% | 8 | -33.3% | 2 | -66.7% | 6 | 20 | 110.6% |
| Bernal Heights | $1,133,000 | -3.9% | 35 | -30.0% | 18 | 5.9% | 41 | 13 | 112.1% |
| Civic Center / Van Ness | $825,000 | 7.1% | 15 | -37.5% | 11 | 120.0% | 35 | 22 | 101.2% |
| Crocker Amazon | $832,500 | 8.8% | 11 | -8.3% | 7 | 40.0% | 12 | 42 | 110.8% |
| Excelsior | $905,100 | 31.2% | 13 | -18.8% | 9 | 28.6% | 19 | 20 | 105.9% |
| Financial District | $731,250 | -64.1% | 4 | -50.0% | 5 | -16.7% | 11 | 17 | 110.7% |
| Forest Hill | $1,762,000 | 18.7% | 5 | -16.7% | 2 | -50.0% | 3 | 24 | 110.9% |
| Haight Ashbury | $1,495,000 | 3.1% | 14 | 100.0% | 1 | -83.3% | 4 | 15 | 104.3% |
| Hayes Valley | $1,540,000 | 17.3% | 6 | 0.0% | 7 | 600.0% | 15 | 37 | 107.3% |
| Ingleside | $1,006,000 | 19.6% | 7 | 40.0% | 5 | 0.0% | 7 | 24 | 110.9% |
| Inner Richmond | $1,466,000 | 5.7% | 15 | -31.8% | 9 | -10.0% | 19 | 22 | 111.7% |
| Inner Sunset | $1,265,000 | 3.3% | 18 | 20.0% | 9 | 12.5% | 17 | 18 | 112.8% |
| Lower Haight | $1,438,750 | 31.4% | 11 | -35.3% | 5 | -37.5% | 12 | 14 | 108.5% |
| Merced Heights | $622,600 | -10.1% | 10 | -41.2% | 3 | -50.0% | 15 | 18 | 110.5% |
| Miraloma Park | $1,308,500 | 5.6% | 22 | -15.4% | 9 | 12.5% | 21 | 14 | 111.1% |
| Mission | $965,000 | 5.2% | 18 | -60.9% | 18 | -35.7% | 37 | 40 | 103.5% |
| Mission Bay | $1,260,000 | 46.5% | 25 | 4.2% | 17 | 112.5% | 35 | 13 | 101.0% |
| Nob Hill | $1,290,000 | -6.2% | 23 | 43.8% | 8 | -46.7% | 20 | 19 | 101.4% |
| Noe Valley | $1,812,500 | 14.0% | 41 | 7.9% | 23 | -8.0% | 52 | 18 | 108.0% |
| Outer Mission | $830,000 | 2.5% | 11 | -26.7% | NA | NA | NA | 12 | 110.3% |
| Outer Richmond | $961,000 | -17.5% | 23 | 76.9% | 16 | 77.8% | 22 | 22 | 107.5% |
| Outer Sunset | $1,075,000 | 21.5% | 33 | 6.5% | 15 | 36.4% | 33 | 19 | 119.2% |
| Pacific Heights | $2,062,500 | 17.0% | 32 | -31.9% | 31 | 121.4% | 48 | 17 | 104.9% |
| Parkside | $1,160,000 | 20.8% | 22 | -15.4% | 14 | 55.6% | 29 | 14 | 122.2% |
| Portola | $854,000 | 17.8% | 13 | -7.1% | 7 | -22.2% | 12 | 26 | 106.3% |
| Potrero Hill | $1,200,000 | -0.8% | 58 | 114.8% | 18 | 125.0% | 59 | 16 | 107.5% |
| Rincon Hill | $1,200,000 | -0.3% | 26 | -16.1% | 20 | 100.0% | 35 | 33 | 99.1% |
| Russian Hill | $2,025,500 | 1.3% | 26 | -3.7% | 6 | -33.3% | 20 | 14 | 104.6% |
| South of Market | $980,000 | -1.5% | 77 | 14.9% | 51 | 50.0% | 95 | 24 | 102.3% |
| Sunnyside | $1,281,000 | 46.4% | 15 | 7.1% | 6 | 20.0% | 18 | 13 | 118.6% |
| Sunset District | $1,200,000 | 20.0% | 111 | 4.7% | 54 | 25.6% | 110 | 17 | 117.7% |
| Telegraph Hill | $955,000 | 28.9% | 10 | -9.1% | 9 | 12.5% | 15 | 18 | 101.9% |
| Tenderloin | $507,500 | 5.7% | 4 | 300.0% | 2 | 100.0% | 7 | 24 | 103.1% |
| Twin Peaks | $1,192,999 | 24.9% | 3 | -57.1% | 2 | -66.7% | 5 | 60 | 104.6% |
| Visitacion Valley | $850,000 | 26.8% | 9 | -50.0% | 4 | -73.3% | 7 | 13 | 109.0% |
| Western Addition | $1,040,000 | 10.8% | 14 | -12.5% | 10 | 42.9% | 16 | 14 | 106.0% |
| San Francisco, CA | $1,200,000 | 5.9% | 272 | -16.6% | 565 | 18.0% | 554 | 14 | 108.3% |
NOTE: Not all neighborhoods are listed, but totals for San Francisco encompass entire city. Data is based on listing information and might not reflect all real estate activity in the market. Neighborhood-specific data is measured over a three-month span that ended Feb. 29. Inventory measures listings active as of Feb. 29.
For more information, contact Redfin journalist services
Phone: 206-588-6863
Email: press@redfin.com
See Redfin’s data center to find out what’s happening in other cities.
To be added to Redfin’s press release distribution list, subscribe here.
 United States
 Canada