| Market Summary | July 2016 | Month-Over-Month | Year-Over-Year |
|---|---|---|---|
| Median sale price | $273,500 | -1.1% | 5.3% |
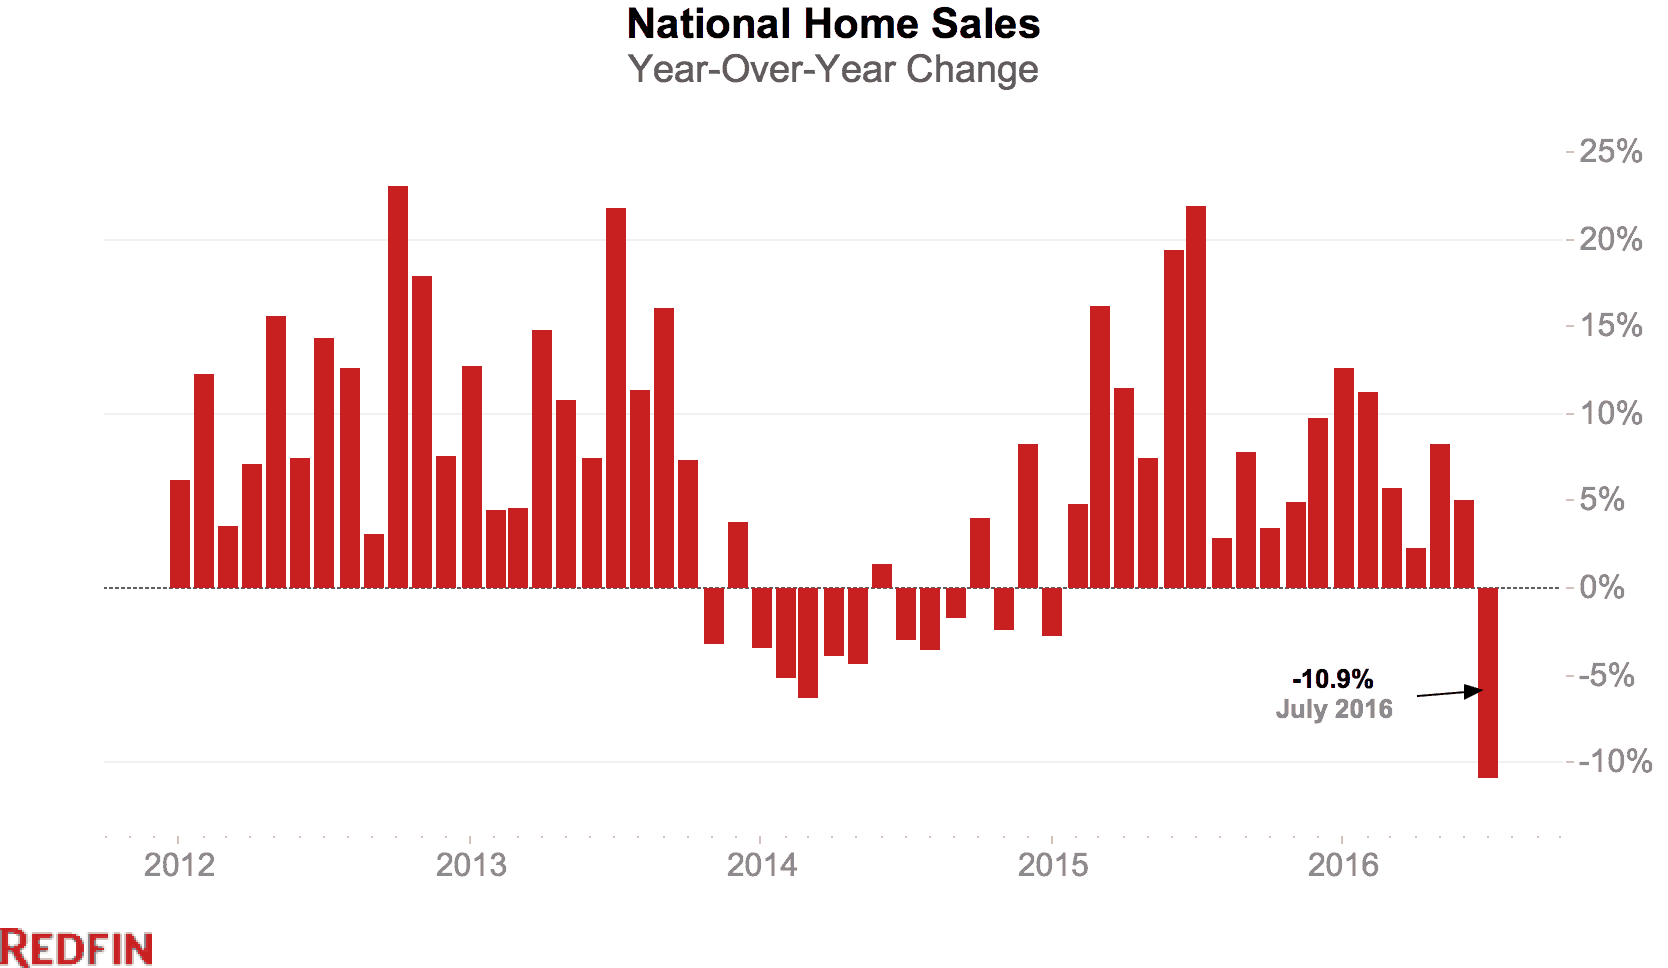
| Homes sold | 269,300 | -12.0% | -10.9% |
| New listings | 310,700 | -9.8% | -6.0% |
| All Homes for sale | 862,900 | 0.1% | -6.6% |
| Median days on market | 42 | 1 | -4 |
| Months of supply | 3.2 | 0.4 | 0.1 |
| Sold above list | 23.3% | -0.4% | 2.2% |
| Average Sale-to-list | 95.3% | -0.2% | 0.3% |
Home sales fell 10.9 percent nationally as the median sale price increased 5.3 percent in July from a year ago. New listings slid by 6 percent, the largest year-over-year decrease in 2016, a year starved of home supply. For the third month in a row, the number of homes available for sale fell by more than 6 percent.
Lack of Business Days Delays Closings
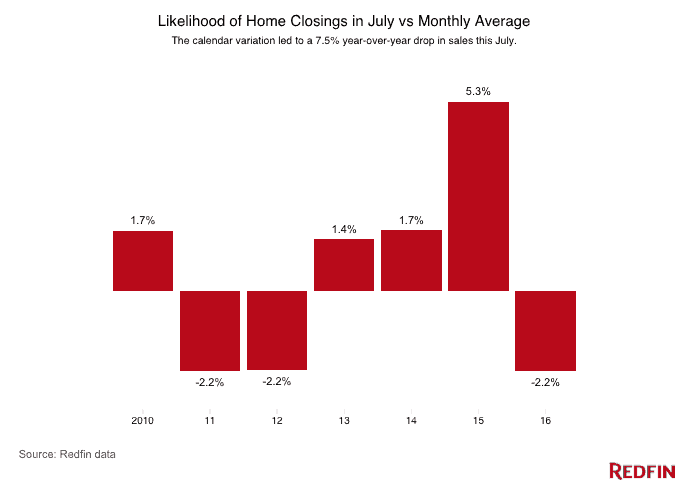
July posted the biggest national sales decline since April 2011, but there’s a good reason not to panic. The slowdown last month has more to do with this year’s calendar than buyer demand. Most of the drop is due to the fact that business days, when people usually close on home sales, were fewer in July. Because the month started on a Friday, there were five full weekends plus one national holiday, leaving only 20 days available for home closings.
To determine just how much of the drop in sales can be attributed to the calendar, Redfin analysts calculated the average frequency at which home sales closed on each day in each month since 2010. Redfin data shows that the lion’s share of closings happen on Fridays. Homes very rarely close on Saturdays or Sundays. This July contained a below-average number of business days (2.3 percent lower than average) while July 2015 had the most favorable day-of-week setup for closings of any month on record (5.3 percent higher than average).
The upshot, according to Pete Ziemkiewicz, Redfin director of analytics, is that “every month is a snowflake with a different number of Fridays and Saturdays and Wednesdays. All else equal, we’d expect the number of homes sold throughout the U.S. to be 7.5 percent lower in July 2016 than it was in July 2015, simply because of the way the days laid out on the calendar.”
Year to Date, Sales Are Up
Not all of last month’s sales decline was due to the calendar. Election anxiety, stock market queasiness and general economic malaise combined with the lack of available homes on the market to drive sales lower as well. Redfin attributes roughly a third of the July sales decline to these slowing market trends.
“While the inventory crunch is showing no signs of loosening, I have noticed that prices have begun to stabilize,” said Redfin real estate agent in Chicago Luis Vasquez. “Recently, I’ve been getting calls from listing agents asking if my clients are still interested in homes they saw several days or weeks ago, letting me know they’ve dropped the price. It’s been about two years since I’ve gotten those kinds of calls. There’s a sense of anxiety among both buyers and sellers, which I think can be attributed to the uncertainty around the upcoming election and to the perceived health of the economy. Some buyers are concerned that home prices are topping out and don’t want to get caught in a market that’s getting ready to tumble back down.”
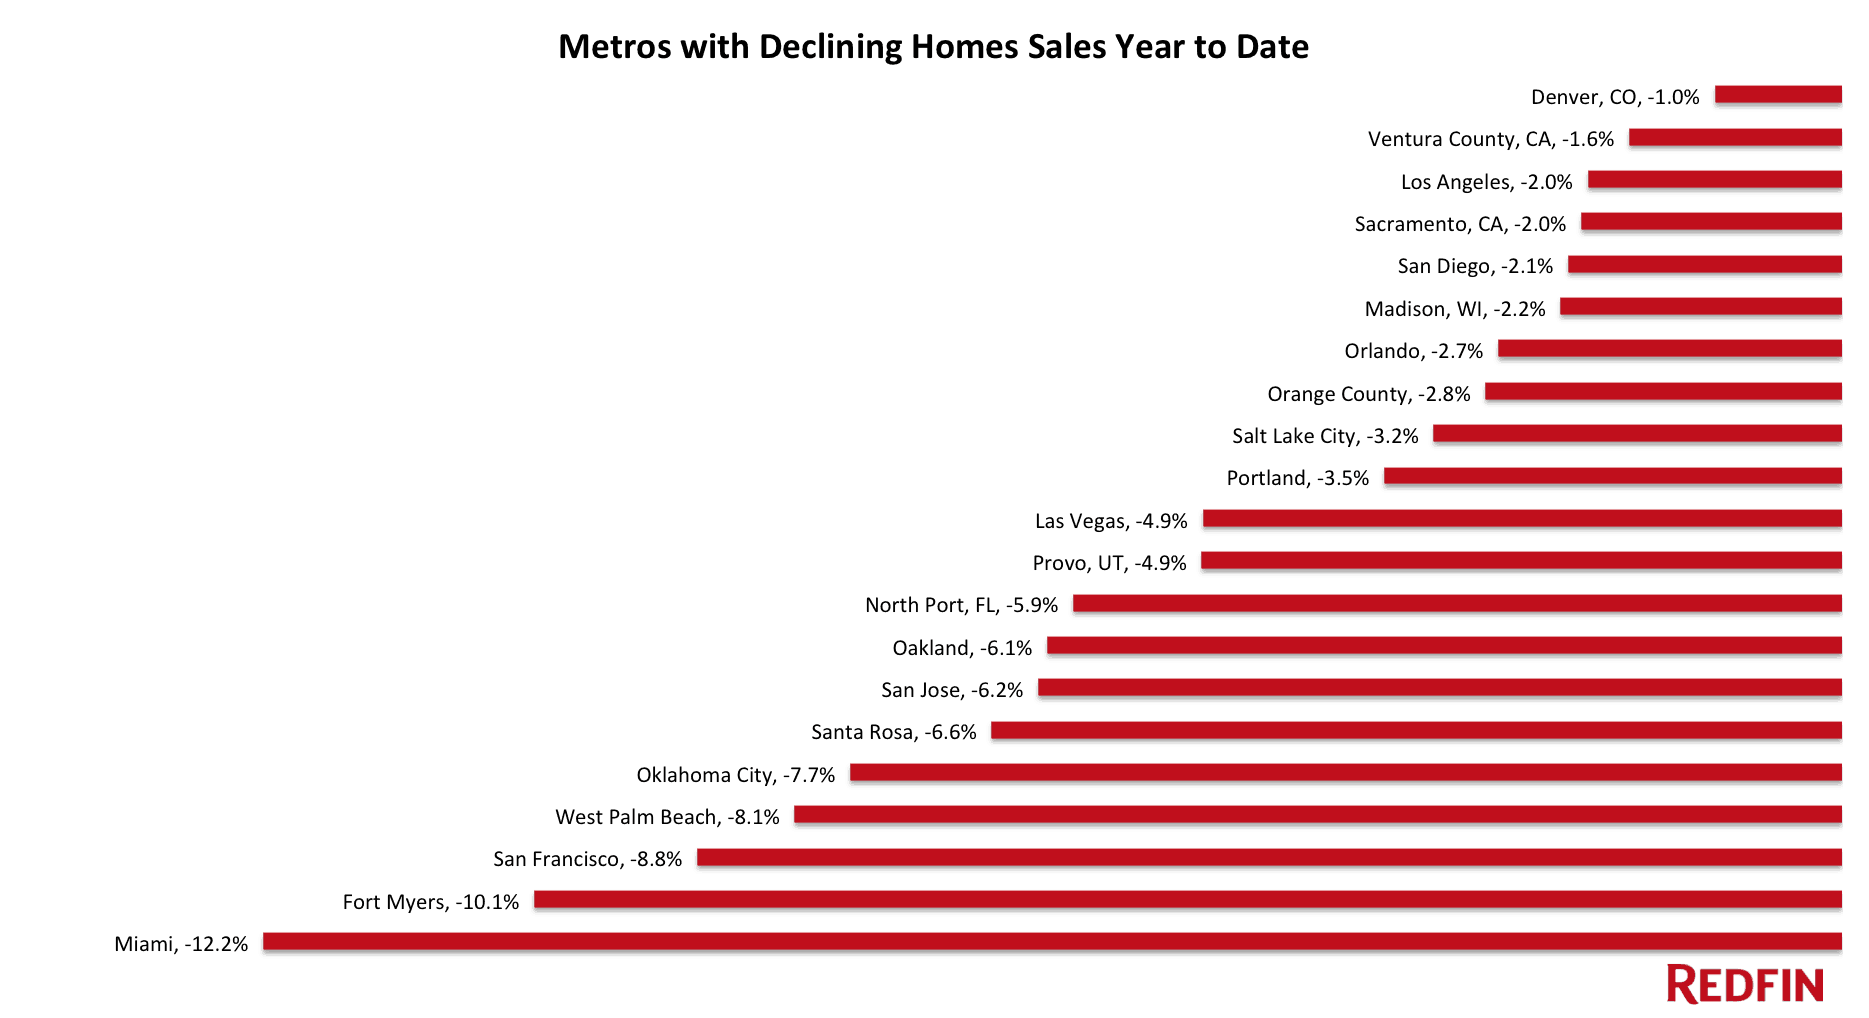
Despite July’s big miss, sales were up 4.8 percent in the first seven months of 2016 compared to the same period last year. Two-thirds of Redfin markets have seen sales increase so far this year. In contrast, a disproportionate number of markets in Florida and California saw sales decline this year compared to last year.
Among East Coast markets, Miami, Fort Myers and West Palm Beach saw the biggest year-to-date declines in sales. To the west, San Francisco led the drops with an 8.8 percent decline so far this year, followed by three other Bay Area markets including Santa Rosa ( -6.6%); San Jose (-6.2%) and Oakland (-6.1%).
Other July Highlights
Prices
- Deltona, FL had the nation’s highest price growth, rising 15.8% since last year to $165,000.
- Only 4 cities saw price declines of more than 1% in July including Washington, DC (-3.8%), Hampton Roads, VA (-2.2%), Albany, NY (-2.2%), and St. Louis, MO (-1.4%).
Sales
- Only 2 metros saw sales surge by double digits from last year. Camden, NJ led the nation in year-over-year sales growth, up 28.5%, followed by St. Louis, MO, up 18.9%. Baltimore, MD rounded out the top three with sales up 6.2% from a year ago.
- Las Vegas, NV saw the largest decline in sales since last year, falling 46.3%. Home sales in Allentown, PA and Pittsburgh, PA declined by 32.0% and 30.0%, respectively.
Competition
- Denver, CO was the fastest market, with half of all homes pending sale in just 8 days, down from 18 days from a year earlier. Seattle, WA and Portland, OR were the next fastest market with 8 and 9 median days on market.
- The most aggressive buyers in San Francisco, CA where 66.2% of homes sold above list price, followed by 65.0% in Oakland, CA and 60.9% in San Jose, CA. In sharp contrast, the sold above list percentage equaled 0.0% in Pittsburgh, PA.
Inventory
- Grand Rapids, MI had the largest decrease in overall inventory, falling 40.4% since last July. Madison, WI (-28.5%), Fresno, CA (-27.3%), and Albany, NY (-26.9%) also continued seeing far fewer homes available on the market than a year ago.
- St. Louis, MO had the highest increase in the number of homes for sale, up 37.2% year over year, followed by San Francisco, CA (35.9%) and San Jose, CA (35.2%).
You can download data from the July Market Tracker in an Excel spreadsheet. The tables that follow feature Redfin’s largest metro regions. For all of our data coverage, visit the Data Center.
For additional local analysis, see: Chicago, Los Angeles, San Francisco and Washington, D.C.
Median Sale Price
| Redfin Metro | Median Sale Price | Month-Over-Month | Year-Over-Year |
|---|---|---|---|
| Atlanta, GA | $212,000 | 0.5% | 6.1% |
| Baltimore, MD | $268,500 | -0.9% | 5.3% |
| Boston, MA | $395,500 | 0.5% | 4.1% |
| Chicago, IL | $240,000 | 0.8% | 5.7% |
| Cleveland, OH | $141,000 | -2.8% | 5.2% |
| Dallas-Fort Worth, TX | $235,000 | -5.1% | 7.3% |
| Denver, CO | $350,600 | -1.8% | 11.3% |
| Detroit, MI | $168,000 | 0.0% | 1.9% |
| Edison, NJ | $290,000 | -5.5% | 0.0% |
| Houston, TX | $229,000 | -0.4% | 5.2% |
| Kansas City, MO | $189,900 | -0.1% | 5.5% |
| Las Vegas, NV | $215,000 | 0.7% | 7.5% |
| Long Island, NY | $415,000 | 3.8% | 6.4% |
| Los Angeles, CA | $540,000 | -0.6% | 6.9% |
| Miami, FL | $265,000 | 3.3% | 11.3% |
| Minneapolis-St. Paul, MN | $241,000 | 0.5% | 5.4% |
| Oakland, CA | $649,900 | -0.8% | 8.3% |
| Orange County, CA | $624,000 | -2.5% | 2.8% |
| Orlando, FL | $208,200 | -0.8% | 13.7% |
| Philadelphia, PA | $250,000 | -1.0% | 0.4% |
| Phoenix, AZ | $225,000 | -3.0% | 5.6% |
| Pittsburgh, PA | $158,900 | -0.7% | 2.5% |
| Portland, OR | $340,000 | -2.0% | 10.7% |
| Riverside-San Bernardino, CA | $320,000 | 1.1% | 6.7% |
| Sacramento, CA | $344,000 | -1.7% | 8.5% |
| San Antonio, TX | $202,000 | -1.6% | 3.1% |
| San Diego, CA | $500,000 | 0.2% | 5.0% |
| Seattle, WA | $450,000 | -2.4% | 9.8% |
| St. Louis, MO | $170,000 | -5.6% | -1.4% |
| Tampa, FL | $193,000 | 1.6% | 13.2% |
| Washington, DC | $375,000 | -1.1% | -3.8% |
| National | $273,500 | -1.1% | 5.3% |
All Homes for Sale
| Redfin Metro | All Homes for Sale | Month-Over-Month | Year-Over-Year |
|---|---|---|---|
| Atlanta, GA | 35,642 | 6.6% | -0.4% |
| Baltimore, MD | 12,487 | -3.4% | -15.2% |
| Boston, MA | 13,521 | -4.5% | -24.1% |
| Chicago, IL | 49,623 | -2.3% | -9.7% |
| Cleveland, OH | 10,460 | -1.4% | -17.0% |
| Dallas-Fort Worth, TX | 16,970 | -5.3% | -16.4% |
| Denver, CO | 7,674 | 5.6% | -18.1% |
| Detroit, MI | 15,473 | 1.9% | -22.2% |
| Edison, NJ | 18,419 | 7.1% | 3.5% |
| Houston, TX | 25,013 | -0.6% | 10.0% |
| Las Vegas, NV | 13,443 | -2.7% | -6.8% |
| Long Island, NY | 13,345 | -1.4% | -18.0% |
| Los Angeles, CA | 18,378 | 7.1% | 7.3% |
| Miami, FL | 17,990 | -1.8% | 5.6% |
| Minneapolis-St. Paul, MN | 14,258 | 0.6% | -14.0% |
| Oakland, CA | 3,988 | 8.8% | 2.8% |
| Orange County, CA | 9,062 | 3.8% | 11.2% |
| Orlando, FL | 11,148 | -4.6% | -18.3% |
| Philadelphia, PA | 18,131 | 2.2% | -13.4% |
| Phoenix, AZ | 21,101 | -7.2% | -0.4% |
| Portland, OR | 6,649 | 8.5% | -13.2% |
| Riverside-San Bernardino, CA | 17,085 | 2.6% | 6.4% |
| Sacramento, CA | 6,336 | 2.8% | -15.7% |
| San Antonio, TX | 7,443 | -4.2% | -8.9% |
| San Diego, CA | 7,158 | -1.3% | -12.5% |
| Seattle, WA | 6,254 | 6.3% | -13.9% |
| St. Louis, MO | 16,001 | 7.4% | 37.2% |
| Tampa, FL | 15,148 | -4.2% | -12.0% |
| Washington, DC | 19,400 | -5.3% | -20.2% |
| National | 862,900 | 0.1% | -6.6% |
New Listings
| Redfin Metro | New Listings | Month-Over-Month | Year-Over-Year |
|---|---|---|---|
| Atlanta, GA | 10,768 | -16.6% | -10.5% |
| Baltimore, MD | 4,413 | -15.7% | -6.2% |
| Boston, MA | 6,692 | -25.2% | -12.6% |
| Chicago, IL | 13,623 | -14.3% | -11.4% |
| Cleveland, OH | 3,229 | -6.1% | -8.2% |
| Dallas-Fort Worth, TX | 10,642 | -3.0% | -12.1% |
| Denver, CO | 6,295 | -11.2% | -10.2% |
| Detroit, MI | 7,263 | -12.7% | -13.3% |
| Edison, NJ | 3,890 | -10.5% | -2.6% |
| Houston, TX | 10,000 | -4.4% | -6.3% |
| Kansas City, MO | 3,728 | -9.3% | 13.4% |
| Las Vegas, NV | 4,107 | -3.4% | -4.2% |
| Long Island, NY | 3,151 | -13.8% | -10.6% |
| Los Angeles, CA | 9,707 | 0.0% | 5.4% |
| Miami, FL | 3,997 | -9.2% | -7.2% |
| Minneapolis-St. Paul, MN | 6,585 | -15.7% | -4.0% |
| Oakland, CA | 3,324 | -3.7% | -5.3% |
| Orange County, CA | 4,069 | -3.3% | 9.7% |
| Orlando, FL | 4,174 | -7.1% | -8.6% |
| Philadelphia, PA | 4,726 | -20.4% | -15.1% |
| Phoenix, AZ | 7,983 | -9.5% | -4.3% |
| Pittsburgh, PA | 2,373 | -5.6% | -5.5% |
| Portland, OR | 5,030 | -3.3% | -1.3% |
| Riverside-San Bernardino, CA | 7,134 | 1.4% | 11.4% |
| Sacramento, CA | 3,832 | -4.1% | -3.9% |
| San Antonio, TX | 3,107 | -2.4% | -9.8% |
| San Diego, CA | 3,962 | -10.4% | -8.5% |
| Seattle, WA | 5,755 | -7.7% | 7.6% |
| St. Louis, MO | 4,509 | -14.5% | 20.7% |
| Tampa, FL | 5,609 | -5.3% | -0.8% |
| Washington, DC | 8,592 | -14.1% | -11.7% |
| National | 310,700 | -9.8% | -6.0% |
Homes Sold
| Redfin Metro | Homes Sold | Month-Over-Month | Year-Over-Year |
|---|---|---|---|
| Atlanta, GA | 11,090 | -5.2% | -12.9% |
| Baltimore, MD | 3,750 | -41.0% | 6.2% |
| Boston, MA | 6,885 | -16.0% | -17.6% |
| Chicago, IL | 13,402 | -15.5% | -3.5% |
| Cleveland, OH | 2,627 | -14.0% | -8.8% |
| Dallas-Fort Worth, TX | 8,289 | -9.4% | -13.3% |
| Denver, CO | 5,962 | 3.5% | -11.3% |
| Detroit, MI | 6,070 | -20.8% | -13.4% |
| Edison, NJ | 3,217 | -11.5% | -7.2% |
| Houston, TX | 7,243 | -10.4% | -10.6% |
| Kansas City, MO | 3,307 | -16.3% | -1.9% |
| Las Vegas, NV | 1,947 | -37.1% | -46.3% |
| Long Island, NY | 2,776 | -22.8% | -1.1% |
| Los Angeles, CA | 6,812 | -8.8% | -11.3% |
| Miami, FL | 2,764 | -7.5% | -24.2% |
| Minneapolis-St. Paul, MN | 7,456 | -7.7% | -4.7% |
| Oakland, CA | 2,449 | -16.8% | -19.8% |
| Orange County, CA | 2,797 | -11.5% | -14.0% |
| Orlando, FL | 4,140 | -14.2% | -16.1% |
| Philadelphia, PA | 4,633 | -18.9% | -28.0% |
| Phoenix, AZ | 7,685 | -13.7% | -4.0% |
| Pittsburgh, PA | 2,108 | -15.5% | -30.0% |
| Portland, OR | 3,550 | -13.9% | -21.8% |
| Riverside-San Bernardino, CA | 4,900 | -12.7% | -9.6% |
| Sacramento, CA | 2,938 | -11.4% | -10.9% |
| San Antonio, TX | 2,503 | -9.8% | -10.1% |
| San Diego, CA | 3,352 | -11.2% | -12.5% |
| Seattle, WA | 4,992 | -8.1% | -4.7% |
| St. Louis, MO | 3,924 | -3.0% | 18.9% |
| Tampa, FL | 6,222 | 6.2% | -2.7% |
| Washington, DC | 8,130 | -17.8% | -6.3% |
| National | 269,300 | -12.0% | -10.9% |
Other popular posts:
1. Your Guide to Bringing Home a Rescue Pet
2. How to Secure a New Home After an Abusive Relationship
3. Tips for Safe Holiday Home Decorating
 United States
 Canada