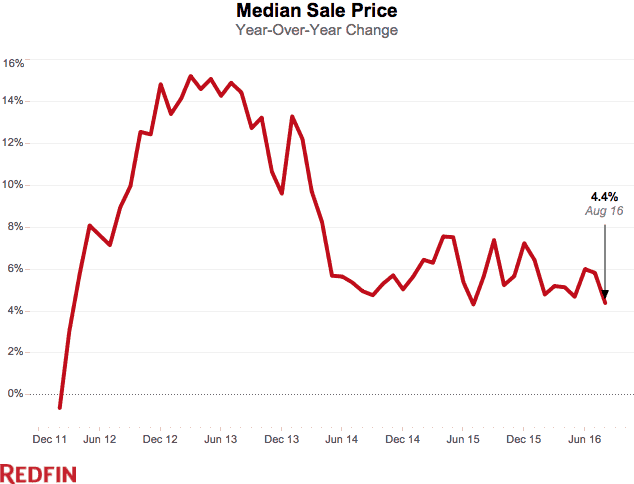
Despite strong sales and shrinking inventory, home prices rose at the slowest pace of the year, up just 4.4 percent from last year. The average home sold for 93.8 percent of its list price, down from 94.4 percent last year, signaling that buyers’ bargaining position increased in August.
| Market Summary | August 2016 | Month-Over-Month | Year-Over-Year |
|---|---|---|---|
| Median sale price | $271,900 | -1.1% | 4.4% |
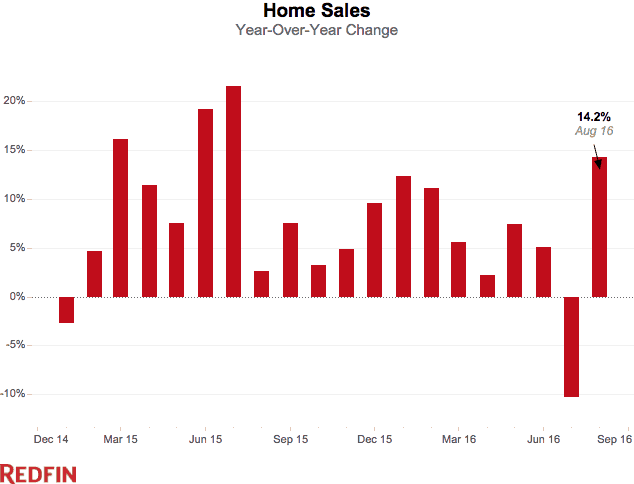
| Homes sold | 283,300 | 4.4% | 14.2% |
| New listings | 302,800 | -3.2% | 2.4% |
| All Homes for sale | 838,100 | -3.6% | -8.0% |
| Median days on market | 44 | 2 | -4 |
| Months of supply | 3 | -0.2 | -0.7 |
| Sold above list | 22.0% | -1.4% | 2.3% |
| Average Sale-to-list | 93.8% | -1.4% | -0.6% |
Home sales increased 14.2 percent in August from a year ago, a sizeable rebound from July’s decline. The surge was widespread, with 48 of 91 metro areas reporting double-digit increases in sales.
The boost was due in part to a calendar aberration in July that pushed out some closings into August. In addition, August 2015, when sales slid 18 percent from the previous month and grew by just 2.6 percent year over year, was the low point in an otherwise strong year for housing.
Overall home inventory continued to decline for the 11th month with an 8 percent year-over-year drop, the widest margin of 2016. After taking a step back from the market in July, sellers were active in August. New listings were up 2.4 percent, the biggest increase in five months.
The Upshot
The number of homes sold in the first eight months of the year, when the bulk of housing activity takes place, was 6 percent higher than the same period last year, affirming that 2016 is the best year in housing since the downturn. There would have been even more sales if inventory had been able to keep pace with ferocious buyer demand.
Yet slowing price growth also indicates that the market has shifted toward buyers’ favor heading into the fall, according to Adrian Smith, a Redfin real estate agent in Atlanta.
“Back in March, when the 2016 market really peaked, buyers were serious about moving quickly and willing to pay over list price,” said Smith. “Some sellers who waited until summer to list after watching the hot spring market, became too big for their britches.They expected top dollar, cash buyers, bidding wars and were willing to wait for the strongest offer. But late-summer buyers were even more patient and less willing to settle. There’s a big pool of buyers in the market now, but most are able and willing to wait for the right home at the right price.”
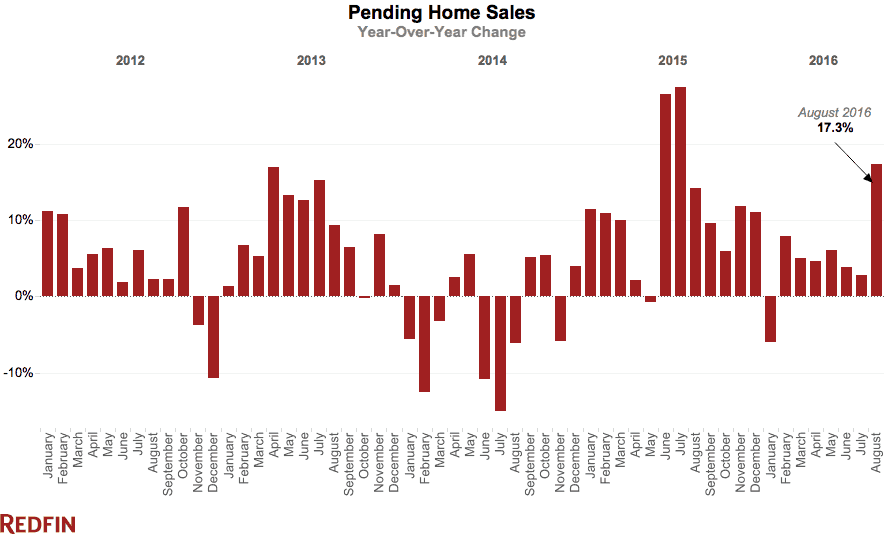
There is still enough steam from that demand for a healthy pace of sales to continue in September. Pending home sales, a forward looking indicator of sales, were up 17.3 percent year over year and up 6.4 percent month over month in August. The upshot is that the market is hitting a sweet spot in the third quarter in which there is both high buyer demand for homeowners looking to sell and cooling prices for buyers ready to purchase.
Other August Highlights
Prices
- Deltona, FL had the nation’s highest price growth, rising 21.9% since last year to $170,000.
- 9 cities saw price declines of more than 1% in August. Hudson Valley, NY declined the most since last year falling -7.4 percent to $451,250.
Sales
- 49.5% of metros saw sales surge by double digits from last year. Columbia, SC led the nation in year-over-year sales growth, up 80.4%, followed by Detroit, MI, up 67.3%. Poughkeepsie, NY rounded out the top three with sales up 64.5% from a year ago.
- Baton Rouge, LA saw the largest decline in sales since last year, falling 7.5%. Home sales in Pittsburgh, PA and North Port, FL declined by 5.6% and 3.6%, respectively.
Competition
- Seattle, WA was the fastest market, with half of all homes pending sale in just 10 days, down from 14 days from a year earlier. Denver, CO and Portland, OR were the next fastest market with 11 and 13 median days on market.
- Competitive homes were in Oakland, CA where 61.8% of homes sold above list price, followed by 60.0% in San Francisco, CA and 58.4% in San Jose, CA. In sharp contrast, the sold above list percentage equaled 0.0% in Pittsburgh, PA, and Kansas City, MO.
Inventory
- Madison, WI had the largest decrease in overall inventory, falling 42.9% since last August. Rochester, NY (-35.9%), Buffalo, NY (-31.3%), and Fresno, CA (-30.1%) also continued seeing far fewer homes available on the market than a year ago.
- St. Louis, MO had the highest increase in the number of homes for sale, up 33.1% year over year, followed by Provo, UT (29.0%) and San Francisco, CA (27.5%).
For additional local analysis, see: Chicago, Los Angeles, San Francisco and Washington, D.C.
Median Sale Price
| Redfin Metro | Median Sale Price | Month-Over-Month | Year-Over-Year |
|---|---|---|---|
| Atlanta, GA | $205,000 | -4.7% | 7.9% |
| Baltimore, MD | $257,900 | -5.4% | -2.7% |
| Boston, MA | $390,000 | -1.3% | 3.4% |
| Chicago, IL | $234,000 | -1.5% | 4.5% |
| Cleveland, OH | $137,000 | -2.6% | 5.4% |
| Dallas-Fort Worth, TX | $235,000 | 0.0% | 9.3% |
| Denver, CO | $346,000 | -2.3% | 11.1% |
| Detroit, MI | $163,000 | -4.1% | 0.5% |
| Edison, NJ | $290,000 | -3.0% | -2.2% |
| Houston, TX | $225,000 | -1.9% | 4.7% |
| Kansas City, MO | $186,900 | -1.6% | 4.7% |
| Las Vegas, NV | $215,000 | 0.0% | 7.5% |
| Long Island, NY | $416,000 | 0.2% | -1.9% |
| Los Angeles, CA | $540,000 | 0.0% | 5.9% |
| Miami, FL | $257,500 | -2.1% | 8.2% |
| Minneapolis-St. Paul, MN | $241,000 | 1.0% | 6.4% |
| Oakland, CA | $620,500 | -3.9% | 3.4% |
| Orange County, CA | $636,500 | 1.9% | 5.2% |
| Orlando, FL | $208,000 | 0.5% | 15.6% |
| Philadelphia, PA | $245,000 | -2.0% | 2.5% |
| Phoenix, AZ | $230,000 | 2.2% | 9.5% |
| Pittsburgh, PA | $150,000 | -5.1% | 0.0% |
| Portland, OR | $345,000 | 1.5% | 11.9% |
| Riverside-San Bernardino, CA | $320,000 | 0.0% | 6.7% |
| Sacramento, CA | $348,000 | 0.9% | 10.5% |
| San Antonio, TX | $203,000 | 0.5% | 4.3% |
| San Diego, CA | $500,000 | 0.2% | 6.4% |
| Seattle, WA | $450,000 | 0.0% | 9.0% |
| St. Louis, MO | $169,400 | -1.8% | 0.8% |
| Tampa, FL | $194,000 | 0.8% | 17.6% |
| Washington, DC | $380,000 | 0.7% | -0.7% |
| National | $271,900 | -1.1% | 4.4% |
All Homes for Sale
| Redfin Metro | All Homes for Sale | Month-Over-Month | Year-Over-Year |
|---|---|---|---|
| Atlanta, GA | 34,119 | 2.2% | -2.8% |
| Baltimore, MD | 12,213 | -5.2% | -16.5% |
| Boston, MA | 13,077 | -7.2% | -25.5% |
| Chicago, IL | 48,082 | -5.9% | -10.3% |
| Cleveland, OH | 10,232 | -4.9% | -17.6% |
| Dallas-Fort Worth, TX | 16,589 | -13.4% | -16.6% |
| Denver, CO | 7,715 | -3.1% | -19.7% |
| Detroit, MI | 15,488 | -2.9% | -23.2% |
| Edison, NJ | 15,292 | -9.2% | -11.4% |
| Houston, TX | 24,764 | -4.0% | 7.5% |
| Las Vegas, NV | 13,350 | -2.1% | -6.6% |
| Long Island, NY | 12,655 | -6.4% | -20.5% |
| Los Angeles, CA | 18,198 | 0.1% | 6.0% |
| Miami, FL | 17,863 | -1.5% | 4.8% |
| Minneapolis-St. Paul, MN | 13,728 | -5.2% | -14.9% |
| Oakland, CA | 3,768 | -7.7% | -3.9% |
| Orange County, CA | 8,771 | -2.3% | 8.5% |
| Orlando, FL | 10,934 | -6.9% | -18.2% |
| Philadelphia, PA | 16,461 | -8.2% | -19.2% |
| Phoenix, AZ | 20,641 | -6.0% | -1.5% |
| Portland, OR | 7,227 | 2.7% | -6.3% |
| Riverside-San Bernardino, CA | 16,886 | 1.3% | 6.2% |
| Sacramento, CA | 6,435 | -4.3% | -11.5% |
| San Antonio, TX | 7,319 | -10.1% | -8.4% |
| San Diego, CA | 7,053 | -5.7% | -12.0% |
| Seattle, WA | 6,347 | -3.0% | -13.1% |
| St. Louis, MO | 15,449 | 5.2% | 33.1% |
| Tampa, FL | 14,975 | -4.9% | -9.8% |
| Washington, DC | 18,694 | -8.0% | -21.5% |
| National | 838,100 | -3.6% | -8.0% |
New Listings
| Redfin Metro | New Listings | Month-Over-Month | Year-Over-Year |
|---|---|---|---|
| Atlanta, GA | 10,383 | -4.3% | 2.8% |
| Baltimore, MD | 4,160 | -6.0% | -1.0% |
| Boston, MA | 6,469 | -4.7% | -5.9% |
| Chicago, IL | 13,165 | -8.4% | -3.2% |
| Cleveland, OH | 2,976 | -8.5% | -2.9% |
| Dallas-Fort Worth, TX | 9,536 | -10.7% | -3.3% |
| Denver, CO | 5,998 | -5.3% | 0.3% |
| Detroit, MI | 7,331 | 0.7% | -5.8% |
| Edison, NJ | 3,637 | -6.7% | 1.1% |
| Houston, TX | 8,914 | -11.3% | -0.8% |
| Kansas City, MO | 3,446 | -8.1% | 20.3% |
| Las Vegas, NV | 4,189 | 1.5% | 4.3% |
| Long Island, NY | 2,923 | -9.4% | -6.6% |
| Los Angeles, CA | 9,548 | 3.1% | 12.5% |
| Miami, FL | 4,266 | 9.9% | -2.0% |
| Minneapolis-St. Paul, MN | 6,156 | -6.7% | 5.2% |
| Oakland, CA | 2,878 | -13.6% | -5.9% |
| Orange County, CA | 3,756 | -3.2% | 11.5% |
| Orlando, FL | 4,282 | 2.2% | -0.3% |
| Philadelphia, PA | 4,704 | -1.5% | -6.0% |
| Phoenix, AZ | 8,267 | 2.9% | 4.2% |
| Pittsburgh, PA | 2,372 | -0.1% | -3.3% |
| Portland, OR | 4,817 | -6.0% | 6.8% |
| Riverside-San Bernardino, CA | 7,366 | 8.8% | 24.1% |
| Sacramento, CA | 3,637 | -8.0% | 7.0% |
| San Antonio, TX | 2,831 | -9.3% | 4.0% |
| San Diego, CA | 3,911 | -3.3% | 5.0% |
| Seattle, WA | 5,282 | -8.3% | 9.5% |
| St. Louis, MO | 4,409 | -2.3% | 28.3% |
| Tampa, FL | 5,782 | 2.7% | 7.6% |
| Washington, DC | 7,987 | -10.2% | -4.0% |
| National | 302,800 | -3.2% | 2.4% |
Homes Sold
| Redfin Metro | Homes Sold | Month-Over-Month | Year-Over-Year |
|---|---|---|---|
| Atlanta, GA | 10,964 | 2.0% | 29.4% |
| Baltimore, MD | 3,892 | -8.6% | 20.2% |
| Boston, MA | 7,483 | 5.0% | 3.0% |
| Chicago, IL | 13,943 | -5.7% | 25.5% |
| Cleveland, OH | 2,677 | 0.6% | 3.7% |
| Dallas-Fort Worth, TX | 8,951 | 5.3% | -1.2% |
| Denver, CO | 6,097 | 13.6% | 7.5% |
| Detroit, MI | 6,977 | 12.8% | 67.3% |
| Edison, NJ | 3,553 | 16.3% | 25.6% |
| Houston, TX | 8,086 | 10.3% | 7.6% |
| Kansas City, MO | 3,347 | 0.1% | 15.3% |
| Las Vegas, NV | 3,656 | 81.0% | 9.9% |
| Long Island, NY | 3,209 | 0.2% | 51.5% |
| Los Angeles, CA | 6,955 | 2.3% | 4.2% |
| Miami, FL | 2,807 | 4.2% | 14.8% |
| Minneapolis-St. Paul, MN | 8,022 | 15.7% | 40.4% |
| Oakland, CA | 2,707 | 2.6% | 7.2% |
| Orange County, CA | 2,948 | 5.0% | 10.0% |
| Orlando, FL | 4,175 | -1.8% | 37.6% |
| Philadelphia, PA | 4,790 | 1.9% | 0.4% |
| Phoenix, AZ | 7,932 | 3.6% | 16.8% |
| Pittsburgh, PA | 2,123 | -0.9% | -5.6% |
| Portland, OR | 3,946 | 6.7% | -2.0% |
| Riverside-San Bernardino, CA | 5,072 | 1.2% | 11.3% |
| Sacramento, CA | 3,181 | 5.5% | 5.7% |
| San Antonio, TX | 2,583 | 0.4% | 5.0% |
| San Diego, CA | 3,516 | 3.9% | 6.2% |
| Seattle, WA | 5,221 | 4.4% | 12.3% |
| St. Louis, MO | 4,119 | -5.1% | 40.1% |
| Tampa, FL | 6,209 | 17.2% | 32.3% |
| Washington, DC | 8,482 | -5.4% | 24.4% |
| National | 283,300 | 4.4% | 14.2% |
 United States
 Canada