October 25, 2019 by
Tim EllisUpdated on October 6th, 2020
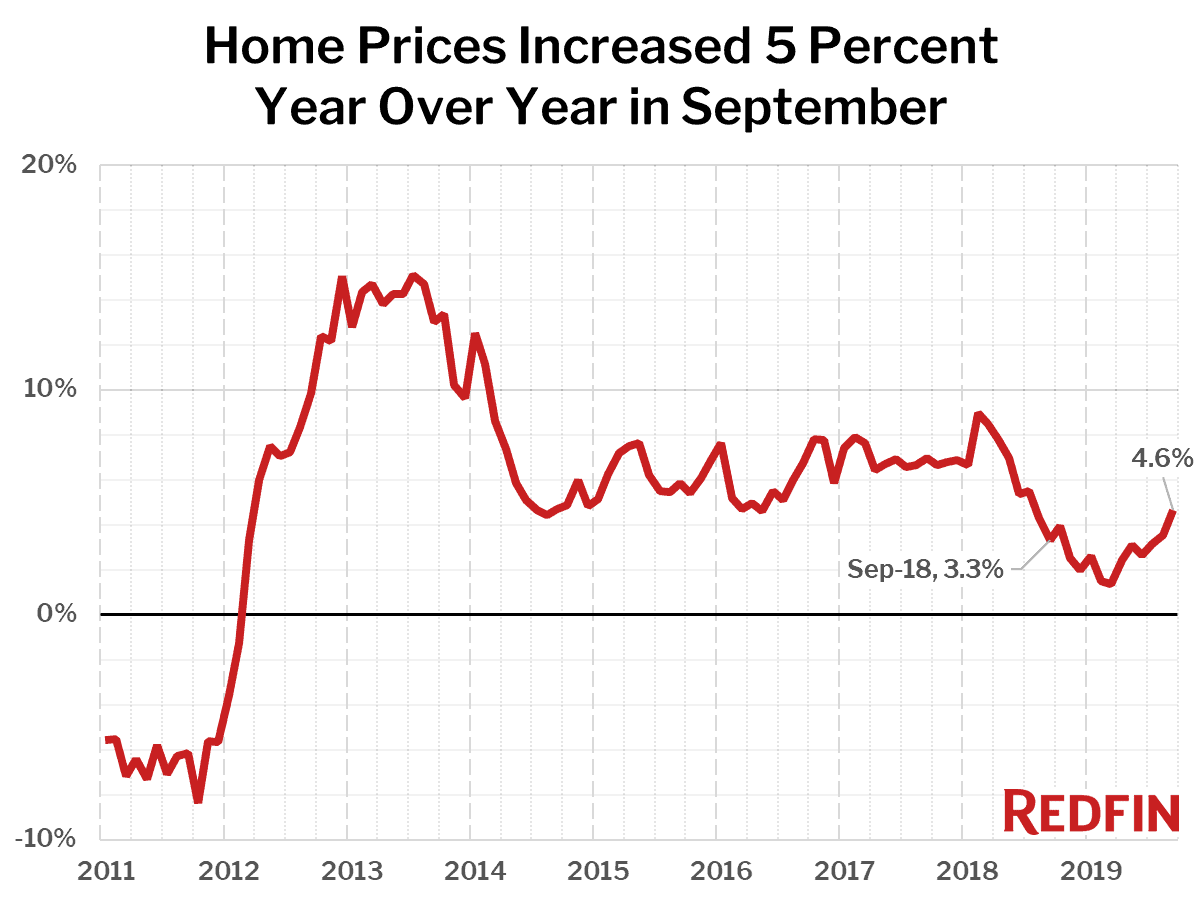
Home prices up 5% annually, the biggest increase in over a year.
U.S. home-sale prices increased 4.6 percent year over year in September to a median of $308,800 across the 217 metros Redfin tracks. This is the largest year-over-year increase since July 2018.
“The demand-driving effect of low mortgage rates is being cancelled out by jitters about the overall health of the economy and mounting affordability pressures in places where people are used to homes being relatively affordable,” said Redfin chief economist Daryl Fairweather. “Still, sales have been just strong enough in recent months to take a bite into the inventory that had been piling up earlier this year. While prices are rising, the market doesn’t feel ‘hot,’ but it’s likely to heat up in 2020 if the economy stays on course.”
The strong nationwide home-price increase was driven by relatively affordable markets. The 10 metro areas with the biggest gains all had median sale prices below the national median, led by Knoxville, TN (median price $218,000, up 16.0%), Dayton, OH ($154,450, +13.3%) and Detroit, MI ($145,000, +11.6%).
Just six of the 85 largest metro areas Redfin tracks saw a year-over-year decline in their median sale price. All six were expensive West Coast markets. In San Francisco, CA home prices fell 4.6 percent from a year earlier. San Jose, CA (-2.6%), Seattle, WA (-1.2%), Anaheim, CA (-1.0%), San Diego, CA (-0.9%) and Oxnard, CA (-0.8%) rounded out the list of metro areas with price drops.
| Market Summary |
September 2019 |
Month-Over-Month |
Year-Over-Year |
| Median sale price |
$308,800 |
-1.5% |
4.6% |
| Homes sold, seasonally-adjusted |
267,300 |
-0.5% |
1.3% |
| New listings, seasonally-adjusted |
315,500 |
-0.1% |
-3.6% |
| All Homes for sale |
842,800 |
-2.0% |
-7.7% |
| Median days on market |
42 |
2 |
2 |
| Months of supply |
3.1 |
0.4 |
-0.5 |
| Sold above list |
21.9% |
-1.3 pts† |
-0.8 pts† |
| Median Off-Market Redfin Estimate |
$315,900 |
4.0% |
6.2% |
| Average Sale-to-list |
97.8% |
-0.4 pts† |
-0.2 pts† |
† – “pts” = percentage point change
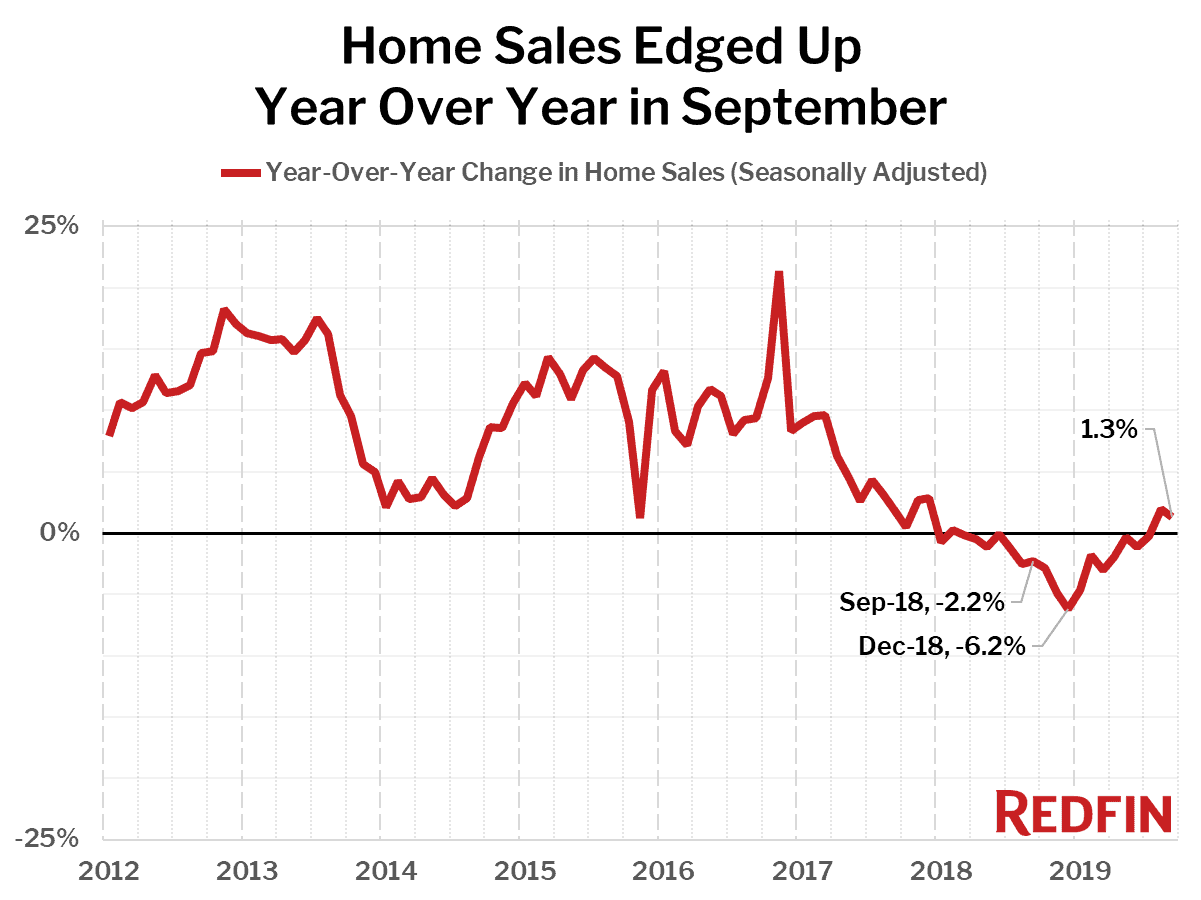
Home sales edged up 1.3 percent year over year in September, the second consecutive month of increases, but were down half a percent from August on a seasonally-adjusted basis. The latest small move in sales on both a month-over-month and year-over-year basis suggests that there’s no big surge in homebuyer demand to thank or blame for the strengthening home price gains. Rather, it was a modest increase in demand in conjunction with a large supply decline compared to a year ago that caused price growth to accelerate. Note: August sales were revised downward from last month’s market report.
The metro areas with the largest year-over-year increases in home sales were Anaheim, CA (+22.0%), Bakersfield, CA (+18.8%) and Tulsa, OK (+18.1%). Some metro areas like these are currently seeing large jumps in year-over-year sales due in part to how weak the market was in September 2018. Expensive West Coast markets that saw big drops a year ago, such as San Diego, CA (+16.0%), Los Angeles, CA (+11.1%) and Seattle, WA (+8.3%) are also seeing larger sales increases than the national level. The Bay Area is still weak, however, with San Francisco, CA (-2.2%) and San Jose, CA (-1.9%) continuing to see sales decline.
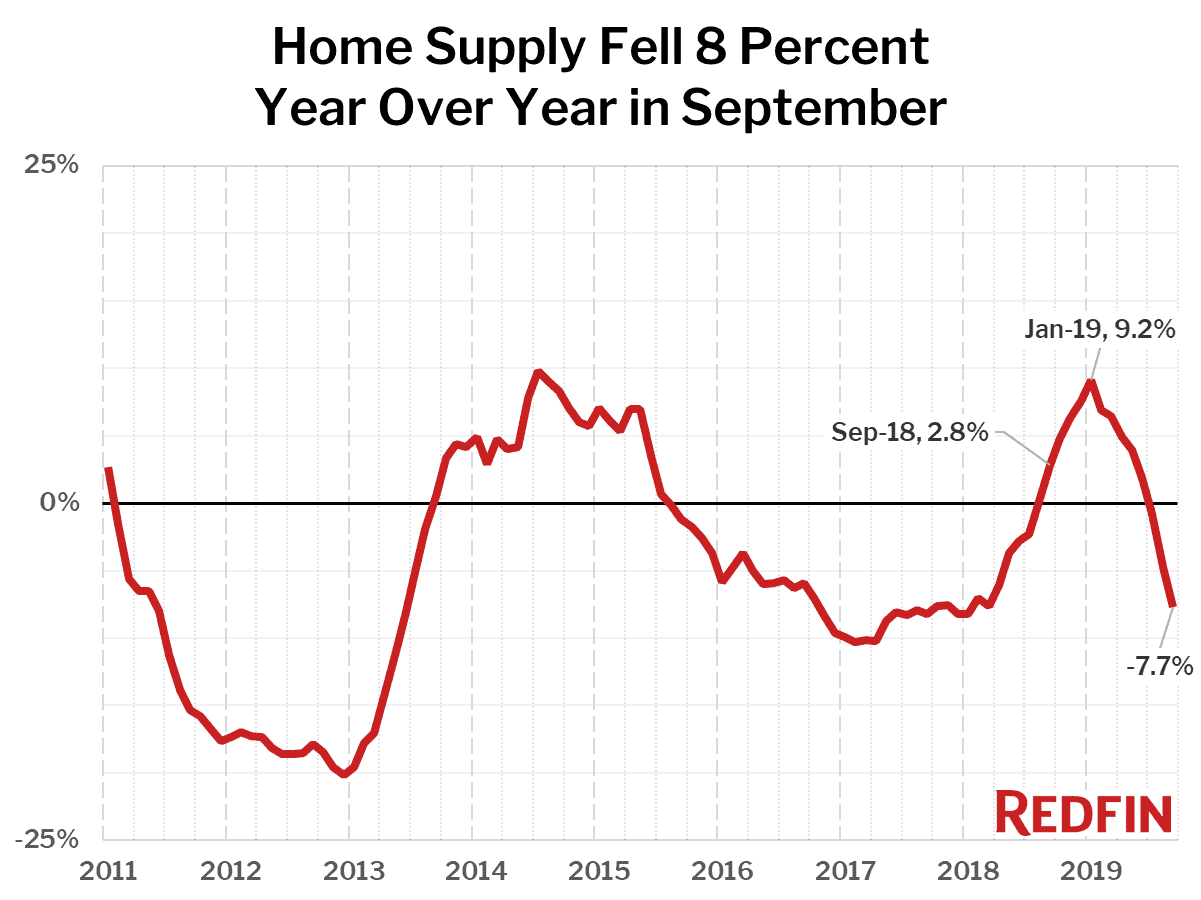
The supply of homes for sale fell 7.7 percent year over year, the biggest decline since January 2018 and the third month in a row of declines. Just 18 of the 85 largest metros tracked by Redfin posted a year-over-year increase in inventory. A continued shortage of new listings while sales hold steady is behind this decline. Seasonally-adjusted new listings were virtually flat from August, but fell 3.6 percent from a year earlier in September, the fourth consecutive month of declines.
The biggest declines in the number of homes for sale were in Salt Lake City, UT (-47.0%), Tulsa, OK (-38.9%) and Baton Rouge, LA (-32.5%)—all relatively affordable metros.
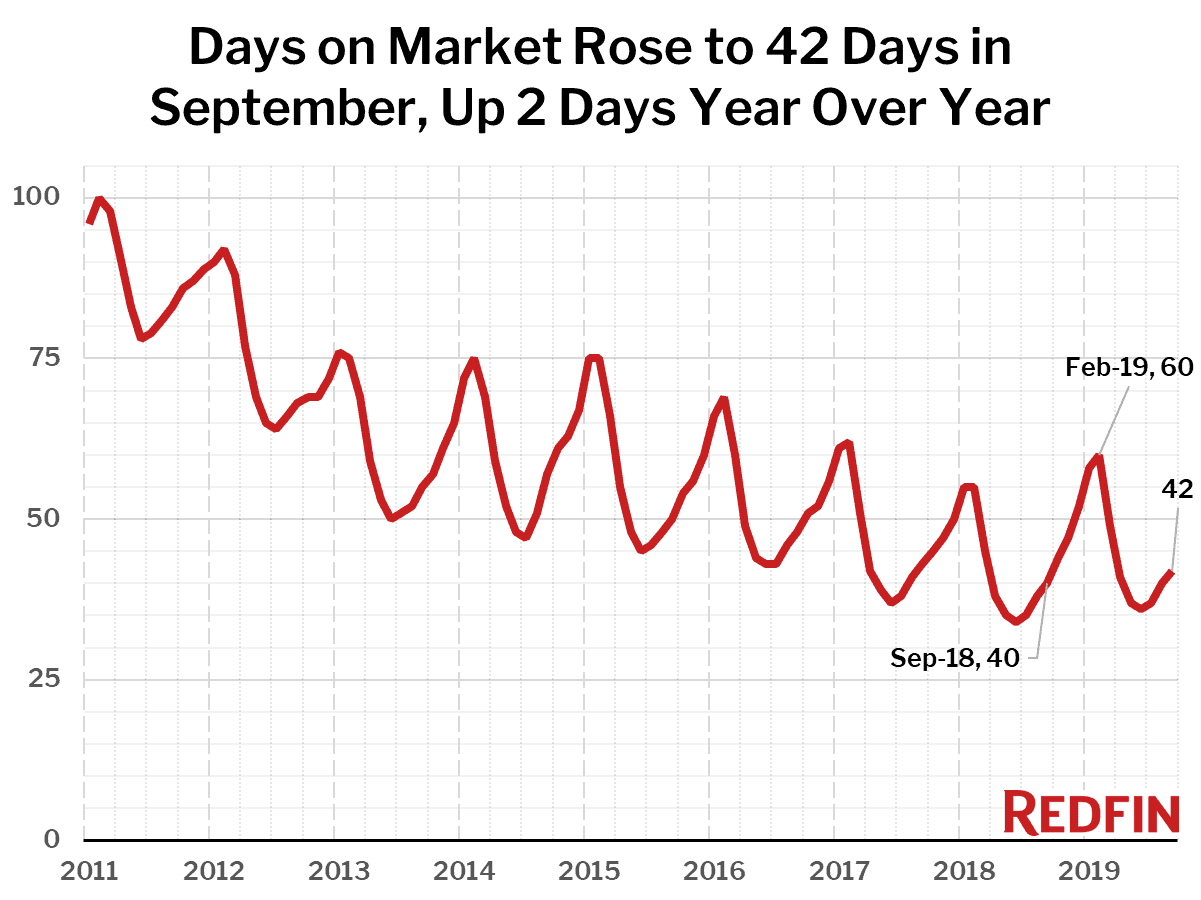
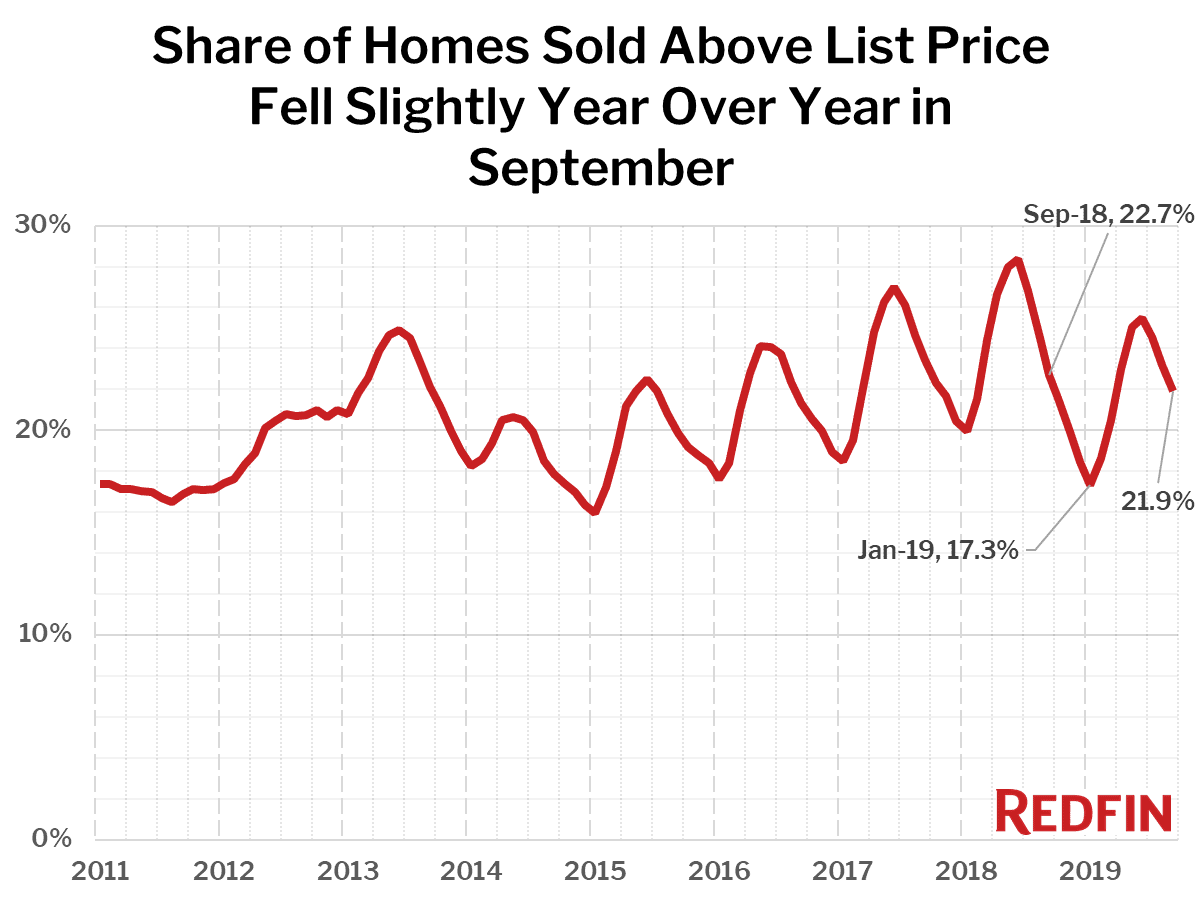
Although inventory is way down and price increases are gaining steam, homes are taking longer to sell and are less likely to sell for more than list price compared to a year ago when the market was beginning to cool.
The typical home that sold in September went under contract in 42 days, up from 40 in September 2018. The share of homes sold above list price fell to 21.9 percent in September from 22.7 percent a year earlier. Also, 27.8 percent of homes listed for sale had a price drop in September, up from 26.4 percent in September 2018.
Other September Highlights
Competition
- Omaha, NE was the fastest market, with half of all homes pending sale in just 12 days, down from 14 days a year earlier. Grand Rapids, MI and was the next fastest market with 13 median days on market, followed by Indianapolis, IN (15), Tacoma, WA (15) and Rochester, NY (17).
- The most competitive market in September was San Francisco, CA where 62.7% of homes sold above list price, followed by 48.0% in Oakland, CA, 46.0% in Tacoma, WA, 45.6% in Buffalo, NY, and 42.2% in Rochester, NY.
Predicted Buyer Discounts
Below are market-by-market breakdowns for prices, inventory, new listings and sales for markets with populations of 750 thousand or more. For downloadable data on all of the markets Redfin tracks, visit the Redfin Data Center.
Median Sale Price
| Redfin Metro |
Median Sale Price |
Month-Over-Month |
Year-Over-Year |
| Albany, NY |
$218,000 |
0.9% |
3.8% |
| Allentown, PA |
$207,900 |
-5.2% |
5.6% |
| Anaheim, CA |
$719,000 |
2.0% |
-1.0% |
| Atlanta, GA |
$248,000 |
0.1% |
4.6% |
| Austin, TX |
$322,000 |
0.6% |
7.3% |
| Bakersfield, CA |
$248,000 |
1.2% |
5.5% |
| Baltimore, MD |
$294,400 |
1.5% |
7.1% |
| Baton Rouge, LA |
$213,000 |
1.9% |
2.9% |
| Birmingham, AL |
$209,900 |
-4.2% |
6.7% |
| Boston, MA |
$490,000 |
-4.9% |
4.3% |
| Bridgeport, CT |
$380,000 |
-8.2% |
0.1% |
| Buffalo, NY |
$164,700 |
-3.1% |
2.9% |
| Camden, NJ |
$199,000 |
-2.9% |
11.2% |
| Charlotte, NC |
$260,000 |
0.0% |
10.2% |
| Chicago, IL |
$245,000 |
-3.9% |
2.1% |
| Cincinnati, OH |
$185,000 |
-2.6% |
7.2% |
| Cleveland, OH |
$155,500 |
-4.6% |
2.6% |
| Columbus, OH |
$216,000 |
-1.8% |
5.9% |
| Dallas, TX |
$295,000 |
-1.6% |
2.1% |
| Dayton, OH |
$154,400 |
8.8% |
13.3% |
| Denver, CO |
$412,000 |
-1.9% |
3.3% |
| Detroit, MI |
$145,000 |
0.0% |
11.6% |
| El Paso, TX |
$166,700 |
-0.8% |
7.1% |
| Elgin, IL |
$213,500 |
-9.1% |
0.3% |
| Fort Lauderdale, FL |
$268,000 |
-2.5% |
3.1% |
| Fort Worth, TX |
$248,000 |
-0.8% |
5.5% |
| Frederick, MD |
$392,500 |
-7.6% |
2.0% |
| Fresno, CA |
$286,800 |
3.2% |
9.2% |
| Grand Rapids, MI |
$210,000 |
-3.4% |
5.1% |
| Greensboro, NC |
$172,000 |
-5.6% |
3.0% |
| Greenville, SC |
$216,400 |
-2.7% |
6.4% |
| Hartford, CT |
$221,500 |
-3.7% |
3.5% |
| Houston, TX |
$244,500 |
-2.2% |
5.6% |
| Indianapolis, IN |
$187,500 |
-5.1% |
5.9% |
| Jacksonville, FL |
$238,900 |
-0.5% |
8.6% |
| Kansas City, MO |
$219,600 |
-4.3% |
7.1% |
| Knoxville, TN |
$218,000 |
-0.9% |
16.0% |
| Lake County, IL |
$230,000 |
-4.4% |
5.7% |
| Las Vegas, NV |
$292,300 |
1.7% |
4.4% |
| Los Angeles, CA |
$640,000 |
0.6% |
4.1% |
| Louisville, KY |
$198,000 |
-4.2% |
10.0% |
| McAllen, TX |
$156,400 |
-1.0% |
8.6% |
| Memphis, TN |
$182,000 |
-4.2% |
2.2% |
| Miami, FL |
$312,000 |
2.3% |
7.6% |
| Milwaukee, WI |
$230,000 |
-4.2% |
9.5% |
| Minneapolis, MN |
$280,000 |
-2.1% |
6.5% |
| Montgomery County, PA |
$330,000 |
-3.0% |
8.2% |
| Nashville, TN |
$300,000 |
-1.6% |
7.1% |
| Nassau County, NY |
$475,000 |
0.0% |
9.2% |
| New Brunswick, NJ |
$330,000 |
-2.4% |
3.1% |
| New Haven, CT |
$219,000 |
-4.2% |
1.9% |
| New Orleans, LA |
$217,200 |
-6.4% |
3.4% |
| New York, NY |
$510,000 |
-4.2% |
3.0% |
| Newark, NJ |
$360,000 |
-6.0% |
7.5% |
| North Port, FL |
$280,000 |
2.6% |
6.7% |
| Oakland, CA |
$725,000 |
-1.8% |
1.4% |
| Oklahoma City, OK |
$185,000 |
-1.2% |
7.6% |
| Omaha, NE |
$205,000 |
-4.7% |
7.3% |
| Orlando, FL |
$260,000 |
-0.4% |
4.8% |
| Oxnard, CA |
$610,000 |
-0.8% |
-0.8% |
| Philadelphia, PA |
$205,000 |
-8.9% |
2.5% |
| Phoenix, AZ |
$280,900 |
-0.4% |
6.8% |
| Pittsburgh, PA |
$173,000 |
-6.5% |
4.8% |
| Portland, OR |
$400,000 |
-2.0% |
3.9% |
| Providence, RI |
$295,000 |
-0.9% |
8.3% |
| Raleigh, NC |
$290,000 |
0.0% |
2.5% |
| Richmond, VA |
$257,000 |
-4.5% |
7.1% |
| Riverside, CA |
$385,000 |
1.1% |
5.2% |
| Rochester, NY |
$154,000 |
-4.9% |
8.1% |
| Sacramento, CA |
$415,000 |
-0.8% |
3.8% |
| Salt Lake City, UT |
$345,000 |
1.5% |
7.8% |
| San Antonio, TX |
$230,000 |
-2.1% |
4.5% |
| San Diego, CA |
$575,000 |
-3.0% |
-0.9% |
| San Francisco, CA |
$1,360,000 |
-1.1% |
-4.6% |
| San Jose, CA |
$1,071,500 |
2.0% |
-2.6% |
| Seattle, WA |
$540,000 |
-3.6% |
-1.2% |
| St. Louis, MO |
$185,000 |
-5.9% |
5.7% |
| Tacoma, WA |
$380,000 |
0.5% |
7.6% |
| Tampa, FL |
$235,000 |
0.0% |
4.4% |
| Tucson, AZ |
$228,000 |
1.3% |
9.5% |
| Tulsa, OK |
$173,100 |
0.6% |
4.1% |
| Urban Honolulu, HI |
$610,000 |
3.4% |
6.1% |
| Virginia Beach, VA |
$239,700 |
-2.2% |
4.2% |
| Warren, MI |
$222,200 |
-2.2% |
10.0% |
| Washington, DC |
$399,900 |
-3.6% |
5.0% |
| West Palm Beach, FL |
$290,000 |
3.0% |
9.4% |
| Worcester, MA |
$280,000 |
-3.4% |
3.7% |
|
National
|
$308,800
|
-1.5%
|
4.6%
|
Homes Sold
| Redfin Metro |
Homes Sold, seasonally adjusted |
Month-Over-Month |
Year-Over-Year |
| Albany, NY |
794 |
-6.3% |
-8.0% |
| Allentown, PA |
908 |
-2.3% |
5.2% |
| Anaheim, CA |
2,567 |
2.8% |
17.5% |
| Atlanta, GA |
8,709 |
-2.3% |
-6.4% |
| Austin, TX |
2,976 |
-1.7% |
5.7% |
| Bakersfield, CA |
817 |
1.7% |
14.5% |
| Baltimore, MD |
3,543 |
1.1% |
1.5% |
| Baton Rouge, LA |
808 |
-6.8% |
-2.0% |
| Boston, MA |
4,100 |
-1.6% |
-1.9% |
| Bridgeport, CT |
980 |
-0.2% |
1.5% |
| Buffalo, NY |
1,010 |
-3.2% |
0.9% |
| Camden, NJ |
1,707 |
0.8% |
4.1% |
| Charlotte, NC |
3,689 |
-1.2% |
5.6% |
| Chicago, IL |
7,711 |
-1.1% |
-3.6% |
| Cincinnati, OH |
2,541 |
-2.5% |
-4.4% |
| Cleveland, OH |
2,498 |
0.5% |
7.0% |
| Columbus, OH |
2,558 |
-0.2% |
1.3% |
| Dallas, TX |
5,602 |
0.6% |
5.2% |
| Dayton, OH |
987 |
1.5% |
5.1% |
| Denver, CO |
4,667 |
-0.4% |
10.0% |
| Detroit, MI |
1,759 |
-0.1% |
-4.1% |
| El Paso, TX |
669 |
-10.7% |
1.1% |
| Elgin, IL |
934 |
-3.7% |
-0.2% |
| Fort Lauderdale, FL |
2,977 |
-0.6% |
1.3% |
| Fort Worth, TX |
2,845 |
-0.6% |
0.4% |
| Frederick, MD |
1,455 |
-3.3% |
0.6% |
| Fresno, CA |
750 |
-2.8% |
0.2% |
| Grand Rapids, MI |
1,267 |
-1.2% |
-3.4% |
| Greensboro, NC |
805 |
-0.5% |
4.4% |
| Greenville, SC |
1,109 |
-1.2% |
8.0% |
| Hartford, CT |
1,337 |
3.0% |
15.8% |
| Houston, TX |
7,417 |
-2.7% |
4.4% |
| Indianapolis, IN |
2,860 |
-2.3% |
-0.3% |
| Jacksonville, FL |
2,437 |
-1.4% |
4.3% |
| Kansas City, MO |
2,923 |
-1.9% |
-2.5% |
| Knoxville, TN |
1,203 |
-1.7% |
0.6% |
| Lake County, IL |
1,040 |
1.0% |
-0.1% |
| Las Vegas, NV |
3,482 |
-0.9% |
9.0% |
| Los Angeles, CA |
5,840 |
2.3% |
7.1% |
| Louisville, KY |
1,306 |
0.2% |
-1.1% |
| McAllen, TX |
275 |
-0.3% |
8.5% |
| Memphis, TN |
1,129 |
0.9% |
-2.9% |
| Miami, FL |
2,494 |
-0.8% |
0.0% |
| Milwaukee, WI |
1,747 |
-1.9% |
0.0% |
| Minneapolis, MN |
4,986 |
-0.8% |
-1.1% |
| Montgomery County, PA |
2,177 |
-2.9% |
-3.4% |
| Nashville, TN |
3,421 |
-0.5% |
12.6% |
| Nassau County, NY |
2,380 |
-4.0% |
-1.8% |
| New Brunswick, NJ |
2,940 |
-1.4% |
-1.1% |
| New Haven, CT |
883 |
-2.9% |
6.5% |
| New Orleans, LA |
1,227 |
3.2% |
3.1% |
| New York, NY |
4,464 |
-2.4% |
-3.0% |
| Newark, NJ |
2,091 |
0.1% |
-0.4% |
| North Port, FL |
1,932 |
0.5% |
6.0% |
| Oakland, CA |
2,190 |
-0.6% |
-0.5% |
| Oklahoma City, OK |
1,845 |
-1.3% |
5.1% |
| Omaha, NE |
1,136 |
-3.3% |
0.8% |
| Orlando, FL |
3,876 |
-1.9% |
1.2% |
| Oxnard, CA |
724 |
0.4% |
12.4% |
| Philadelphia, PA |
2,059 |
-3.1% |
-5.7% |
| Phoenix, AZ |
8,506 |
-1.3% |
11.5% |
| Pittsburgh, PA |
2,141 |
-1.2% |
2.9% |
| Portland, OR |
3,019 |
-3.1% |
-2.1% |
| Providence, RI |
1,735 |
-4.0% |
-3.2% |
| Raleigh, NC |
2,271 |
0.9% |
8.1% |
| Richmond, VA |
1,609 |
1.6% |
11.7% |
| Riverside, CA |
4,679 |
-1.0% |
2.1% |
| Rochester, NY |
1,084 |
1.6% |
5.0% |
| Sacramento, CA |
2,548 |
0.5% |
-0.9% |
| Salt Lake City, UT |
1,545 |
-1.2% |
-6.0% |
| San Antonio, TX |
2,745 |
-1.5% |
1.6% |
| San Diego, CA |
3,084 |
2.1% |
12.7% |
| San Francisco, CA |
875 |
-0.7% |
-4.2% |
| San Jose, CA |
1,107 |
-4.5% |
-4.3% |
| Seattle, WA |
3,711 |
-2.5% |
4.5% |
| St. Louis, MO |
3,449 |
-0.4% |
-0.7% |
| Tacoma, WA |
1,315 |
-0.2% |
-1.6% |
| Tampa, FL |
5,478 |
-0.5% |
6.5% |
| Tucson, AZ |
1,508 |
-1.6% |
5.5% |
| Tulsa, OK |
1,204 |
0.8% |
9.6% |
| Urban Honolulu, HI |
781 |
-0.7% |
1.0% |
| Virginia Beach, VA |
2,128 |
-2.6% |
10.0% |
| Warren, MI |
3,334 |
-0.3% |
-3.0% |
| Washington, DC |
6,108 |
1.2% |
2.2% |
| West Palm Beach, FL |
2,746 |
-0.4% |
-1.6% |
| Worcester, MA |
1,008 |
-2.9% |
-2.3% |
|
National
|
267,300
|
-0.5%
|
1.3%
|
New Listings
| Redfin Metro |
New Listings, seasonally adjusted |
Month-Over-Month |
Year-Over-Year |
| Albany, NY |
1,152 |
11.2% |
4.9% |
| Albuquerque, NM |
831 |
-28.6% |
-38.3% |
| Allentown, PA |
789 |
-14.6% |
-31.9% |
| Anaheim, CA |
2,657 |
-1.7% |
-14.9% |
| Atlanta, GA |
10,522 |
-0.4% |
-4.6% |
| Austin, TX |
3,582 |
5.9% |
6.4% |
| Bakersfield, CA |
875 |
-3.8% |
-5.6% |
| Baltimore, MD |
4,324 |
0.0% |
0.0% |
| Baton Rouge, LA |
694 |
-12.2% |
-29.0% |
| Boston, MA |
5,126 |
5.6% |
-4.4% |
| Bridgeport, CT |
1,438 |
2.7% |
5.6% |
| Buffalo, NY |
1,328 |
6.9% |
10.4% |
| Camden, NJ |
2,069 |
2.2% |
-2.3% |
| Charlotte, NC |
4,108 |
1.2% |
4.4% |
| Chicago, IL |
10,277 |
-0.9% |
-3.5% |
| Cincinnati, OH |
3,093 |
3.0% |
4.5% |
| Cleveland, OH |
2,932 |
0.6% |
2.2% |
| Columbus, OH |
2,909 |
3.7% |
4.4% |
| Dallas, TX |
7,300 |
2.7% |
5.5% |
| Dayton, OH |
1,139 |
3.2% |
-1.4% |
| Denver, CO |
5,037 |
-0.9% |
-2.2% |
| Detroit, MI |
2,416 |
-2.0% |
-3.0% |
| El Paso, TX |
927 |
0.7% |
24.2% |
| Elgin, IL |
1,148 |
-2.9% |
-4.6% |
| Fort Lauderdale, FL |
3,555 |
0.2% |
-13.7% |
| Fort Worth, TX |
3,483 |
2.2% |
4.7% |
| Frederick, MD |
1,784 |
4.9% |
9.8% |
| Fresno, CA |
875 |
-0.4% |
-5.3% |
| Grand Rapids, MI |
1,518 |
2.9% |
6.0% |
| Greensboro, NC |
819 |
-0.5% |
-3.4% |
| Greenville, SC |
1,252 |
-4.1% |
-6.0% |
| Hartford, CT |
1,781 |
4.0% |
9.7% |
| Houston, TX |
9,639 |
-0.4% |
1.8% |
| Indianapolis, IN |
3,064 |
0.3% |
-1.5% |
| Jacksonville, FL |
2,656 |
-2.6% |
-8.8% |
| Kansas City, MO |
2,780 |
-12.1% |
-21.8% |
| Knoxville, TN |
1,332 |
-4.1% |
21.6% |
| Lake County, IL |
1,305 |
-2.8% |
-5.8% |
| Las Vegas, NV |
3,845 |
-1.7% |
-11.9% |
| Los Angeles, CA |
6,745 |
0.4% |
-8.6% |
| Louisville, KY |
1,551 |
2.8% |
2.5% |
| McAllen, TX |
464 |
1.1% |
11.3% |
| Memphis, TN |
1,286 |
1.5% |
-2.5% |
| Miami, FL |
3,832 |
0.3% |
-13.1% |
| Milwaukee, WI |
1,884 |
0.4% |
1.1% |
| Minneapolis, MN |
5,505 |
-0.5% |
-0.9% |
| Montgomery County, PA |
2,609 |
-1.9% |
-6.2% |
| Nashville, TN |
4,066 |
0.5% |
1.4% |
| Nassau County, NY |
3,477 |
3.1% |
1.3% |
| New Brunswick, NJ |
4,017 |
4.8% |
2.6% |
| New Haven, CT |
1,121 |
1.5% |
2.0% |
| New Orleans, LA |
1,556 |
4.9% |
28.0% |
| New York, NY |
8,066 |
7.2% |
-4.4% |
| Newark, NJ |
2,868 |
9.5% |
3.2% |
| North Port, FL |
2,334 |
0.8% |
5.5% |
| Oakland, CA |
2,529 |
2.5% |
-7.3% |
| Oklahoma City, OK |
2,134 |
-4.3% |
4.1% |
| Omaha, NE |
1,199 |
-1.4% |
-1.8% |
| Orlando, FL |
4,366 |
1.0% |
-5.9% |
| Oxnard, CA |
786 |
1.9% |
-9.5% |
| Philadelphia, PA |
2,933 |
5.2% |
3.8% |
| Phoenix, AZ |
8,617 |
-0.3% |
-1.9% |
| Pittsburgh, PA |
2,551 |
5.8% |
8.9% |
| Portland, OR |
3,455 |
0.5% |
-5.1% |
| Providence, RI |
2,182 |
3.4% |
-4.3% |
| Raleigh, NC |
2,485 |
-0.1% |
11.6% |
| Richmond, VA |
1,819 |
3.6% |
6.4% |
| Riverside, CA |
5,354 |
-1.0% |
-10.6% |
| Rochester, NY |
1,242 |
0.8% |
6.5% |
| Sacramento, CA |
2,977 |
0.8% |
-8.0% |
| Salt Lake City, UT |
1,136 |
-24.4% |
-40.4% |
| San Antonio, TX |
3,482 |
4.8% |
10.5% |
| San Diego, CA |
3,163 |
-2.4% |
-13.8% |
| San Francisco, CA |
1,057 |
2.9% |
-7.8% |
| San Jose, CA |
1,249 |
-6.7% |
-21.7% |
| Seattle, WA |
3,897 |
0.0% |
-11.8% |
| St. Louis, MO |
3,313 |
-4.3% |
-19.3% |
| Tacoma, WA |
1,306 |
-1.0% |
-11.2% |
| Tampa, FL |
6,049 |
-0.9% |
-4.6% |
| Tulsa, OK |
1,007 |
-11.8% |
-28.6% |
| Urban Honolulu, HI |
924 |
-8.5% |
-5.2% |
| Virginia Beach, VA |
2,521 |
0.4% |
6.3% |
| Warren, MI |
4,113 |
1.2% |
-0.2% |
| Washington, DC |
7,028 |
3.0% |
-0.3% |
| West Palm Beach, FL |
3,380 |
-0.7% |
-10.6% |
| Worcester, MA |
1,275 |
5.9% |
4.8% |
|
National
|
315,500
|
-0.1%
|
-3.6%
|
All Homes for Sale
| Redfin Metro |
All Homes for Sale |
Month-Over-Month |
Year-Over-Year |
| Albany, NY |
3,353 |
1.2% |
-4.2% |
| Albuquerque, NM |
2,146 |
-8.0% |
-53.5% |
| Allentown, PA |
2,078 |
-5.7% |
-31.9% |
| Anaheim, CA |
7,445 |
-12.4% |
-16.0% |
| Atlanta, GA |
26,202 |
-2.7% |
-6.3% |
| Austin, TX |
7,412 |
-6.0% |
-15.0% |
| Bakersfield, CA |
1,909 |
-4.5% |
-18.1% |
| Baltimore, MD |
11,237 |
0.6% |
0.6% |
| Baton Rouge, LA |
2,556 |
-6.3% |
-32.5% |
| Birmingham, AL |
4,294 |
-7.6% |
-13.8% |
| Boston, MA |
11,115 |
12.8% |
8.1% |
| Bridgeport, CT |
6,229 |
1.2% |
-0.3% |
| Buffalo, NY |
2,386 |
2.4% |
-11.7% |
| Camden, NJ |
5,846 |
-1.8% |
-16.4% |
| Charlotte, NC |
10,683 |
-4.1% |
-7.6% |
| Chicago, IL |
37,195 |
8.2% |
16.2% |
| Cincinnati, OH |
7,951 |
-3.3% |
-10.5% |
| Cleveland, OH |
8,293 |
-4.7% |
-9.0% |
| Columbus, OH |
6,730 |
-2.7% |
-3.6% |
| Dallas, TX |
18,385 |
-7.5% |
-1.0% |
| Dayton, OH |
2,560 |
0.3% |
-17.9% |
| Denver, CO |
8,705 |
-2.8% |
-0.2% |
| Detroit, MI |
5,900 |
-2.8% |
4.9% |
| El Paso, TX |
2,690 |
-1.1% |
4.9% |
| Elgin, IL |
4,004 |
9.3% |
22.5% |
| Fort Lauderdale, FL |
12,956 |
-1.4% |
-4.5% |
| Fort Worth, TX |
7,377 |
-9.0% |
-4.3% |
| Frederick, MD |
3,893 |
7.5% |
-0.9% |
| Fresno, CA |
1,775 |
-0.8% |
-10.3% |
| Grand Rapids, MI |
2,902 |
2.7% |
2.7% |
| Greensboro, NC |
1,855 |
-8.0% |
-24.4% |
| Greenville, SC |
4,180 |
-4.6% |
3.6% |
| Hartford, CT |
5,773 |
-3.2% |
-4.2% |
| Houston, TX |
28,263 |
-4.9% |
0.5% |
| Indianapolis, IN |
5,980 |
-3.0% |
-9.4% |
| Jacksonville, FL |
7,419 |
-3.8% |
-10.8% |
| Knoxville, TN |
4,018 |
-3.6% |
8.7% |
| Lake County, IL |
5,297 |
1.1% |
9.3% |
| Las Vegas, NV |
11,193 |
-5.0% |
17.5% |
| Los Angeles, CA |
17,553 |
-5.7% |
-10.8% |
| Louisville, KY |
3,472 |
0.5% |
-1.4% |
| McAllen, TX |
1,914 |
-1.5% |
0.1% |
| Memphis, TN |
2,949 |
-3.5% |
-10.2% |
| Miami, FL |
17,769 |
0.0% |
-2.9% |
| Milwaukee, WI |
5,469 |
0.6% |
-0.9% |
| Minneapolis, MN |
12,071 |
1.1% |
-4.4% |
| Montgomery County, PA |
6,483 |
5.2% |
-6.0% |
| Nashville, TN |
11,244 |
-0.8% |
-1.8% |
| Nassau County, NY |
11,681 |
-1.4% |
-2.8% |
| New Brunswick, NJ |
12,867 |
-2.1% |
-7.0% |
| New Haven, CT |
3,948 |
-4.0% |
-6.7% |
| New Orleans, LA |
4,486 |
-0.7% |
-23.7% |
| New York, NY |
34,937 |
-0.2% |
-9.3% |
| Newark, NJ |
9,404 |
2.8% |
-0.1% |
| North Port, FL |
5,962 |
-0.8% |
-10.1% |
| Oakland, CA |
4,004 |
6.4% |
-3.8% |
| Oklahoma City, OK |
5,034 |
-4.3% |
-12.8% |
| Omaha, NE |
2,139 |
0.8% |
-10.6% |
| Orlando, FL |
9,449 |
-2.2% |
-11.5% |
| Oxnard, CA |
2,210 |
-9.1% |
5.3% |
| Philadelphia, PA |
7,265 |
5.5% |
3.7% |
| Phoenix, AZ |
15,575 |
-3.9% |
-19.5% |
| Pittsburgh, PA |
8,922 |
-1.0% |
-3.1% |
| Portland, OR |
7,654 |
-3.9% |
-11.7% |
| Providence, RI |
6,137 |
2.5% |
-11.2% |
| Raleigh, NC |
6,422 |
-3.1% |
-6.9% |
| Richmond, VA |
3,442 |
-1.1% |
-9.3% |
| Riverside, CA |
14,492 |
-7.7% |
-17.3% |
| Rochester, NY |
2,019 |
1.2% |
-20.7% |
| Sacramento, CA |
5,943 |
-6.0% |
-13.5% |
| Salt Lake City, UT |
2,424 |
-13.5% |
-47.0% |
| San Antonio, TX |
8,837 |
-6.5% |
-2.3% |
| San Diego, CA |
6,516 |
-8.6% |
-23.2% |
| San Francisco, CA |
2,132 |
49.5% |
5.3% |
| San Jose, CA |
2,489 |
-2.0% |
-1.1% |
| Seattle, WA |
7,405 |
-1.8% |
-18.9% |
| St. Louis, MO |
8,827 |
-2.2% |
-27.5% |
| Tacoma, WA |
1,975 |
-10.5% |
-31.8% |
| Tampa, FL |
12,571 |
-2.3% |
-9.7% |
| Tulsa, OK |
2,668 |
-8.3% |
-38.9% |
| Urban Honolulu, HI |
3,663 |
-2.4% |
9.9% |
| Virginia Beach, VA |
6,183 |
-9.0% |
-16.9% |
| Warren, MI |
10,156 |
-0.1% |
6.2% |
| Washington, DC |
14,129 |
3.0% |
-14.2% |
| West Palm Beach, FL |
12,199 |
-1.5% |
-8.7% |
| Worcester, MA |
2,954 |
3.5% |
-6.5% |
|
National
|
842,800
|
-2.0%
|
-7.7%
|
Median Off-Market Redfin Estimate
| Redfin Metro |
Estimate |
Month-Over-Month |
Year-Over-Year |
| Albany, NY |
$221,600 |
0.2% |
3.0% |
| Allentown, PA |
$224,000 |
1.8% |
8.2% |
| Atlanta, GA |
$233,200 |
0.2% |
9.6% |
| Austin, TX |
$321,200 |
0.3% |
7.5% |
| Bakersfield, CA |
$227,100 |
0.8% |
7.5% |
| Baltimore, MD |
$268,000 |
0.3% |
5.5% |
| Baton Rouge, LA |
$172,900 |
0.3% |
14.6% |
| Birmingham, AL |
$154,300 |
-0.1% |
4.6% |
| Boston, MA |
$500,900 |
0.2% |
2.5% |
| Buffalo, NY |
$166,900 |
1.2% |
7.2% |
| Camden, NJ |
$205,800 |
1.0% |
6.4% |
| Charlotte, NC |
$212,200 |
1.0% |
5.3% |
| Chicago, IL |
$253,500 |
0.9% |
6.6% |
| Cincinnati, OH |
$180,300 |
1.9% |
8.0% |
| Cleveland, OH |
$148,200 |
2.1% |
8.0% |
| Columbus, OH |
$203,100 |
1.9% |
8.8% |
| Dallas, TX |
$267,300 |
0.7% |
5.1% |
| Dayton, OH |
$125,800 |
2.1% |
7.7% |
| Denver, CO |
$419,300 |
0.4% |
2.6% |
| Detroit, MI |
$112,900 |
2.7% |
9.3% |
| Fort Lauderdale, FL |
$272,900 |
0.4% |
4.9% |
| Fort Worth, TX |
$225,700 |
0.7% |
7.5% |
| Fresno, CA |
$264,000 |
0.6% |
4.9% |
| Grand Rapids, MI |
$172,900 |
1.3% |
8.9% |
| Greenville, SC |
$194,500 |
0.6% |
17.6% |
| Houston, TX |
$215,300 |
0.5% |
5.2% |
| Indianapolis, IN |
$171,100 |
0.8% |
8.2% |
| Jacksonville, FL |
$231,200 |
1.2% |
8.2% |
| Kansas City, MO |
$193,200 |
0.6% |
4.4% |
| Knoxville, TN |
$183,000 |
1.5% |
24.0% |
| Las Vegas, NV |
$281,700 |
0.0% |
4.1% |
| Los Angeles, CA |
$639,300 |
0.4% |
2.8% |
| Louisville, KY |
$178,100 |
0.5% |
18.8% |
| Memphis, TN |
$148,000 |
0.2% |
10.9% |
| Miami, FL |
$310,800 |
0.8% |
6.3% |
| Milwaukee, WI |
$201,100 |
1.0% |
-3.7% |
| Minneapolis, MN |
$275,400 |
0.6% |
6.8% |
| Montgomery County, PA |
$326,600 |
0.5% |
3.4% |
| Nashville, TN |
$273,500 |
1.1% |
11.6% |
| New Orleans, LA |
$189,800 |
0.4% |
14.1% |
| Newark, NJ |
$384,000 |
2.3% |
16.2% |
| Oakland, CA |
$772,300 |
-0.3% |
-0.3% |
| Oklahoma City, OK |
$155,000 |
0.7% |
11.3% |
| Omaha, NE |
$183,900 |
0.8% |
9.0% |
| Orlando, FL |
$244,200 |
0.6% |
7.4% |
| Oxnard, CA |
$610,100 |
0.3% |
1.5% |
| Philadelphia, PA |
$193,900 |
0.4% |
-6.3% |
| Phoenix, AZ |
$281,900 |
0.6% |
7.1% |
| Pittsburgh, PA |
$159,600 |
2.6% |
13.7% |
| Portland, OR |
$406,400 |
0.0% |
3.8% |
| Providence, RI |
$306,500 |
0.8% |
4.4% |
| Raleigh, NC |
$278,300 |
0.8% |
6.5% |
| Richmond, VA |
$235,900 |
0.8% |
6.7% |
| Riverside, CA |
$375,800 |
0.5% |
3.8% |
| Rochester, NY |
$153,800 |
0.7% |
7.7% |
| Sacramento, CA |
$423,500 |
0.4% |
5.4% |
| Salt Lake City, UT |
$344,100 |
0.7% |
7.1% |
| San Antonio, TX |
$205,800 |
1.4% |
8.7% |
| San Diego, CA |
$604,200 |
0.2% |
2.2% |
| San Francisco, CA |
$1,343,500 |
-0.2% |
-1.3% |
| San Jose, CA |
$1,154,500 |
-1.1% |
-8.5% |
| Seattle, WA |
$578,900 |
0.5% |
2.1% |
| St. Louis, MO |
$169,700 |
1.4% |
9.5% |
| Tacoma, WA |
$373,600 |
0.2% |
8.6% |
| Tampa, FL |
$231,000 |
0.7% |
8.0% |
| Tucson, AZ |
$224,800 |
0.6% |
10.7% |
| Tulsa, OK |
$144,000 |
0.0% |
5.0% |
| Warren, MI |
$213,600 |
0.6% |
1.2% |
| Washington, DC |
$401,200 |
0.4% |
4.1% |
| West Palm Beach, FL |
$277,300 |
0.5% |
5.5% |
| Worcester, MA |
$296,500 |
0.4% |
4.6% |
|
National
|
$315,900
|
4.0%
|
6.2%
|
 United States
 Canada