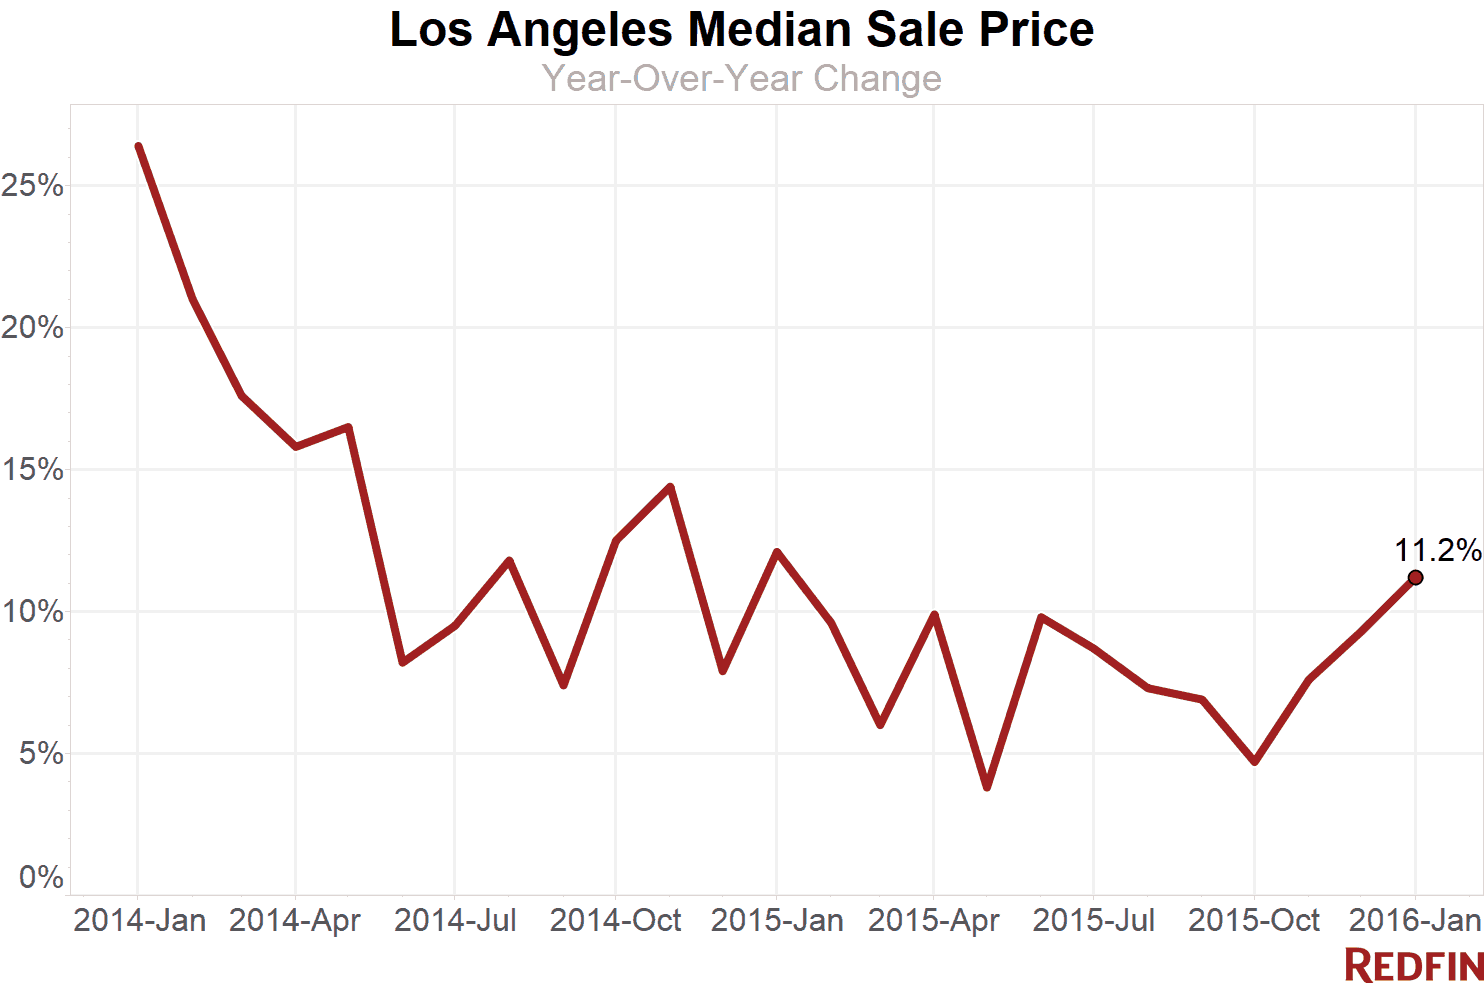
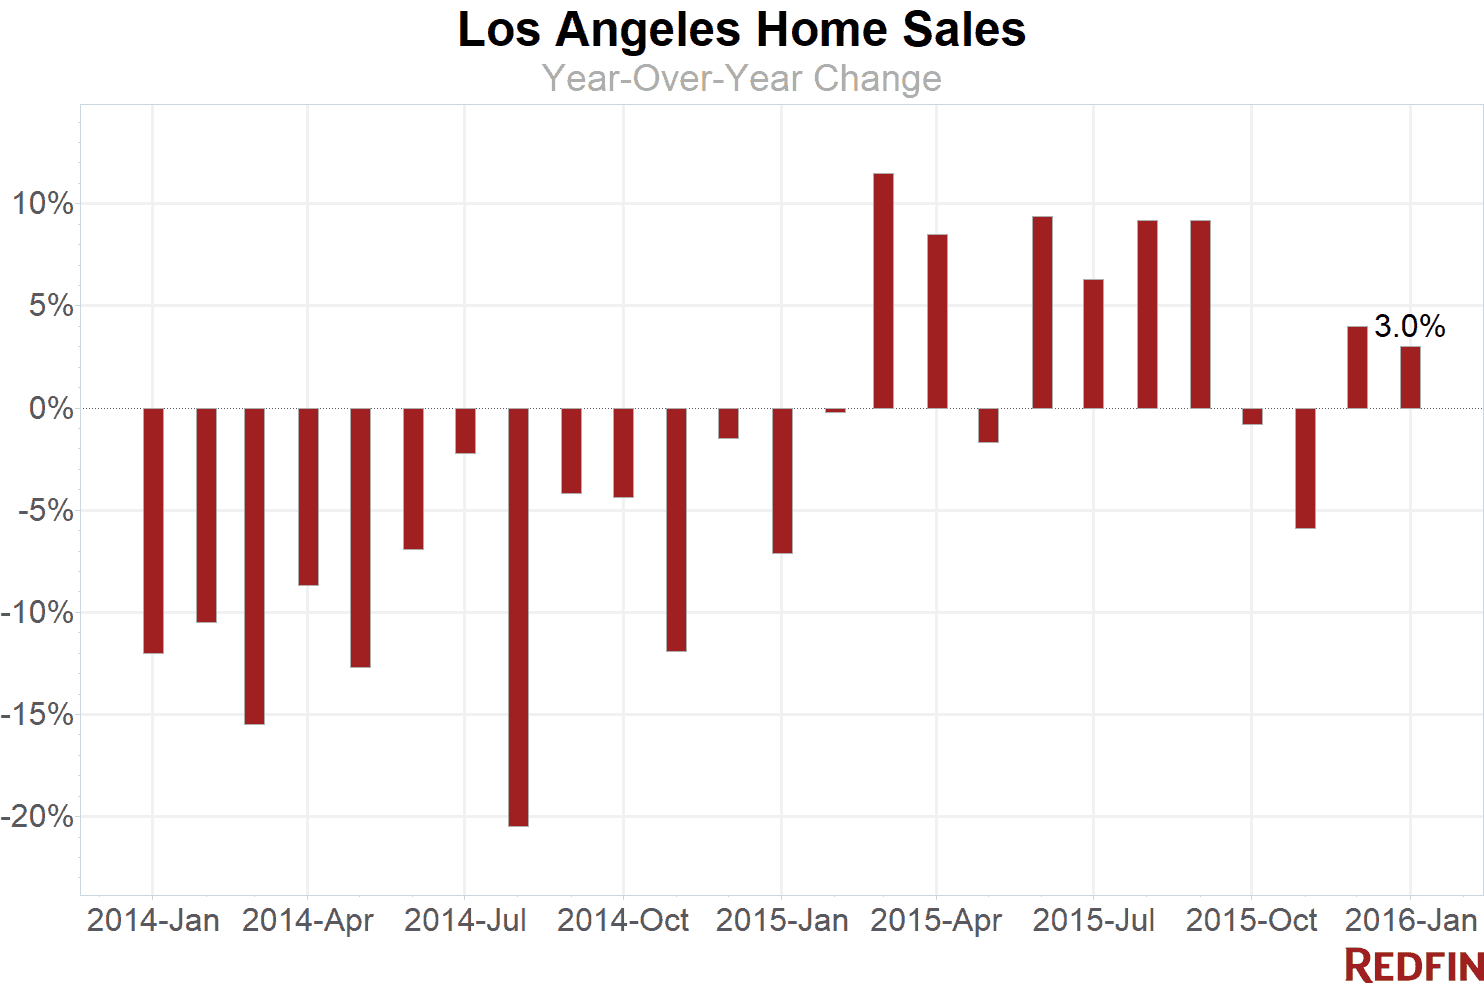
The Los Angeles median home sale price rose 11.2 percent in January from a year earlier to $567,000, continuing a three-month trend of increasing price appreciation. Home sales increased for the second-straight month, rising three percent over last year.
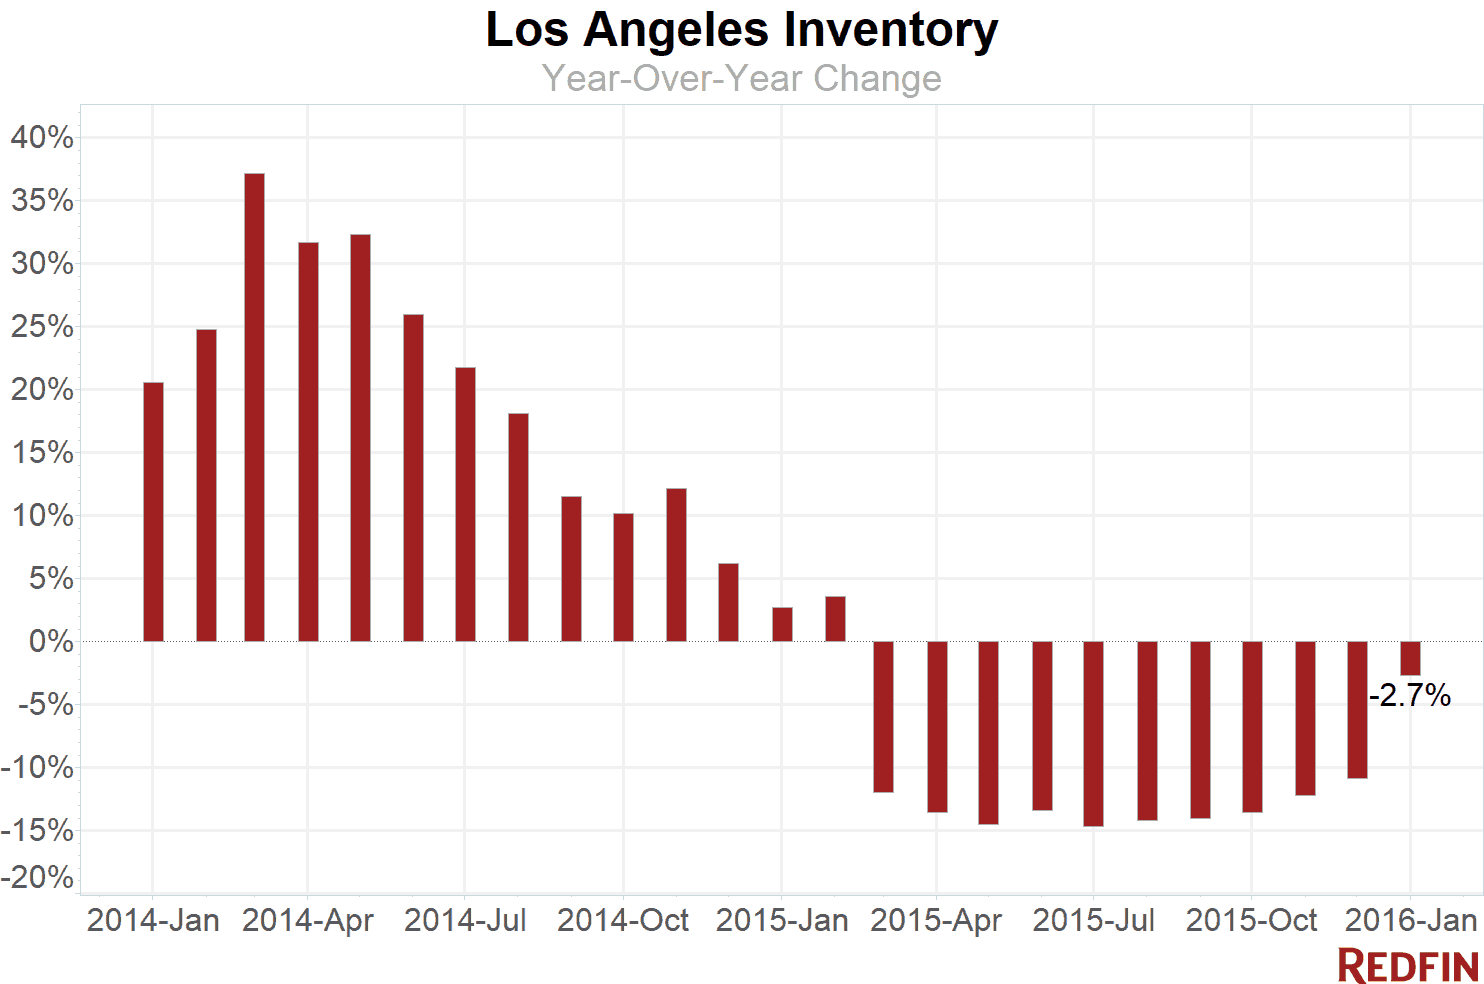
The number of homes for sale in Los Angeles fell 2.7 percent compared to a year earlier, bad news for buyers but an improvement over the double-digit inventory declines the market sustained throughout most of 2015. Thanks in part to a boost in new listings in January — up 1.4 percent over last year — L.A. had more than a three-month supply of properties on offer.
That’s still less than the six months of supply that signals a balanced market. And many of the homes newly listed for sale were out of reach for the typical buyer.
“Low inventory is still a major concern for buyers across Los Angeles as a whole, especially among homes in affordable price ranges,” said Redfin real estate agent Alec Traub, who is seeing a spike in homes being listed for sale in luxury neighborhoods such as the Pacific Palisades and Beverly Hills.
“Sellers in the $3 million-plus price range are starting to express concerns about the softening stock market and global economy,” Traub said. “Many of these properties are also second homes and their owners are more motivated to sell now than they were this time last year.”
Area Trends and Hot Neighborhoods
A significant number of homes went up for sale in several L.A. luxury neighborhoods in January. New listings spiked year over year in Hancock Park (120%), Cheviot Hills (76.5%), Beverly Glen (64.7%) and the Pacific Palisades (62.7%).
The median sale price in all of these neighborhoods was more than $1 million. In the Pacific Palisades it was $2.45 million, the highest of the neighborhoods we tracked this month.
On the other end of the price spectrum, competition intensified in a few of L.A.’s more affordable neighborhoods. Pacoima was the fastest market, with a typical home under contract in eight days. Although nearly half of Pacoima homes sold for more than the seller’s asking price, buyers can still find a home there for less than $400,000.
As predicted, the region’s hottest neighborhood last month was Mount Washington, where prices rose nearly 25 percent to $795,000, and sales jumped almost 20 percent from a year earlier. Homes typically sold within two weeks and fetched five percent more than asking price.
Here’s what’s happening in your neighborhood:
| Neighborhood | Median Sale Price | Year-Over-Year | Homes Sold | Year-Over-Year | Inventory | Year-Over-Year | New Listings | Median Days on Market | Avg Sale-to-List |
|---|---|---|---|---|---|---|---|---|---|
| Beverly Glen | $2,300,000 | 73.1% | 19 | 46.2% | 26 | 0.0% | 28 | 57 | 95.4% |
| Beverly Hills Post Office | $2,350,000 | 52.7% | 43 | 4.9% | 76 | 13.4% | 84 | 38 | 95.1% |
| Brentwood | $1,489,000 | -8.4% | 104 | -5.5% | 104 | 46.5% | 133 | 27 | 97.5% |
| Central LA | $854,000 | 5.4% | 720 | -5.0% | 793 | 9.2% | 1,072 | 31 | 96.8% |
| Century City | $942,500 | 10.9% | 84 | 9.1% | 61 | -9.0% | 85 | 26 | 98.3% |
| Chatsworth | $505,000 | 1.2% | 91 | -5.2% | 81 | 8.0% | 132 | 18 | 97.0% |
| Cheviot Hills | $1,502,833 | -0.8% | 17 | -15.0% | 19 | 280.0% | 30 | 15 | 94.6% |
| Crenshaw | $628,125 | 80.5% | 42 | 68.0% | 17 | -10.5% | 39 | 20 | 100.9% |
| Downtown | $592,000 | 1.2% | 82 | 0.0% | 102 | 20.0% | 109 | 30 | 97.0% |
| Eagle Rock | $692,000 | 7.6% | 58 | 31.8% | 37 | -5.1% | 59 | 19 | 100.9% |
| East LA | $620,000 | 18.8% | 507 | -0.6% | 415 | 12.2% | 667 | 21 | 100.2% |
| Encino | $730,250 | 4.9% | 175 | 6.7% | 125 | 1.6% | 182 | 23 | 96.4% |
| Fox Hills | $430,000 | 1.2% | 22 | -33.3% | 9 | 0.0% | 20 | 14 | 100.6% |
| Glassell Park | $627,500 | 14.3% | 35 | -5.4% | 22 | -26.7% | 30 | 24 | 100.1% |
| Greater Echo Park Elysian | $815,500 | 10.6% | 54 | 31.7% | 62 | 72.2% | 86 | 29 | 97.6% |
| Hancock Park | $1,515,000 | -31.0% | 13 | -31.6% | 25 | 150.0% | 33 | 37 | 95.2% |
| Highland Park | $600,000 | 2.8% | 73 | -24.7% | 57 | 9.6% | 93 | 20 | 100.6% |
| Hollywood | $750,000 | -5.7% | 55 | -12.7% | 68 | 9.7% | 105 | 27 | 98.5% |
| Hollywood Hills West | $1,050,000 | -6.1% | 99 | 4.2% | 118 | 2.6% | 151 | 31 | 95.8% |
| Holmby Hills | $1,174,500 | -23.7% | 6 | 0.0% | 12 | -7.7% | 12 | 66 | 93.9% |
| Lake Balboa | $479,000 | 12.7% | 74 | -18.7% | 43 | 4.9% | 90 | 14 | 99.3% |
| Marina del Rey | $835,000 | 7.1% | 79 | -25.5% | 50 | -20.6% | 71 | 24 | 97.9% |
| Mid-City | $830,000 | 14.5% | 126 | -4.5% | 118 | 0.0% | 166 | 27 | 97.9% |
| Mount Washington | $795,000 | 24.7% | 31 | 19.2% | 18 | 63.6% | 32 | 15 | 104.8% |
| North Hollywood | $470,000 | 9.4% | 119 | -9.8% | 109 | 31.3% | 171 | 20 | 98.2% |
| North Valley | $450,000 | 7.4% | 1,084 | 6.6% | 772 | 17.5% | 1,362 | 16 | 98.6% |
| Northwest San Pedro | $481,000 | 8.1% | 71 | 20.3% | 54 | 10.2% | 76 | 21 | 97.8% |
| Pacific Palisades | $2,450,000 | 19.5% | 79 | 17.9% | 106 | 53.6% | 135 | 36 | 96.3% |
| Pacoima | $360,000 | 9.1% | 66 | 20.0% | 47 | 27.0% | 94 | 8 | 100.6% |
| Panorama City | $399,500 | 11.0% | 79 | -12.2% | 72 | 22.0% | 121 | 16 | 99.8% |
| Sherman Oaks | $792,500 | 15.7% | 194 | -8.9% | 165 | 7.1% | 233 | 18 | 98.2% |
| Silver Lake | $1,001,500 | 9.2% | 57 | 21.3% | 36 | -16.3% | 65 | 19 | 100.8% |
| South Central LA | $354,000 | 8.9% | 188 | 0.5% | 181 | -18.5% | 282 | 24 | 97.5% |
| South LA | $380,625 | 12.3% | 780 | 1.0% | 791 | 0.0% | 1,169 | 24 | 98.5% |
| South Valley | $536,000 | 8.3% | 1,370 | -2.7% | 1,119 | 11.5% | 1,706 | 20 | 97.9% |
| Studio City | $980,000 | 23.3% | 141 | 33.0% | 137 | 39.8% | 173 | 25 | 96.2% |
| Sun Valley | $425,000 | 10.1% | 67 | 0.0% | 41 | -25.5% | 87 | 14 | 98.7% |
| Sylmar | $400,000 | 8.1% | 128 | -0.8% | 96 | 11.6% | 174 | 17 | 98.6% |
| Tarzana | $592,500 | 14.2% | 118 | 16.8% | 97 | 11.5% | 151 | 24 | 97.4% |
| Valley Village | $760,000 | 17.8% | 37 | -30.2% | 35 | 94.4% | 51 | 30 | 97.3% |
| Van Nuys | $471,000 | 9.5% | 93 | -17.0% | 91 | 5.8% | 134 | 16 | 99.6% |
| Venice | $1,642,500 | 10.5% | 80 | -14.9% | 96 | 15.7% | 104 | 31 | 95.8% |
| Watts | $263,000 | 7.9% | 65 | 10.2% | 80 | 63.3% | 104 | 39 | 98.1% |
| West Adams | $522,500 | 18.8% | 42 | 2.4% | 22 | -24.1% | 51 | 14 | 104.0% |
| West Long Beach | $371,500 | 3.2% | 35 | 16.7% | 30 | -11.8% | 47 | 36 | 100.1% |
| West Los Angeles | $1,120,000 | 16.7% | 1,298 | -3.6% | 1,152 | 11.5% | 1,558 | 25 | 97.7% |
| Westwood | $872,500 | 5.1% | 82 | -3.5% | 96 | -13.5% | 118 | 45 | 95.3% |
| Woodland Hills | $675,000 | 3.2% | 189 | 13.2% | 172 | 10.3% | 249 | 15 | 97.3% |
| Los Angeles, CA | $567,000 | 11.2% | 1,786 | 3.0% | 5,930 | -2.7% | 3,517 | 27 | 97.5% |
NOTE: Not all neighborhoods are listed, but totals for L.A. encompass entire city. Data is based on listing information and might not reflect all real estate activity in the market. Neighborhood-specific data is measured over the three months ended Jan. 31. Inventory measures listings active as of Jan. 31.
For more information, contact Redfin journalist services
Phone: 206-588-6863
Email: press@redfin.com
To be added to Redfin’s press release distribution list, subscribe here.
 United States
 Canada