Back in January, we said the housing market was about to become more competitive, and indeed it has. June 2016 marked the fastest, most competitive housing market since Redfin began tracking these metrics in 2009.
In June, the typical home went under contract in 41 days, the shortest time on record, and four fewer days than we saw last June. And 25.9 percent of homes went off the market in just two weeks, up from 22.6 percent last year.
This year’s speed and competition have been driven by a mismatch between supply of and demand for homes that has grown wider each month.
Months of supply dropped to its lowest level at 2.8 months, indicating buyer demand outstripped supply by the widest margin we’ve seen in seven years. Buyers responded to the tight competition by making aggressive offers. The average sale-to-list price percentage hit 95.5, a the highest ratio we’ve seen, up from 94.9 percent last year. And 23.6 percent of homes sold above the list price, up from 22.2 percent last year.
| Market Summary | June 2016 | Month-Over-Month | Year-Over-Year |
|---|---|---|---|
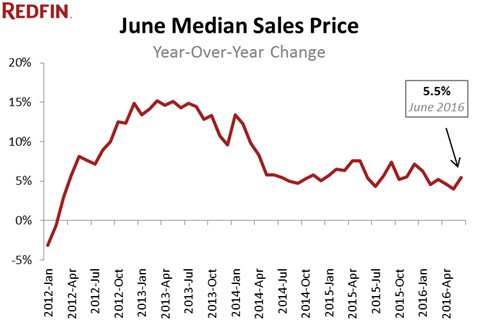
| Median sale price | $276,000 | 2.8% | 5.5% |
| Homes sold | 304,900 | 14.5% | 4.3% |
| New listings | 344,100 | 0.3% | -0.1% |
| All Homes for sale | 852,200 | 1.0% | -7.1% |
| Median days on market | 41 | -2 | -4 |
| Months of supply | 2.8 | -0.4 | -0.3 |
| Sold above list | 23.6% | -0.2% | 1.6% |
| Average Sale-to-list | 95.5% | 0.4% | 0.6% |
“Now that most Denver real estate agents have been navigating this tight inventory, competitive market for a solid two years, a rhythm has emerged and just about every hot home that hits the market here follows it,” said Redfin agent Michelle Ackerman in Denver, the nation’s fastest market, where the typical home went under contract in six days last month. “Homes are listed on Thursday, with a deadline for offers on Monday. Many homes are technically under contract by Monday but that status is often not reflected in the MLS until Tuesday. So homes are actually selling even faster than reported.”
June’s hot market ushered in a 5.5 percent year-over-year increase in home prices, following two consecutive months with price growth below 5 percent.
The price increases did not draw in new sellers, however. New listings were essentially flat in June, ticking down 0.1 percent from a year earlier. Inventory also continued to slide, down 7.1 percent year over year.
Despite the shortage of homes for buyers to choose from, the June market squeaked out a respectable 4.3 percent increase in sales from last year.
What will the second half of the year bring? It all depends on sellers. Buyers have held up their end of the market, spurred by very low mortgage rates. But the lack of new listings continues to crimp overall activity, meaning that there’d be more sales if there were more people selling.
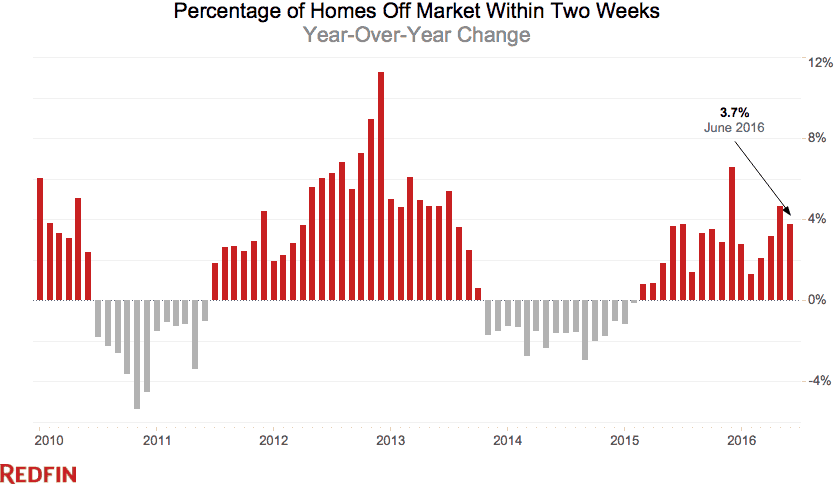
At least one measure suggests that buyers may see some relief from the record-breaking pace of the market later this summer. In June, the percentage of homes that went under contract in less than two weeks came closer to last year’s level, up only 3.7 percent year over year. In May, the year-over-year change was wider at 4.6 percent. If the pattern continues, we may see the market return to a more normal speed. Even a small slowdown in the pace of sales would help supply catch up a bit more with 2016’s white-hot buyer demand.
Other June Highlights
Prices
- Four Florida cities led the nation in price growth. Deltona, FL had the nation’s highest price growth, rising 17.9% since last year to $165,000. Tampa prices rose 16.9% to $194,000 and in Orlando the median sale price rose 16.7% to $210,000.
- The Pacific Northwest was another region that saw strong price acceleration last month. Portland median sales prices rose 12.3% to $347,000, Tacoma was up 12.0% to $285,000 and Seattle was up 11.4% to $462,500.
- Only 4 cities saw price declines of more than 1% in June including Allentown, PA (-4.1%), Tulsa, OK (-3.1%), Wilmington, DE (-1.7%), and Rochester, NY (-1.0%).
Sales
- A third of metros saw sales surge by double digits from last year. Lakeland, FL led the nation in year-over-year sales growth, up 45.4%, followed by Deltona, Fl, up 42.4%. Charleston, SC rounded out the top three with sales up 39% from a year ago.
- Cincinnati saw the largest decline in sales since last year, falling 16.6%. Home sales in Las Vegas and Baltimore declined by by 16.1% and 16.0%, respectively.
- After a spring selling season marked by sales declines, 11 metro regions in the West saw year-over-year increases in home sales last month, including San Jose (21.1%), Tacoma (9.0%), Tucson (8.8%), Ventura County (6.7%), Phoenix (5.6%), Riverside-San Bernadino (4.6%), Seattle (4.5 %), Ogden (3.2%), Honolulu (3.1%), Denver (2.6%) and Bakersfield (1.1%). Sales were relatively flat in Fresno (0.4%), Sacramento (0.4%) and Los Angeles (0.2%), and declined by 12.6% in Oakland, 3.8% in San Diego and 2.6% in San Francisco.
Competition
- Denver was the fastest market, with half of all homes pending sale in just 6 days, down from 9 days from a year earlier. Seattle and Portland tied for the next fastest market with 8 median days on market.
- The Bay Area continues to court the most aggressive buyers with 68.2% of homes in San Jose sold above list price, followed by 68.0% in Oakland and 64.4% in San Francisco. In sharp contrast, the sold above list percentage equaled 0% in Dallas, Poughkeepsie, NY and Pittsburgh, PA.
Inventory
- Grand Rapids had the largest decrease in overall inventory, falling 42.6% since last June. Madison, WI (-28.3%), Fresno (-27.9%), and Tacoma (-25.5%) also continued seeing far fewer homes available on the market than a year ago.
- Birmingham, AL had the highest increase in the number of homes for sale, up 49.2% year over year, followed by St. Louis (36.7%) and San Jose (35.6%).
You can download data from the June Market Tracker in an Excel spreadsheet. The tables that follow feature Redfin’s largest metro regions. For all of our data coverage, visit the Data Center.
For additional local analysis, see: Chicago, Los Angeles, Miami, San Francisco and Washington, D.C.
Median Sale Price
| Redfin Metro | Median Sale Price | Month-Over-Month | Year-Over-Year |
|---|---|---|---|
| Atlanta, GA | $210,000 | 1.0% | 5.0% |
| Baltimore, MD | $275,000 | 5.8% | 7.8% |
| Boston, MA | $395,000 | 6.8% | 3.9% |
| Chicago, IL | $240,000 | 5.5% | 5.1% |
| Cleveland, OH | $145,000 | 8.2% | 7.4% |
| Dallas-Fort Worth, TX | $248,000 | 3.8% | 10.3% |
| Denver, CO | $360,000 | 0.8% | 11.1% |
| Detroit, MI | $170,000 | 10.4% | 11.3% |
| Edison, NJ | $296,000 | 2.8% | 2.1% |
| Houston, TX | $230,000 | 2.2% | 3.4% |
| Kansas City, MO | $190,800 | 2.0% | 3.1% |
| Las Vegas, NV | $215,000 | 2.4% | 7.5% |
| Long Island, NY | $406,000 | 4.9% | 6.8% |
| Los Angeles, CA | $540,000 | 0.2% | 7.2% |
| Miami, FL | $260,000 | 4.0% | 6.2% |
| Minneapolis-St. Paul, MN | $242,000 | 3.0% | 6.6% |
| Oakland, CA | $652,000 | 1.4% | 8.7% |
| Orange County, CA | $640,000 | 1.2% | 5.6% |
| Orlando, FL | $210,000 | 6.6% | 16.7% |
| Philadelphia, PA | $254,000 | 5.9% | 5.0% |
| Phoenix, AZ | $232,000 | 1.8% | 7.7% |
| Pittsburgh, PA | $160,100 | 6.8% | 2.0% |
| Portland, OR | $347,000 | 2.1% | 12.3% |
| Riverside-San Bernardino, CA | $318,000 | 1.6% | 6.0% |
| Sacramento, CA | $350,000 | 2.6% | 8.4% |
| San Antonio, TX | $205,000 | 1.2% | 3.8% |
| San Diego, CA | $499,000 | -0.2% | 3.3% |
| Seattle, WA | $462,500 | 5.1% | 11.4% |
| St. Louis, MO | $179,000 | 4.7% | 0.3% |
| Tampa, FL | $194,000 | 4.9% | 16.9% |
| Washington, DC | $387,000 | 3.2% | 1.8% |
| National | $276,000 | 2.8% | 5.5% |
All Homes for Sale
| Redfin Metro | All Homes for Sale | Month-Over-Month | Year-Over-Year |
|---|---|---|---|
| Atlanta, GA | 35,714 | 9.6% | 1.0% |
| Baltimore, MD | 12,588 | 0.8% | -14.1% |
| Boston, MA | 13,775 | 1.6% | -23.5% |
| Chicago, IL | 50,162 | -1.1% | -9.6% |
| Cleveland, OH | 10,368 | -2.5% | -17.4% |
| Dallas-Fort Worth, TX | 16,072 | -3.6% | -14.0% |
| Denver, CO | 7,082 | 16.9% | -14.3% |
| Detroit, MI | 14,763 | 4.5% | -21.8% |
| Edison, NJ | 16,108 | -5.9% | -10.9% |
| Houston, TX | 24,452 | 2.0% | 15.7% |
| Las Vegas, NV | 13,625 | -4.5% | -5.8% |
| Long Island, NY | 13,385 | -2.6% | -18.6% |
| Los Angeles, CA | 17,081 | 3.9% | 2.1% |
| Miami, FL | 18,166 | -0.4% | 6.1% |
| Minneapolis-St. Paul, MN | 13,980 | 4.7% | -14.2% |
| Oakland, CA | 3,509 | 6.7% | -4.5% |
| Orange County, CA | 8,759 | 5.4% | 9.0% |
| Orlando, FL | 11,217 | -3.4% | -19.1% |
| Philadelphia, PA | 17,802 | 0.2% | -16.7% |
| Phoenix, AZ | 21,991 | -7.2% | 2.1% |
| Portland, OR | 5,880 | 10.8% | -16.7% |
| Riverside-San Bernardino, CA | 16,966 | 1.2% | 4.8% |
| Sacramento, CA | 5,976 | 5.9% | -18.5% |
| San Antonio, TX | 7,186 | -5.0% | -7.1% |
| San Diego, CA | 6,959 | 3.8% | -11.5% |
| Seattle, WA | 5,674 | 10.6% | -19.5% |
| St. Louis, MO | 16,087 | 9.2% | 36.7% |
| Tampa, FL | 15,300 | -4.0% | -14.1% |
| Washington, DC | 19,802 | -2.1% | -18.0% |
| National | 852,200 | 1.0% | -7.1% |
New Listings
| Redfin Metro | New Listings | Month-Over-Month | Year-Over-Year |
|---|---|---|---|
| Atlanta, GA | 12,848 | 4.5% | 4.7% |
| Baltimore, MD | 5,256 | -0.9% | 7.1% |
| Boston, MA | 8,958 | -0.5% | -9.3% |
| Chicago, IL | 15,858 | -4.3% | -6.0% |
| Cleveland, OH | 3,415 | -2.3% | -9.8% |
| Dallas-Fort Worth, TX | 10,936 | 7.4% | -1.1% |
| Denver, CO | 7,062 | 10.2% | 5.7% |
| Detroit, MI | 8,279 | 3.6% | -2.3% |
| Edison, NJ | 4,338 | -6.4% | -5.1% |
| Houston, TX | 10,438 | 3.9% | 4.2% |
| Kansas City, MO | 4,103 | 0.2% | 17.3% |
| Las Vegas, NV | 4,258 | -1.6% | -0.1% |
| Long Island, NY | 3,667 | -12.3% | -12.9% |
| Los Angeles, CA | 10,048 | 10.2% | 7.1% |
| Miami, FL | 4,488 | 2.7% | 2.6% |
| Minneapolis-St. Paul, MN | 7,795 | -1.7% | 2.5% |
| Oakland, CA | 3,435 | 4.5% | 2.7% |
| Orange County, CA | 4,386 | 7.5% | 12.1% |
| Orlando, FL | 4,478 | -3.2% | -7.2% |
| Philadelphia, PA | 5,896 | -6.2% | -5.4% |
| Phoenix, AZ | 8,773 | -2.3% | 4.7% |
| Pittsburgh, PA | 2,510 | -2.0% | -6.3% |
| Portland, OR | 5,165 | 4.9% | 2.4% |
| Riverside-San Bernardino, CA | 7,438 | 5.3% | 13.1% |
| Sacramento, CA | 3,985 | 2.1% | 0.1% |
| San Antonio, TX | 3,163 | 2.2% | -5.7% |
| San Diego, CA | 4,357 | 2.8% | -1.2% |
| Seattle, WA | 6,221 | 6.3% | 9.9% |
| St. Louis, MO | 5,268 | 8.2% | 31.6% |
| Tampa, FL | 5,888 | -1.4% | -2.0% |
| Washington, DC | 9,993 | -4.5% | -2.5% |
| National | 344,100 | 0.3% | -0.1% |
Homes Sold
| Redfin Metro | Homes Sold | Month-Over-Month | Year-Over-Year |
|---|---|---|---|
| Atlanta, GA | 12,704 | 24.6% | 25.3% |
| Baltimore, MD | 4,452 | 12.2% | -16.0% |
| Boston, MA | 7,958 | 35.1% | 3.6% |
| Chicago, IL | 16,376 | 29.9% | 13.2% |
| Cleveland, OH | 3,022 | 16.8% | 11.3% |
| Dallas-Fort Worth, TX | 8,948 | 5.0% | -5.3% |
| Denver, CO | 6,070 | 22.3% | 2.6% |
| Detroit, MI | 7,569 | 18.8% | 5.1% |
| Edison, NJ | 3,099 | 26.6% | 15.1% |
| Houston, TX | 8,004 | 6.5% | 4.9% |
| Kansas City, MO | 3,902 | 8.5% | 13.8% |
| Las Vegas, NV | 3,049 | -16.6% | -16.1% |
| Long Island, NY | 2,731 | 33.4% | 7.2% |
| Los Angeles, CA | 7,552 | 11.8% | 0.2% |
| Miami, FL | 3,168 | 14.1% | -2.0% |
| Minneapolis-St. Paul, MN | 8,559 | 30.7% | 18.1% |
| Oakland, CA | 2,797 | 8.2% | -12.6% |
| Orange County, CA | 3,124 | 2.2% | -2.2% |
| Orlando, FL | 4,967 | 26.5% | 10.4% |
| Philadelphia, PA | 5,635 | 26.2% | 6.7% |
| Phoenix, AZ | 8,943 | 3.4% | 5.6% |
| Pittsburgh, PA | 2,472 | 11.7% | 6.2% |
| Portland, OR | 4,038 | 6.5% | -9.4% |
| Riverside-San Bernardino, CA | 5,573 | 9.0% | 4.6% |
| Sacramento, CA | 3,281 | 10.9% | 0.4% |
| San Antonio, TX | 2,701 | 6.7% | -2.4% |
| San Diego, CA | 3,764 | 5.2% | -3.8% |
| Seattle, WA | 5,415 | 16.0% | 4.5% |
| St. Louis, MO | 3,927 | -10.6% | 7.9% |
| Tampa, FL | 6,904 | 26.5% | 10.3% |
| Washington, DC | 9,343 | 11.5% | -12.8% |
| National | 304,900 | 14.5% | 4.3% |
Other popular posts:
1. Guide to Downsizing for Seniors and Their Loved Ones
2. The Complete Guide to Pool Safety for Parents of Disabled Children
3. 5 Things You Must Know as the Executor of an Estate
 United States
 Canada